Hello Friends! Thanks so much for stopping by and visiting my blog, Stock Picks Bob's Advice. As always, please remember that I am an amateur investor so please consult with your professional investment advisors prior to making any investment decisions based on information on this website. I cannot be responsible for any losses generated by your own trading activity, nor shall I ask for any credit for any gains you may generate!
 First of all, I should apologize for not posting my usual "Weekend Review". I shall be doing that next weekend hopefully. This blog is actually approaching the two year point, and I shall have to decide if reviewing stock picks from two years out is something I should be pursuing. Let me know if you have any thoughts on this at bobsadviceforstocks@lycos.com.
This morning, while looking through the list of top % gainers on the NYSE, I came across Too, Inc. (TOO) which, as I write, is trading at $23.74, up $.95 or 4.17% on the day. I do not have any shares of Too, nor do I own any options or other leveraged positions.
 According to the Yahoo "Profile" on TOO, Too "...is a specialty retailer, operating two divisions that cater to "tween" (ages seven to 14) girls, Limited Too and Justice."
On February 16, 2005, TOO reported 4th quarter 2004 results. Net sales for the quarter rose 13% to $206.8 million. Net income came in at $23.3 million or $.66/diluted share, up from $17.7 million in the fourth quarter 2003 or $.51/diluted share. Same store sales for the quarter increased 5% compared with a 6% decline in same store sales the prior year. In addition, the company provided optimistic guidance for the upcoming first quarter 2005 results, with earnings estimated at $.27/share, which would be a 42% increase over the prior year's results. The company also announced expected comparable store sales increases in the low to mid-single digit range for spring 2005.
How about longer-term results? Taking a look at the "5-Yr Restated" financials on Morningstar.com for TOO, we can see that revenue growth has been steady, except for what I would call a "hiccup" in 2004, increasing from $450.4 million in 2000 to $651.8 million in the trailing twelve months (TTM).
Earnings also took a hit in 2004, increasing from $1.02/share in 2001 to a peack of $1.38/share in 2003 before dipping to $.65/share in 2004 and increasing now to $1.03/share in the TTM.
Free cash flow has improved smartly the past few years. Per Morningstar, free cash flow was $5 million in 2002, and increased yearly to the $52 million reported in the TTM.
The balance sheet is solid with $135.9 million in cash, more than enough to cover botht the $101.2 million in current liabilities and the $14.2 million in long-term debt combined. In addition, TOO has $112.7 million in other current assets.
 How about "valuation"? Reviewing "Key Statistics" on Yahoo for TOO, we can see that this company is a mid cap stock with a market capitalization of $827.06 million.
The trailing p/e is a bit rich at 42.50, but the company is growing so quickly that the forward p/e (fye 31-Jan-06) is downright cheap at 14.36. Thus, the "5 yr expected" PEG is 0.91, with imho anything under 1.0 being a great buy.
How about "Price/Sales" ratios? TOO comes in at 1.30. According to my Fidelity Brokerage"research", the average P/S ratio for the industry is 1.06, making TOO a bit pricey. Some of the other competitors include ANF with a P/S of 2.4, AEOS at 2.1, PSUN at 1.5, and GPS at 1.1 and ANN at 0.9. Note that the faster growing companies, as expected, have a bit higher Price/Sales ratios and TOO doesn't come in too badly at all!
Yahoo reports 34.69 million shares outstanding with 34.60 million of them that float. Of these, there were 1.70 million shares out short as of 3/8/05, representing 4.92% of the float or 2.979 trading days of volume. With my "3 day cutoff" of short interest, this doesn't look too significant to me.
There are no cash dividends nor stock splits reported on Yahoo.
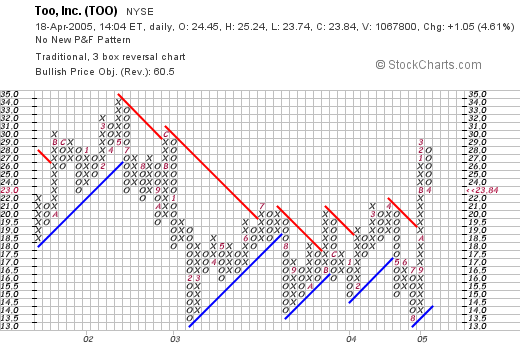
How about the chart? What do the "technicals" look like? Taking a look at a TOO "Point & Figure Chart" from Stockcharts.com":

we can see that this stock actually peaked arount $34 in May, 2002, and has traded lower since then to a low of $13.50 in August, 2004. The stock has moved higher since, breaking through a resistance level (the red line moving lower at a 45 degree angle), and is now trading higher at the $24 range. The chart looks encouraging, certainly not over-extended, but not the strongest stock I have reviewed on this website!
So what do I think? Well, I think this company hit a weak spot in 2004, and the price of the stock suffered. However, the latest quarter was strong, same store sales growth have been steady, the last five years have overall been positive. Free cash flow is growing. The balance sheet is beautiful and valuation is reasonable with a PEG under 1.0. Overall I like this stock!
Now, if I just had some cash or at least a signal to buy shares...hmmmm. Anyhow, thanks so much for stopping by and visiting! If you have any questions, comments, or words of encouragement, please feel free to email me at bobsadviceforstocks@lycos.com. Remember that I AM truly an amateur, so please do your own investigations on all stocks discussed!
Bob


