Stock Picks Bob's Advice
Wednesday, 26 January 2011
Cisco (CSCO)
Hello Friends! Thanks so much for stopping by and visiting my blog, Stock Picks Bob's Advice! As always, please remember that I am an amateur investor, so please remember to consult your professional investment advisers prior to making any investment decisions based on information on this website.
 There are few companies with a record of growth in both revenue, earning, and stock price to match Cisco (CSCO). From the Cisco website I have included a chart of the revenue growth for this company that is just a year or two over 25. The history of this company is just as intriguing as the usual garage start-up story that is the story of Apple (AAPL) and other silicon valley companies.
I do not own any shares of Cisco (CSCO). The stock closed at $21.42 on 1/26/11, down $.12 or (-.56%) on the day.
As the story goes:
"Cisco was founded on December 10, 1984 by husband and wife Len Bosack and Sandy Lerner, two former Stanford University computer scientists whose efforts to enable email between computers on different networks led to the invention of the first multiprotocol router. This seminal breakthrough played a major role in fueling the growth of the Internet."
This company generated an incredible record of revenue growth:
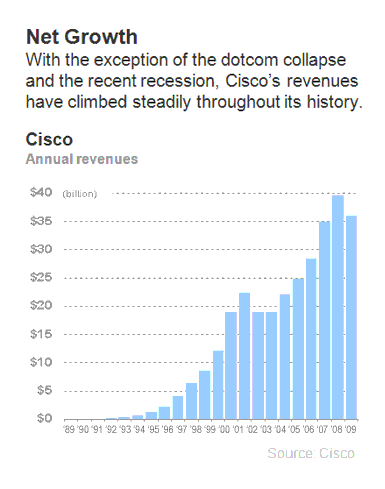
And yet, the stock price has lagged the growth in revenue. If we look at a ten-year chart of Cisco (CSCO) from Fidelity.com, we can see that Cisco has gone absolutely nowhere during this period of continued growth.
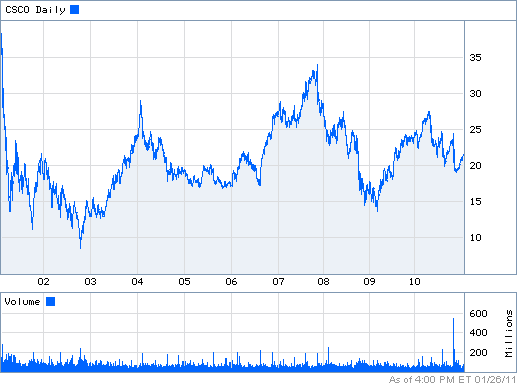
Is it possible then that with this absence of price appreciation while the company continued to grow is business, that this company might just possibly be a terrific value for an investor? Or will this stock instead be stuck in another ten year period of no price appreciation?
Let's briefly take a look at this stock, this company, and see whether it might be a stock we should be adding to our own porfolios.
According to the Yahoo "Profile" on Cisco (CSCO), the company
"...designs, manufactures, and sells Internet protocol (IP)-based networking and other products related to the communications and information technology industry worldwide. It offers routers that interconnect public and private IP networks for mobile, data, voice, and video applications; switching products, which offer connectivity to end users, workstations, IP phones, access points, and servers; application networking services; and home networking products, such as adapters, gateways, modems, and home network management software products. The company also provides security products comprising span firewall, intrusion prevention, remote access, virtual private network, unified client, Web, and email security products; storage area networking products that deliver connectivity between servers and storage systems; unified communication products to integrate voice, video, data, and mobile applications on fixed and mobile networks; video systems, including digital set-top boxes and digital media products; and wireless systems."
Clearly Cisco, through its internal growth and many acquisitons does a lot of high-tech 'stuff'.
In the latest quarter, CSCO reported 1st quarter 2011 results on November 10, 2010. Revenue for the quarter came in at $10.75 billion, up 19% above the forecast of $10.74 billion. Earnings came in at $.42/share (after unusual items), beating expectations of $.40/share the analysts expected. All in all it wasn't a bad report except that there was some uncertainty about the economy and that new orders were below company expectations. The stock didn't bounce on the news of the earnings exceeding expectations, but dipped again on the guarded outlook.
Looking longer term at the Morningstar.com "5 Yr Financials", we can see that the company has grown even while the stock price stagnated with revenue of $28.5 billion in 2006, increasing to $40 billion in 2010 and $41.8 billion in the trailing twelve months (TTM). Diluted earnings per share came in at $.89/share in 2006, increasing to $1.33/share in 2010 and $1.36 in the TTM. During the same period, CSCO has been buying back shares with 6.3 billion in 2006, reducing this number to 5.85 billion in 2010 and 5.80 billion in the TTM.
In terms of the balance sheet, Morningstar shows Cisco with $51.4 billion in current assets as of 7/10, and $19.2 billion in total current liabilities. Indeed total liabilities, including both current and long-term liabilities, totaled $36.8 billion suggesting Cisco (CSCO) was financially fit, easily covering ALL of its liabilities with just the current liabilities.
Free cash flow has been solid with $7.1 billion reported in 2006 increasing up to $9.18 billion in the TTM.
Valuation-wise, looking at "Key Statistics" on Cisco (CSCO) from Yahoo, we can see that this is a large cap stock with a market capitalization of $118.73 billion. The trailing p/e is 15.64 and the forward p/e (fye Jul 31, 2012) is 11.70. Thus, the PEG ratio is a very inexpensive 1.09. Yahoo reports 5.54 billion shares outstanding with the same number of shares that float. As of 12/31/10 there were 41.16 million shares out short representing 0.6 days of trading volume (well below my own arbitrary 3 day rule). There are no dividends paid, and the last stock split was over 10 years ago, a 2:1 split on March 23, 2000. It should be noted that Cisco (CSCO) while currently not paying a dividend, intends to start paying one in 2011.
As I indicated above, CSCO has gone relatively nowhere in terms of its stock price for the past ten years. Looking at a recent 'point & figure' chart on Cisco from StockCharts.com, we can see that for at least the past 6 years, we have seen what could best be described as a sine wave pattern in stock price.
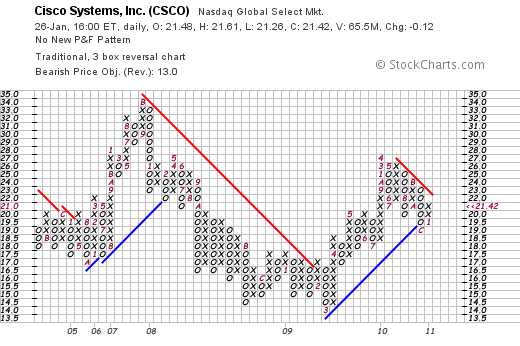
From all of this, we can see that certainly Cisco (CSCO) as a stock has good value with a p/e in the low teens and a PEG just above 1.0. The company has been growing its revenue, its earnings, but its stock price has been lagging. As our economy recovers and interest in networking and cloud computing grows, it appears that we may be early in Cisco (CSCO) as an investment and with valuation where it is, it appears to be in a good position to appreciate in price.
Thank you again for stopping by and visiting my blog! If you have any questions or comments please leave them right here on this website or email me at bobsadviceforstocks@lycos.com.
Yours in investing,
Bob
Monday, 24 January 2011
Amazon (AMZN)
Hello Friends! Thanks so much for stopping by and visiting my blog, Stock Picks Bob's Advice! As always, please remember that I am amateur investor, so please remember to consult with your professional investment advisers prior to making any investment decisions based on information on this website.
 Like so many of you, I have gradually become a confirmed fan of the Amazon retail website. It is incredibly easy and the service is incredibly good at finding all sorts of merchandise that I might otherwise not purchase and delivering it right to my doorstep. In spite of my own endorsement of the 'Amazon experience', I do not own any shares of Amazon (AMZN) which closed at $176.85 on 1/24/11.
Perhaps to understand the Amazon (AMZN) retail pipeline it may be helpful to know a little about its namesake, the Amazon River. I found this website on the Amazon that revealed this information:
"The Amazon River is the world's second longest river. Only the Nile, in Africa, is longer. The Amazon however, at any one point in time has the highest amount of water flowing down it. No other river even comes close. It may not be the longest, but it is the widest.
The Amazon produces approximately 20 percent of all the water that the world's rivers pour into the oceans on its own."
Much like the Amazon River, much of the retail business that once flowed through the bricks and mortar retail stores down at the local mall, now go through the internet channels run by Amazon.com. Let's take a closer look at this retailing phenomenon and see if it is a worthwhile investment today.
According to the Yahoo "Profile" on Amazon (AMZN), the company
"...operates as an online retailer in North America and internationally. The company operates various retail Web sites, including amazon.com, amazon.co.uk, amazon.de, amazon.fr, amazon.co.jp, amazon.ca, and amazon.cn. Its product categories include books; movies, music, and games; digital downloads; electronics and computers; home and garden; toys, kids, and baby; grocery; apparel, shoes, and jewelry; health and beauty; sports and outdoors; and tools, auto, and industrial."
As reported on the Amazon Website, AMZN reported 3rd quarter results on October 21, 2010. Net sales for the quarter grew 39% to $7.56 billion from $5.45 billion in the same quarter the prior year. Net income increased 16% to $231 million in the quarter or $.51/diluted share, up from $199 million or $.45/diluted share the prior year.
The company beat expectations of earnings of $.48/share on revenue of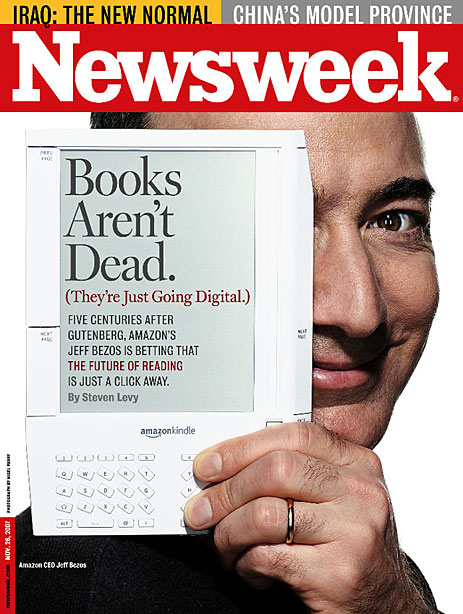 $7.35 billion. However, with operating income of $268 million, below estimates of $289.5 million, resulted in margins of 3.5%. What was thought to be relatively lackluster margins pressured the stock price after this report.
Looking at the longer-term results from Morningstar.com, we can observe the phenomenal record of Amazon (AMZN) in developing its business model. Revenue for the company has increased from $8.49 billion in 2005 to $24.5 billion in 2009 and $30.8 billion in the trailing twelve months (TTM). Diluted earnings per share came in at $.84/share in 2005, dipped to $.45/share in 2006 and then steadily increased to $2.04 in 2009 and $2.47 in the TTM. During this period of explosive growth in revenue, outstanding shares have been relatively stable with 426 million shares in 2005, dipping to 424 million in 2007, and recently increasing to 432 million in 2008, 442 million in 2009 and 454 million in the TTM.
In terms of the balance sheet, Morningstar reports that Amazon has $9.8 billion in total current assets balanced against $7.36 billlion in total current liabilities and total liabilities of $8.56 billion.
Free cash flow came in at $529 million in 2005, dipped to $486 million in 2006 and steadily increased to $2.92 billion in 2009 before dipping slightly to $1.83 billion in the TTM.
In terms of valuation, looking at the Yahoo.com "Key Statistics" on Amazon (AMZN), we find that the market cap is a large cap value of $79.38 billion. The stock has a rich trailing p/e of 71.63 and a forward p/e (fye Dec 31, 2011) of 50.97. The PEG is also rich at 2.61. (My own 'reasonable' value for this statistic remains 1.0-1.5).
Yahoo reports that the company has 448.84 million shares outstanding with a float of 353.14 million. As of 12/31/10 there were 8.93 million shares out short representing 2 days of average volume (well under my own '3 day rule' for significance.) The company does not pay a dividend and the last stock split was a 2:1 split on September 2, 1999.
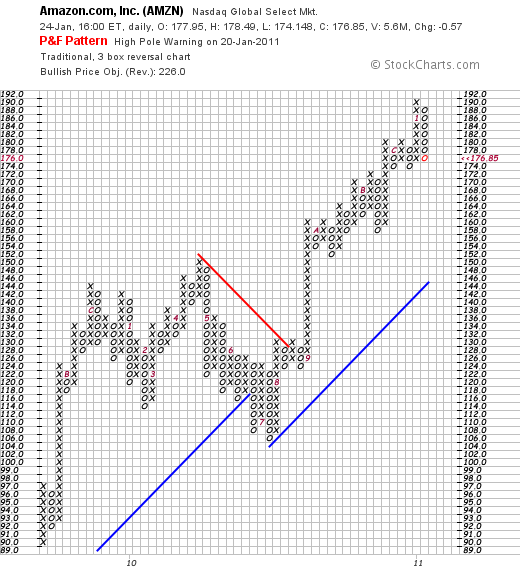
Checking the StockCharts.com 'point & figure' chart on Amazon (AMZN), we can see a solid chart with weakness last year in April, 2010, when the stock sold off from $150 down to $104 by the end of July only to once again to rebound to new heights.
So what is an investor to do about Amazon (AMZN), a stock that sells at a p/e north of 70 and a PEG over 2.5? It is easy to say it is just too expensive and maybe it is wiser to buy a value retail stock like Wal-Mart (WMT) that sells with a p/e of 13.88 and a PEG of 1.29. But there is more to value in making a decision about an investment like this. If we believe that there are few companies that can now compete with Amazon in the same wide and extensive fashion, then we can believe that this company has a 'moat' that may actually justify this premium valuation.
Perhaps it would be wise to wait for a market correction to allow a healthier entry price into this stock. But just as reasonable might be just to hold one's nose and own it because there is no company quite like Amazon and Jeff Bezos and the Amazon folk have created one heck of a company that doesn't appear to be done growing its niche.
Thank you again for stopping by and visiting this blog. If you have any comments or questions, please feel free to leave them right here or email me at bobsadviceforstocks@lycos.com.
Yours in investing,
Bob
Sunday, 26 December 2010
HMS Holdings (HMSY)
Hello Friends! Thanks so much for stopping by and visiting my blog, Stock Picks Bob's Advice! As always, please remember that I am an amateur investor, so please remember to consult with your professional investment advisers prior to making any investment decisions based on information on this website.
Filling out holdings in my Covestor Healthcare Model, I purchased shares of HMS Holdings (HMSY) on December 16, 2010, at a cost of $63.91. As of December 23, 2010, HMSY closed at $65.65, up $.01 or .02% on the day. I would like to share with you some of the facts about this company that led me to decide to purchase shares and add it to my portfolio.
 It is obvious to us all that Health care costs are a large part of our economy and a big cost to businesses and individuals. In fact, this Kaiser Family Foundation report notes that in the United States, expenditures have risen from $714 billion in 1990 to $2.3 trillion in 2008. By 2008, health care spending "...was about $7,681 per resident and accounted for 16.2% of the nation's Gross Domestic Product." HMSHoldings (HMSY) is involved in dealing with these expenditures and thus finds itself in an area of opportunity for its own business.
According to the Yahoo "Profile" on HMS (HMSY), the company
"...provides cost management services for government-sponsored health and human services programs."
On October 29, 2010, HMSY came out with 3rd quarter results. Revenue for the quarter ended September 30, 2010, increased 35.3% to $80.0 million from $59.2 million the prior year. Net income came in at $11.0 million or $.39/diluted share compared with $8.4 million or $.30/diluted share the prior year. The company went ahead and raised guidance for 2010 from $290 million in revenue and $1.38/share in earnings to $300 million and $1.40/share in diluted earnings per share. Furthermore, the company announced 2011 guidance with revenue expected to increase 23.3% to $370 million and earnings now projected to increase 24.3% to $1.74/share.
With this 3rd quarter result, the company beat expectations of analysts who had been expecting revenue of $75.4 million and earnings of $.37/share. Thus with this announcement, the company beat expectations and raised guidance both for this fiscal year and the fiscal year to come (2011). This continues to be very bullish for the company and for the stock price.
Examining the Morningstar.com report for HMSY, we can see that longer-term, the company has steadily increased revenue from $60 million in 2005 to $229 million in 2009 and $282 million in the trailing twelve months (TTM). Fully diluted earnings did take a dip from $.36/share in 2005 to $.22/share in 2006. However, since 2006, they have steadily grown to $1.09/share in 2009 and $1.31 in the TTM. Outstanding shares have modestly increased from 22 million in 2005 to 27 million in 2008 and 28 million in the TTM.
In terms of free cash flow, the company reported $5 million in 2005 and $24 million in 2009 and did dip slightly to $20 million in the TTM. Morningstar reports that HMSY has $140 million in total current assets balanced against $26 million in total current liabilities and a total of $32 million of all liabilities. Thus the company could easily pay off ALL of its liabilities with just its current assets several times over. At least from the Morningstar.com perspective, the balance sheet is impressive and the revenue and earnings results are stellar.
Examining the "Key Statistics" on HMS Holdings (HMSY) from Yahoo, we can see that the company is a small cap stock with a market capitalization of only $1.81 billion. In terms of absolute p/e ratios, the company is very richly valued with a trailing p/e reported by Yahoo at 50.08. The forward p/e (fye Dec 31 2011) is still rich at 37.09. In terms of evaluating the relative p/e in light of the growth expected, the PEG ratio still comes in a bit high at 2.11 (I prefer PEG's between 1.0 and 1.5).
Yahoo reports only 27.56 million shares outstanding with 27.08 million that float. As of 11/30/10, there were 1.78 million shares out short working out to a short ratio of 10.0. This is above my own arbitrary 3 day rule for significance on short ratios and thus may be considered a bullish indicator. No dividends are paid, and the last stock split was a 3:2 split in January, 1996.
Looking at the 'point & figure' chart on HMSY from StockCharts.com, we can see that this company has a beautiful point and figure chart with incredible strength as the stock price has climbed steadily for over two years. If anything, the price is marginally extended above its support levels.
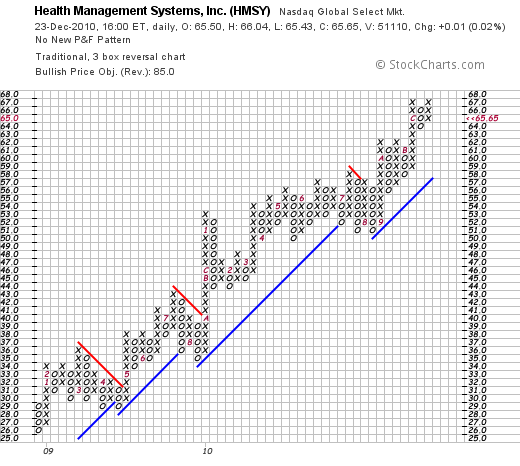
In summary, I recently purchased shares of HMS Holdings (HMSY) based on its recent technical strength, its sustained earnings and revenue growth reports and its recent announcement of earnings and revenue that beat expectations while the company raised guidance for upcoming results. Financially, the company is loaded with cash, is generating significant free cash flow, and has persistently reported incredible results for the past five years. On the downside, the stock is not an unknown in the market and to purchase shares you do need to pay a premium in terms of valuation at least as measured by the p/e and PEG ratios.
It is my belief that stock prices ultimately follow the underlying financial results of the company. Thus, I am willing to pay a premium to be a holder in quality companies capable of producing results like this. Lately, it has been hard to identify them as so many previous consistent players have faltered. HMSY has earned a place in this blog and in my portfolio as well.
Thanks again for stopping by! If you have any comments or questions, please feel free to leave them on the website or email me at bobsadviceforstocks@lycos.com.
Yours in investing,
Bob
Sunday, 19 December 2010
MWI Veterinary Supply, Inc. (MWIV)
Hello Friends! Thanks so much for stopping by and visiting my blog, Stock Picks Bob's Advice! As always, please remember that I am an amateur investor, so please remember to consult with your professional investment advisers prior to making any investment decision based on information on this website.
 As I have discussed previously, I have had the good fortune to be recruited by Covestor to participate in their activities as a 'model' portfolio. In fact a year-and-a-half ago, I set up my "Buy and Hold" model with a mix of investments. This year I set up a new model called "Healthcare" with an emphasis on health-related stocks. If you are interested in Covestor, I would certainly encourage you to visit the site and learn about 'mirroring accounts'. USA Today recently ran an article about social media and investing that you might find interesting.
I mention all of this because in my own search for new names and ideas for my healthcare model I came across MWI Veterinary Supply and purchased shares for my Healthcare Model. Thus, I am a holder of this stock but I would like to share with you some of the things I like and some of my own questions about this investment. I purchased MWIV shares on 12/16/10 at a price of $61.08. MWIV closed at $62.99 on 12/17/10, up $1.70 or 2.77% on the day.
MWIV was recently reviewed by Zacks.com with a positive comment. Motley Fool has also commented on this stock earlier this year. In light of these comments and my own examination of the stock, I decided to pick up shares last week. Let's take a closer look at this company.
According to the Yahoo "Profile" on MWI Veterinary Supply (MWIV), the company
 "...distributes animal health products to veterinarians in the United States. The company primarily offers pharmaceuticals, vaccines, parasiticides, diagnostics, capital equipment, supplies, specialty products, veterinary pet food, and nutritional products. Its pharmaceutical products include anesthetics, analgesics, antibiotics, ophthalmics, and hormones; and vaccine products comprise small animal, equine, and production animal biologicals."
On November 4, 2010, MWIV announced 4th quarter and fiscal year results for the period ended September 30, 2010. Revenues for the quarter came in at $358.9 million, up 45.0% over the prior year period. (The company which has been acquiring other entities broke out the growth as 19.2% organic and 25.8% related to the acquisition of Centaur Services).
Net income for the quarter was $8.8 million, up 34.3% over the same period the prior year. Diluted earnings per share were $.71 compared to $.53 the prior year.
In terms of guidance, the company estimated that in 2011, MWIV will have $1.41 to $1.46 billion in revenue representing a 15-19% growth, and that diluted earnings per share should come in between $3.02 - $3.10/share representing a 12-15% growth rate.
Examining Morningstar.com for longer-term results, we can see that revenues have grown from $606 million in 2006 to $1.2 billion in 2010. Similarly earnings per share have increased steadily from $1.25/share in 2006 to $2.70/share in 2010.
According to Morningstar, free cash flow has improved from a $(11) million level in 2006 to $12 million in 2007 before dipping to $7 million in 2008. Since 2008 free cash flow has improved and has been $12 million in the trailing twelve months (TTM).
Looking at the balance sheet, the company has $376 million in total current assets. Current liabilities stand at $212 million and total liabilities are reported at $221 million as of 9/10. With a current ratio of 1.77, and enough current assets to pay off ALL of the liabilities, the company appears to be in good condition at least based on the information we can glean from Morningstar.
In terms of valuatio, looking at the Yahoo "Key Statistics" on MWIV, we can see that this is a small cap stock with a market capitalization of only $788.41 million. The trailing p/e isn't too bad at 23.35 with a forward p/e (fye Sep 30, 2012) estimated at 18.15. Thus the PEG ratio, which I like to see between 1.0 and 1.5 comes in at 1.21 (5 yr expected). Yahoo reports only 12.45 million shares outstanding with 10.03 million that float. Currently there are 886,400 shares out short yielding a short ratio of 16.60 well over my own arbitrary 3 day rule for significance. (A high short ratio can be a bullish indicator if good news should drive the stock price higher forcing a short 'squeeze').
The company does not pay a dividend and has not split its stock.
Technically, in terms of the price chart, examining the 'point & figure' chart for MWIV from Stockcharts.com, we can see a picture of incredible strength as the stock price marches higher from lower left to upper right. There are few stocks with similar strength.
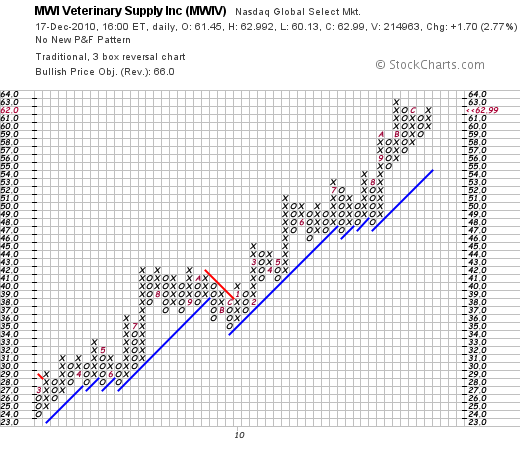
To summarize, MWI Veterinary Supply (MWIV) is a stock that I now own shares in, is involved in the distribution business to veterinarians, has been steadily growing its revenue and earnings for the past five years. In my opinion, it appears to be reasonably priced with a moderate p/e, a PEG under 1.5, and a chart that is quite amazing. It is a small company with lots of room to grow.
This is the kind of stock I like to own and like to write about here on my blog.
Thanks again for stopping by! If you have any comments or questions, please feel free to leave them right here on the blog or email me at bobsadviceforstocks@lycos.com.
Yours in investing,
Bob
Wednesday, 10 November 2010
Baxter International (BAX)
Hello Friends! Thanks so much for stopping by and visiting my blog, Stock Picks Bob's Advice! As always, please remember that I am an amateur investor, so please remember to consult with your professional investment advisers prior to making any investment decisions based on information on this website.
 There are many places that I find ideas. Occasionally we have friends that sometimes seem to be wise and actually deserve more credit than we attribute to them in selecting stocks for investments and in general making wise observations about the world.
My good friend Dennis C. is a neonatal specialist that I know who I run into during the course of my own work. I have learned that when Dennis talks, I reall ought to listen. (with my apologies to E. F. Hutton!) I promised Dennis that I would certainly take a look at Baxter (BAX) and indeed I liked what I saw and wanted to get around to sharing it with all of you here on this blog. I do not currently own any shares of Baxter but family members of mine do own some shares at this time. Baxter (BAX) closed at $51.90 on 11/10/10, up $.23 or .45% on the day.
Years ago I owned shares of Baxter Travenol, the parent company of Baxter. I found a fascinating summary of the history of this company:
 "In 1931, physicians Donald Baxter of Los Angeles and Ralph Falk of Boise, Idaho, started the Don Baxter Intravenous Products Corp., which made supplies for IV systems in hospitals. In 1933, Baxter started a manufacturing plant in Glenview. A pioneer in blood preservation methods as well as IV supplies, Baxter grew steadily. In 1947, it moved its headquarters to Morton Grove; the company soon employed over 500 people in the Chicago area. Annual sales grew from about $10 million in the mid-1950s to more than $100 million by 1967, when the company was making dialysis equipment, heart-lung machines, and many other equipment items for hospitals. In 1975, when it employed about 2,200 in the Chicago area, the company moved its headquarters to suburban Glenview; the following year, its name changed to Baxter Travenol Laboratories. The company grew rapidly thereafter. In 1985, when annual sales stood at about $2 billion, Baxter bought the American Hospital Supply Corp., an even larger Chicago-area medical supply company. The new company, which in 1988 became Baxter International Inc., was an enormous entity that soon approached $10 billion in annual sales; about 10,000 of its 50,000 employees worldwide were in the Chicago area. During the 1990s, however, Baxter sold off several divisions, including many of the old American Hospital Supply Corp. operations"
But what about Baxter International (BAX) today?
The company still makes intravenous equipment but now has become a major plasma product company as well as dialysis product supplier. According to the Yahoo "Profile" on BAX, the company
"...through its subsidiaries, develops, manufactures, and markets products for people with hemophilia, immune disorders, infectious diseases, kidney disease, trauma, and other chronic and acute medical conditions. It operates in three segments: BioScience, Medication Delivery, and Renal."
On October 21, 2010, Baxter (BAX) reported 3rd quarter results. In the third quarter the company had net earnings of $594 million or $1.01/share, up from $532 million or $.87/share in the same quarter the prior year. Analysts had been expecting $.97/share according to Thomson Reuters, thus the company exceeded expectations on earnings during the quarter.
Sales for the quarter rose 3% to $3.2 billion. The company also went ahead and raised guidance with sales growth in 2010 at 2-3% from prior guidance of 1-3%, and earnings of $3.96 to $3.98/share ahead of the prior quarter's guidance for 2010 of $3.93 to $3.98/share.
Shortly after this earnings report, The Motley Fool released a nice review of Baxter asking the quaestion, "Is Baxter International the Perfect Stock?". They didn't actually think that Baxter was perfect, but "it's a decent play for conservative investors" according to The Fool.
Just yesterday (November 9, 2010), Baxter announced that it would be raising its quarterly dividend from $.29/share to $.31/share.
Longer-term, looking at the Morningstar "5-Yr Financials", we can see that revenue has increased steadily from $9.8 billion in 2005 to $12.8 billion in the trailing twelve months (TTM). Earnings, however, while increasing from $1.52/share in 2005 peaked at $3.59/share in 2009, but dipped to $2.61/share in the TTM. Average shares increased from 629 million in 2005 to 656 million in 2006 but since then has decreased with share buy-backs from that level to 654 million in 2007 and to 601 million in the TTM.
The company according to Morningstar has total current assets of $8.27 billion and total current liabilities of $4.46 billion, yielding a current ratio of 1.85. I appreciate seeing this ratio above 1.5 in terms of expressing the company's ability to pay off liabilities in the immediate future.
Free cash flow as reported by Morningstar, has increased steadily from $1.1 billion in 2005 to $2.9 billion in 2009 and $3.05 billion in the TTM.
In terms of valuation, we can review the "Key Statistics" on BAX from Yahoo where we find that this is a large cap stock with a market capitalization of $30.33 Billion. The trailing p/e is reported at 19.02 with a forward p/e (fye Dec 31, 2011) of 12.24. The PEG Ratio (5 yr expected) works out to an acceptable 1.40.
Yahoo reports 584.37 million shares outstanding with 583.23 million of those shares that float. Currently, as of 10/15/10, there were 8.11 million shares out short representing a short interest ratio of 1.9 trading days, well under my own 3 day level of significance. The company pays a forward annual dividend rate of $1.24 with a forward yield of 2.39%. The company has a payout ratio of 44% suggesting adequate room to pay and increase its dividend in the future. The last stock split was a 2:1 stock split back in May, 2001.
If we review the 'point & figure' chart on Baxter International (BAX) we see that the stock has actually been trading sideways for the past 3 years in the $40 to $67 range. The company recently broke through support and is moving up towards a resistance level of $55. Technically, from my amateur perspective, I would like to see this stock break through this resistance level and create a new support line to confirm its move to the upside. Certainly the stock chart does not appear over-extended.
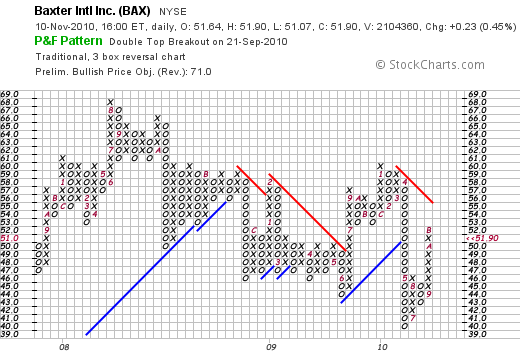
To summarize, Baxter International (BAX) has reported strong earnings that beat expectations and the company recently raised guidance as well as announced an increased dividend payment. Valuation appears reasonable and the company has been buying back shares while producing increasing free cash flow and growing revenue. Earnings the past five years have not been as consistent but appear to be back on track.
With our aging population dealing with an ever-increasing number of diabetic patients we may well need to prepare for a growing kidney disease problem which can result in dialysis. Combined with increasing access to medical care with likely continuing healthcare reform worldwide may mean more business for Baxter with basic medical products like I.V. devices to more complex products such as plasma products and dialysis supplies.
The stock appears to be very reasonably valued and if anything we are early in the price appreciation of this company which has moved little since late 2007.
If you have any comments or questions, please feel free to leave your comments or questions right here or email me at bobsadviceforstocks@lycos.com.
Yours in investing,
Bob
Thursday, 14 October 2010
International Business Machines (IBM)
 Hello Friends! Thanks so much for stopping by and visiting my blog, Stock Picks Bob's Advice! As always, please remember that I am an amateur investor so please remember to consult with your professional investment advisers prior to making any investment decisions based on information on this website.
As I look through the many lists of stocks making the news, it occurred to me that I hadn't looked recently at "Big Blue", International Business Machines (IBM). As I write (10/14/10), IBM is trading at $141.30, up $.88 or .63% on the day. I do not own any shares of IBM.
International Business Machines (IBM) is a company that I have personally been familiar with for many years. Back in 1971 as a high school student I took my first programming classes working with Fortran IV. After high school, my first sumer job was with Petersen Publishing Company in L.A. working as a keypuncher on a keypunching machine typing out endless articles for magazines like Guns & Ammo and Wheels Afield. But that was a long time ago :).
Frankly, as soon as the Macintosh from Apple (AAPL) arrived, I was sold on the quirky alternative from Cupertino. Unfortunately I never bought any of those shares either! Even today, Apple (AAPL) is one of the most 'popular' of investments and its performance has been stellar. But IBM has been a quiet giant of a company and deserves more attention even today.
Let me stop reminiscing for a bit and spend a little time sharing with you my thoughts on IBM.
According to the Yahoo "Profile" on International Business Machines (IBM), the company
"..develops and manufactures information technology (IT) products and services worldwide."
IBM has reinvented itself many times moving further from the 'big box  computers' I remember and more into the integration of hardware and software and servicing of these products. This article describes some of the recent developments in this business transformation.
But let's talk about basic stuff like earnings and revenue performance for this major company. IBM is scheduled to release 3rd quarter 2010 results on October 18, 2010. As this article relates, IBM has had a very strong month climbing to an all-time high:
"The shares' moves in recent weeks have had some outside help, in particular positive quarterly results from an IBM competitor, the Accenture PLC consulting firm, and strong commentary about the corporate server buying from Intel Corp., the world's biggest maker of microprocessors."
Current expectations are for net income of $2.75/share on revenue of $24.12 billion per Thomson Reuters analysts. This would " mark the 31st straight quarter in which IBM has posted higher earnings than the year before." Pretty amazing stuff but also driven by cost-cutting and stock repurchases as the article points out.
On July 19, 2010, IBM reported their 2nd quarter 2010 results. Net income for the 2nd quarter came in at $2.61/share ahead of expectations of $2.58/share. Revenue, however, came in a bit light at $23.7 billion behind analysts' view of $24.17 billion for the quarter. Net income for the quarter was $3.4 billion up 9% from the prior year. Even though the company missed revenue expectations that quarter they did raise guidance for 2010 to $11.25/share (but analysts had expected even higher guidance). With expectations doused the stock experienced a short-term price pull back on that news announcement making the current quarter expectations even more significant.
Reviewing the Morningstar.com "Financials" on International Business Machines (IBM), we can see that revenue came in at $91.1 billion in 2005, peaked at $103.6 billion in 2008, before retreating to $95.8 billion in 2009. Even with this dip in revenue, net income has steadily increased from $7.9 billion in 2005 to $13.4 billion in 2009. On a per share basis this was an increase from $4.87/share in 2005 to $10.01/share in 2009. Due to share buy-backs, outstanding shares dipped from 1.6 billion in 2005 to 1.34 billion in 2009.
Free cash flow as reported on Morningstar, dipped from $11.1 billion in 2005 to $9.8 billion in 2006 only to turn around and steadily increase to $17.3 billion in 2010
In terms of valuation, looking at the Yahoo "Key Statistics" on IBM, we see that this is a very large cap stock with a market capitalization of $177 billion. (Mega Cap Stocks have been defined as market capitalization in excess of $200 billion). Yahoo reports them with a trailing p/e of 13.32 and a forward (fye Dec 31 2011) p/e of 11.39. Valuation appears reasonable with a PEG (5 yr expected) of 1.06.
Yahoo reports 1.26 billion shares outstanding with a similar float. As of September 15, 2010, there were 15.84 million shares out short with a short ratio of 3.20 slightly ahead of my own arbitrary 3 day rule for significance. The company pays an annual 'forward' dividend of $2.60 with a forward yield of 1.90%. The payout ratio of 22% suggests that this is well-covered with room for increases. The last stock split was a 2:1 split back in May, 1999.
Quite frankly what drew me to looking at IBM in the first place was the incredible price chart that quietly was moving steadily higher. If we review the 'point & figure' chart on IBM from StockCharts.com, we can see the phenomenal price move from $73 in December, 2008, to its current price at $140 in October, 2010. Almost without even a blink, this stock has charged strongly and quietly higher.
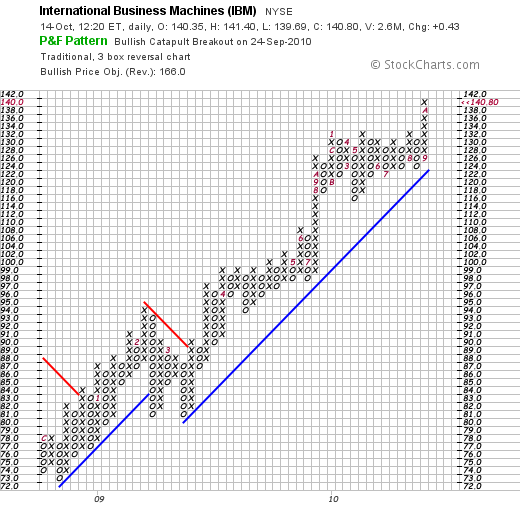
Clearly much has changed at 'big blue' since Louis Gerstner arrived in 1993 from RJF Nabisco to take IBM from financial challenges and help transform this company into the high tech powerhouse that it is today. So while I have been an Apple (AAPL) fan for many years and do not begrudge Apple anything for its phenomenal success, IBM is worth another look. Let's see what the earnings report next week shall bring, but this company appears to be executing in a rather impressive fashion!
Thanks again for stopping by and visiting my blog. I apologize for my paucity of posts but shall continue to blog here as much as time and opportunity allows. If you have any comments or questions, please feel to leave them right here on the blog or email me at bobsadviceforstocks@lycos.com.
Yours in investing,
Bob
Saturday, 28 August 2010
Colgate-Palmolive (CL)
Hello Friends! Thanks so much for stopping by and visiting my blog, Stock Picks Bob's Advice! As always, please remember that I am an amateur investor, so please remember to consult with your professional investment advisers prior to making any investment decisions based on information on this website.
 I wrote in the previous entry how my shares of McDonald's (MCD) had appreciated 30% since my purchase triggering a partial sale and a 'trading signal' to add a new holding to my own portfolio. I did this and purchased shares of Colgate-Palmolive (CL). Just catching up with this purchase, I wanted to share with you a few thoughts about this company.
Probably like you I am uncertain about the health of our economy over the intermediate term. I tend to agree with Paul Krugman that the economic stimulus advanced by the Obama administration wasn't big enough. I am also concerned about our level of debt and the size of government but my own basic Economics education has convinced me that Keynes was right 'enough' that austerity right now is absolutely the wrong time to be cutting back.
I think the bail-out of GM, the TARP funds, the financial re-regulation is all medicine indicated for the illness this patient is facing. It disappoints me that in this difficult time of high unemployment, increasing disparity of wealth, and global financial stress that our Republicans in office do not give the newly elected President a chance and instead obstruct at every turn.
OK enough politics. Many of you who are my friends probably know that I love politics almost as much as I enjoy investing!
Let's talk Colgate (CL).
According to the Yahoo "Profile" on Colgate-Palmolive (CL), this company
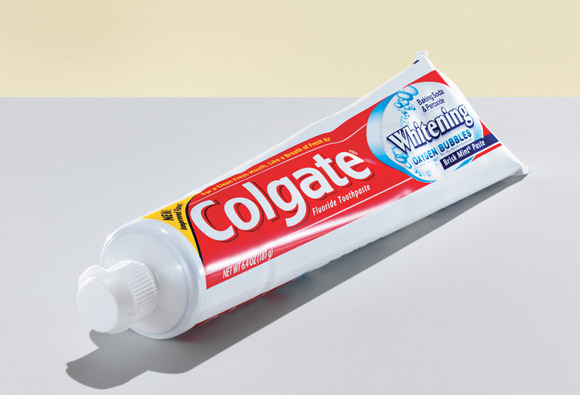 "....together with its subsidiaries, manufactures and markets consumer products worldwide. It offers oral care products including toothpaste, toothbrushes, and mouth rinses, as well as dental floss and pharmaceutical products for dentists and other oral health professionals; personal care products, such as liquid hand soap, shower gels, bar soaps, deodorants, antiperspirants, shampoos, and conditioners; and home care products comprising laundry detergents, dishwashing liquids and detergents, household cleaners, and oil soaps, as well as fabric conditioners."
While I purchased shares of Colgate (CL) as a 'comfort stock' their quarterly report on July 29, 2010, was less than stellar. Colgate reported earning $603 million or $1.17/share in the quarter ended in June, 2010. Those results are up from $562 million in earnings or $1.07/share in the prior year same period. The company beat expectations on earnings as analysts had been expecting $1.16/share but revenue came in light as analysts had been expecting $3.94 billion in revenue. Some of the problems came in from Venezuela where currency devaluation affected results.
Morningstar.com allows us a longer-term perspective on Colgate-Palmolive. We can see that revenue has grown steadily from $11.4 billion in 2005 to $15.330 billion in 2008 with a slight dip to $15.327 billion in 2009. Net income has grown uninterruptedly from $1.35 billion in 2005 to $2.29 billion in 2009. Diluted earnings have also increased without interruption from $2.43/share in 2005 to $4.37/share in 2009.
Free cash flow for CL has increased from $1.39 billion in 2005 to $2.70 billion in 2009. Most recent balance sheet numbes show $3.8 billion in total current assets compared to $3.60 billion in total current liabilities. The company also has $4.42 billion in long-term liabilities reported.
Looking at Yahoo "Key Statistics" on Colgate-Palmolive (CL), we can see that this is a large cap stock with a market capitalization of $36.09 billion. The stock has a trailing p/e of 17.71 with a forward p/e (fye Dec 31, 2011) estimated at 14.22. The PEG ratio is a bit rich at 1.69.
Yahoo reports 486 million shares outstanding with 483.37 million that float. As of August 13, 2010, there were 5 million shares out short representing a short ratio of only 1.40. The forward annual dividend is $2.12 working out to a 2.8% yield. The dividend is well covered with a 44% payout ratio. The last stock split was July 1, 1999, when the stock was split 2:1.
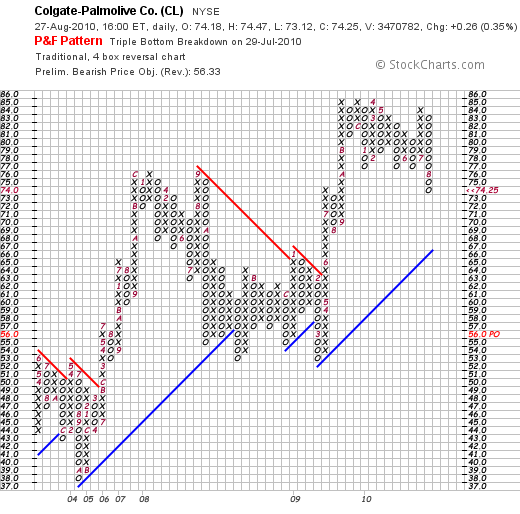
In terms of the technical performance of this stock, if we examine the 'point & figure' chart on Colgate-Palmolive (CL) from StockCharts.com, we can see that looking a little longer-term, CL has traded from a low of $37 back in October, 2004, to a high of $85 in August, 2009. Currently correcting from another pass at the $85 level in July, 2010, the stock has pulled back rather sharply to its current price of $74.25. While short-term a bit weak, longer-term, the trend appears higher.
In summary, I am aware of the difficult times we find ourselves living in, investing in, and even dealing with the politics of the 'cure'. Long-term, I am every bit as bullish on America as Kudlow. But right now, I need a comfort stock. A stock I have grown up with that I use to brush my teeth, clean my dishes, and even shampoo my hair. Colgate is a long-term winner as the rest of the world advances and starts increasingly demand consumer products that Colgate is prepared to deliver.
Long-term, Colgate "has paid uninterrupted dividends on its common stock since 1895 and increased payments to common shareholders every year for 47 years." A very blue blue-chip stock indeed!
Thanks so much for stopping by and visiting my blog! If you have any comments or questions, please feel free to leave them right here or email me at bobsadviceforstocks@lycos.com.
Yours in investing,
Bob
Thursday, 19 August 2010
Colgate Palmolive (CL) "Trading Transparency"
Hello Friends! Thanks so much for stopping by and visiting my blog, Stock Picks Bob's Advice! As always, please remember that I am an amateur investor, so please remember to consult with your professional investment advisers prior to making any investment decisions based on information on this website
 As part of my strategy of managing my portfolio, I have chosen to sell a small portion of my own holdings as they appreciate to targeted price levels. After an initial purchase, I sell 1/7th of my holding, if it appreciates to a 30% gain from my purchase price. After a sale of a portion of a holding at a gain, I use this action as a 'signal' to indicate to me that the health of the market is reasonable for a new purchase of stock.
On August 18, 2010, my McDonald's (MCD) shares reached $73.51 and I sold 1/7th of my holding, 7 shares, at $73.51. These shares had been acquired September 23, 2009, at a cost basis of $56.39/share. Thus I had a gain of $17.12 or 30.4% since purchase. I still own 45 shars of MCD in my own portfolio after this sale.
Being under my maximum of 20 holdings, and with this 'permission slip' in hand, I went ahead and44 shares of Colgate Palmolive (CL) at $76.97/share. The size of this purchase was dictated by my own  calculation of 125% of the average size of the remaining holdings.
CL has long been a favorite of mine, and along with its dividend and the incredible stability of its product mix, I chose to add it into my portfolio. I shall write up a little more about Colgate Palmolive (CL) and why I chose to add it to my portfolio in the near future.
Yours in investing,
Bob
Sunday, 15 August 2010
Medtronic (MDT) "Revisiting a Stock Pick"
Hello Friends! Thanks so much for stopping by and visiting my blog, Stock Picks Bob's Advice! As always, please remember that I am an amateur investor, so please remember to consult with your professional investment advisers prior to making any investment decisions based on information on this website.
In the difficult market that we find ourselves, I also find it difficult to highlight new stocks that I find appropriate to include in this blog and possibly in my own portfolio. Picking up an old copy of "100 Best Stocks to own in America" by Gene Walden (7th edition), (which you can pick up here on Amazon), I opened up the page on Medtronic (MDT) and thought it might be worthwhile to revisit this stock. (Even though Walden's classic is nearly 10 years old, I still find inspiration in his philosophy and discipline.)
I last wrote up Medtronic (MDT) on Stock Picks on November 29, 2009. At this time, I do not own any shares of this stock. Medtronic (MDT) closed at $35.57 on August 13, 2010, down $(.42) on the day.
 According to the Yahoo "Profile" on Medtronic (MDT), the company
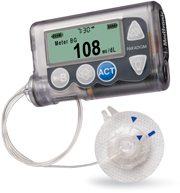
"...manufactures, and sells device-based medical therapies worldwide. Its Cardiac Rhythm Disease Management segment offers cardiac pacemakers, implantable defibrillators, cardiac resynchronization therapy devices, atrial fibrillation products, leads, ablation products, electrophysiology catheters, information systems, diagnostics and monitoring products, and patient management tools. The company’s Spinal segment offers thoracolumbar, cervical, and interbody spinal devices; bone growth substitutes; and devices for vertebral compression fractures and spinal stenosis. Its CardioVascular segment offers coronary and peripheral stents and related delivery systems, endovascular stent graft systems, distal embolic protection systems, perfusion systems, positioning and stabilization systems, products for the repair and replacement of heart valves, and surgical ablation products, as well as balloon angioplasty catheters, guide catheters, guidewires, diagnostic catheters, and accessories. The company’s Neuromodulation segment offers neurostimulators, implantable drug delivery systems, deep brain stimulation systems, and urology and gastroenterology devices. Its Diabetes segment offers external insulin pumps, continuous glucose monitors, carelink therapy management software, and blood glucose meters. The company’s Surgical Technologies segment offers tissue-removal systems, surgical drill systems, fluid-control products, cranial fixation devices, nerve monitoring systems, image-guided surgery systems, intra-operative imaging systems, a Ménière’s disease therapy device, and a portfolio of products to treat benign snoring and obstructive sleep apnea."
To summarize, they are involved in medical devices that treat heart rhythm, treatment, spinal, CNS, diabetic, and surgical and sleep apnea problems.
Medtronic has announced that it will be reporting on 1st quarter 2011 results on August 24, 2010. They recently announced their completed acquisition of ATS Medical for $370 million expanding their cardiac surgical and diagnostic line of products. Since the 4th quarter report, Medtronic announced a dividend increase of 9% from $.205/share to $.225/share.
 On May 25, 2010, Medtronic (MDT) reported 4th quarter 2010 results with revenue growth of 10% from $3.8 billion in the year earlier perior to $4.2 billion this quarter. Analysts had expected $4.19 billion in revenue. Net income rose to $954 million or $.86/share in quarter ended April 30, 2010, up from $103 million or $.09/share the prior year. Adjusted earnings came in at $.89/share, a penny ahead of estimates.
Longer-term, checking the Morningstar Financials on MDT, we can see that revenue has increased from $11.3 billion in 2006 to $15.8 billion in 2010. Net income has increased from $2.5 billion in 2006 to $3.1 billion in 2010 after a dip in both 2008 and 2009, results rebounded in 2010.
Earnings per share similarly climbed from $2.09/share in 2006 to $2.41/share in 2007, before dipping to $1.95 in 2008 and $1.93 in 2009. Earnings rebounded to $2.79/share in 2010. Outstanding shares have gradually dipped from 1.2 billion in 2006 to 1.1 billion in 2010.
Free cash flow has been strong with $963 million reported in 2006 increasing steadily to $3.56 billion in 2010.
Medtronic's balance sheet appears solid with latest Morningstar results showing $9.8 billion in current assets in 2010 with total current liabilities reported at $5.12 billion. Non-current liabilities are recorded at $8.3 billion.
Checking the Yahoo "Key Statistics" on Medtronic (MDT), we can see that this stock is a large cap stock with a market capitalization of $38.52 billion. The company has a very modest p/e of 12.74 with a forward p/e (fye Apr 30, 2012) of 9.34 with a resultant PEG (5 Yr Expected) of 1.05.
The company has 1.08 billion shares outstanding. As of July 30, 2010, there were 11.46 million shares out short representing a short ratio of only 1.90. The company currently pays a forward dividend of $.90/share with a forward yield of 2.5%. The payout ratio is only 29% suggesting ample room for dividend payment and growth.
If we examine the "point & figure" chart on Medtronic from StockCharts.com, we can see that the share price broke down from a high of $54 in August, 2008, to a low of $24 in February, 2009, before moving higher through resistance at $41. After a recent peak at $47 in January, 2010, the stock has sold off testing its recent support levels at $35. Overall, the stock appears to be nominally in an uptrend and certainly not over-extended.
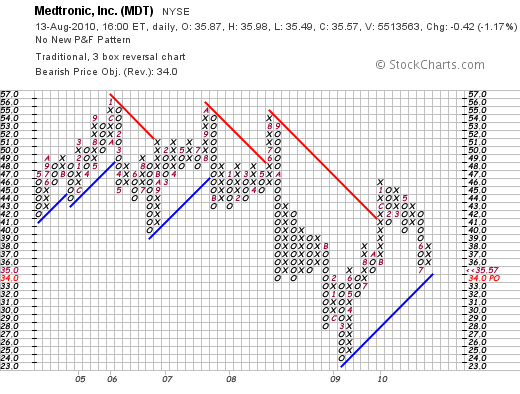
In conclusion, Medtronic (MDT) is an old favorite of mine that represents excellent value with a p/e just over 12, a PEG just over 1.0 and a dividend yield of 2.5%. The company reported 2010 results that reversed a two-year slide in earnings and revenue growth. However, they are set to report earnings once again in next ten days.
As we look for 'safe' places to park our investment money, Medtronic may well represent the value and long-term prospects that make this a timely investment.
Thank you again for stopping by and visiting my blog! If you have any comments or questions, please feel free to leave them right here or email me at bobsadviceforstocks@lycos.com.
Yours in investing,
Bob
Wednesday, 11 August 2010
Thanks to Fred Wilson!
Hello Friends! Instead of listing the usual disclaimer, I would like to publicly thank Fred Wilson for his kind comments on AVC "musings of a VC in NYC".
 Fred is a Venture Capitalist who has invested in and organized investments in a multitude of new organizations including Twitter, Covestor, and foursquare, three of the internet enterprises that occupy a great deal of my own time! Through Union Square Ventures, he has been a powerful influence on social media and social investing websites. Thank you for all you do Fred!
Fred was kind enough to discuss my own activity with Covestor. (Here is the link to my Covestor page.) Covestor has allowed me to monitor and evaluate my own trading activity and performance and to allow me to share this information with all of you my readers. In addition, if you are so inclined, Covestor allows individuals to shadow fellow investors with portfolios that seek to duplicate the activity of model managers. Visit Covestor to find out more.
We live in very difficult investing times and indeed difficult times even for Venture Capitalists. I shall continue to work to share with you my ideas and rationales for each of the decisions I make as I try to learn along with all of you how to deal with financial markets that can climb 2% one day only to dip 3% the next. Steadiness and consistency are key as well as continued evaluation of the information, assumption, and actual performance that results from any given strategy.
Thank you all for visiting and participating with me on this journey.
If you have any comments or questions, please feel free to leave them right here on the blog or email me at bobsadviceforstocks@lycos.com.
Yours in investing,
Bob
Newer | Latest | Older
 There are few companies with a record of growth in both revenue, earning, and stock price to match Cisco (CSCO). From the Cisco website I have included a chart of the revenue growth for this company that is just a year or two over 25. The history of this company is just as intriguing as the usual garage start-up story that is the story of Apple (AAPL) and other silicon valley companies.
10, 2010. Revenue for the quarter came in at $10.75 billion, up 19% above the forecast of $10.74 billion. Earnings came in at $.42/share (after unusual items), beating expectations of $.40/share the analysts expected. All in all it wasn't a bad report except that there was some uncertainty about the economy and that new orders were below company expectations. The stock didn't bounce on the news of the earnings exceeding expectations, but dipped again on the guarded outlook.


 Like so many of you, I have gradually become a confirmed fan of the Amazon
  $7.35 billion. However, with
 It is obvious to us all that Health care costs are a large part of our economy and a big cost to businesses and individuals. In fact, this Kaiser Family Foundation
 As I have discussed previously, I have had the good fortune to be recruited by


 Hello Friends! Thanks so much for stopping by and visiting my blog,

 I wrote in the previous entry how my shares of McDonald's (MCD) had appreciated 30% since my purchase triggering a partial sale and a 'trading signal' to add a new holding to my own portfolio. I did this and purchased shares of Colgate-Palmolive (CL). Just catching up with this purchase, I wanted to share with you a few thoughts about this company.

 As part of my strategy of managing my portfolio, I have chosen to sell a small portion of my own holdings as they appreciate to targeted price levels. After an initial purchase, I sell 1/7th of my holding, if it appreciates to a 30% gain from my purchase price. After a sale of a portion of a holding at a gain, I use this action as a 'signal' to indicate to me that the health of the market is reasonable for a new purchase of stock.
 According to the
  On May 25, 2010, Medtronic (MDT) reported
 Fred is a Venture Capitalist who has invested in and organized investments in a multitude of new organizations including