


Hello Friends! Thanks so much for stopping by and visiting my blog, Stock Picks Bob's Advice! Needless to say, I am an amateur investor, I am not a financial analyst but I love to look and talk about stocks. Thus, it is of utmost importance that you refer to your professional investment advisors prior to making any investment decisions based on information on this website. Only a professional can assist you in these decisions, making sure the investments are appropriate, timely, and likely to be profitable for you!
 I had a little time today and wanted to see if I could find something interesting for all of the readers here. As you probably know, if you read my entries (and I hope you read the others as well!), I like to start my "search" by looking at the top % gainers on the NASDAQ. Today I came across Multi-Color Corporation (LABL) which, as I write, is trading at $23.60, up $2.25 or 10.54% on the day. I do not own any shares or options on this stock, nor do any members of my family.
 According to the Yahoo "Profile" on LABL, this company "...is a supplier of decorative label solutions and packaging services to consumer product and food and beverage companies, national retailers and container manufacturers worldwide."
What drove the stock higher today, as is so common with stocks on this blog, was the announcement of 4th quarter 2005 results this morning. For the quarter ended March 31, 2005, revenue increased 36% to $45.3 million from $33.3 million the prior year. Much of that increase was from an acquisition. Net income rose 80% to $2.9 million or $.43/diluted share, up from $1.6 million or $.24/diluted share the prior year. The "street" liked these numbers and has bid up the price of this stock today!
 How about "longer-term"? Looking at the Morningstar.com "5-Yr Restated" financials, we can see a beautiful ramp-up of revenue from $53.3 million in 2000 to $127.0 million in the trailing twelve months (TTM).
Earnings, however, have been a bit more erratic, dipping from $.89 in 2000 to $.76 in 2002, but increasing since then to $1.01 in the TTM.
Free cash flow has also been a bit erratic, but has stayed positive the last few years with $8 million reported in the TTM.
The balance sheet looks just fine to me with $6.8 million in cash and $24.0 million in other current assets balanced against $15.2 million in current liabilities and $23.0 million in long-term liabilities.
What about some "valuation" questions on this stock?
 Taking a look at Yahoo "Key Statistics" on LABL, we can see that this is a very small company with a market capitalization of $156.35 million. The trailing p/e isn't bad at 24.26, and apparently no estimates are available to calculate a PEG.
 The Price/Sales ratio is rather cheap (imho) at 1.06. However, all of the stocks in the "Packaging and Containers" industry group (according to Fidelity information), are rather cheap including Sealed Air (SEE) at 1.1, Tupperware (TUP) at 1.1, Bemis (BMS) at 1.0, Pactive (PTV) at 0.9, and Ball (BLL) at 0.8. Thus, I would just say that it appears that LABL is reasonably priced, and certainly not the "cheapest" in its industry.
Other facts on Yahoo include the # of shares outstanding at only 6.34 million, with 5.70 million that float. There were NO short shares reported as of 4/8/05. In addition, the company DOES pay a small dividend of $.20/share yielding .95%. The last stock split was a 3:2 split in December, 2003.
What about "technicals"? What does the chart look like? Taking a look at a Multi-Color "point & figure" chart from Stockcharts.com, we can see what looks to me as a very strong chart.
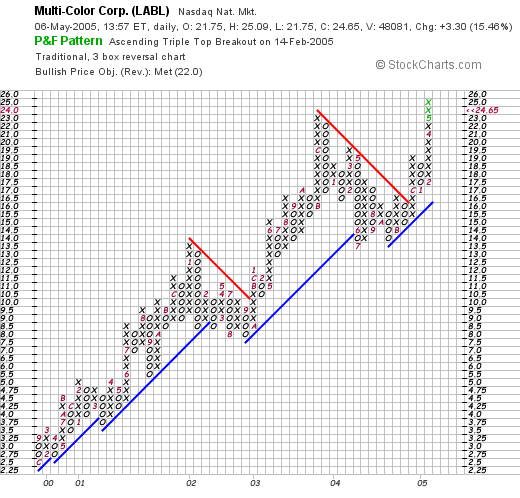
 Since late 1999 (!), when the stock was trading as low as $2.50/share, the stock has steadily moved higher, only occasionally consolidating, but following its support line rather well. As you know, I am not a professional technician, but the pattern looks pretty straightforward with a gradual price appreciation of the stock!
So what do I think? Well, I am not in the market to buy anything, but except that this is a very small company that would thus be fairly thinly traded, everything else looks just fine. The latest quarterly report is solid, the company is growing its earnings, spinning off positive free cash flow, the balance sheet is nice, valuation isn't bad at all (imho), and the chart looks nice!
Thanks again for stopping by and visiting! If you have any questions or comments, please feel free to leave them right here on the blog or email me at bobsadviceforstocks@lycos.com.
Bob