Hello Friends! Thanks so much for stopping by and visiting my blog, Stock Picks Bob's Advice. As always please remember that I am an amateur investor so PLEASE consult with your professional investment advisors prior to making any decisions based on information on this website. I cannot be responsible for any of your trading decisions!
What I try hard to do around here is to look around at stocks which are doing well on that particular day, and of those, decide which stocks might have characteristics to suggest that they will continue to do well. And as for that, I mean continue to perform in a business sense, and secondarily, to hopefully appreciate in price! I combine this with a bit of rudimentary portfolio management in my own holdings, selling losers quickly, and selling winners slowly at set price targets. Nothing on this blog is about "getting rich quick". As I have commented elsewhere, if this were a baseball game, my approach is to get base hits one after another.
 Looking through the list of top % gainers on the NYSE today, I came across Pall Corporation, which, as I write, is trading at $28.58, up $2.18 or 8.26% on the day. I do not own any shares of Pall currently, but have owned them in the past. In fact, I came across Pall reading one of my favorite books by Gene Walden, 100 Best Stocks to Own in America. I really owe a lot to Mr. Walden, who presents a common-sense approach to investing, an approach that I subscribe to for the most part...finding companies with consistent earnings and revenue growth may result in great stock picks!
 According to the Yahoo "Profile" on Pall, PLL "...is a supplier of fine filters, principally made by the Company using its own filter media, and other fluid clarification and separations equipment for the removal of solid, liquid and gaseous contaminants from a variet of liquids and gases."
One of the first places I go in my analysis, is to review the latest quarterly results of any prospective company. (This stuff is not genius material imho...just sort of common sense!).
On March 1, 2005, PLL reported 2nd quarter 2005 results. Sales for the quarter jumped 9.5% to $469.5 million, from $428.1 million last year. Earnings came in at $32 million or $.26/share, up from $24.9 million, or $.20/share last year. These were nice results imho.
How about "longer-term results"? For this I like to review the "5-Yr Restated" financials from Morningstar.com. First thing is revenue growth, and here we can look for, and for Pall find, a nice ramp-up of purple bars indicating a steady growth in revenue from $1.2 billion in 2000 to $1.9 billion in the trailing twelve months (TTM).
My next step is earnings growth evaluation. This often does not follow revenue exactly, and unless lately, the earnings are also growing, I will not continue looking at a stock. In PLL's case, we can see that earnings actually dropped from 2000 when they earned $1.18/share down to $.59/share in 2002. However, since then earnings have been growing and came in at $1.24/share in the TTM.
Next step is free cash flow. Pall has fairly solid free cash flow performance with $86 million in free cash flow in 2002, increasing to $120 million in the TTM.
And balance sheet? Here we look at current assets, consisting of "cash" and "other current assets" as compared to "current liabilities". I prefer to see the sum of current assets outweighing at least the current liabilities and if possible, the long-term liabilities as well!
 For Pall, according to the Morningstar information, cash stands at $227.1 million and "other current assets" are at $886.3 million. Thus, there is a total of about $1.1 billion in current assets. This is balanced against $400 million in current liabilities and $691.8 million in long-term liabilities. Pall could pay off both the current and the long-term liabilities with just the current assets. Thus, the balance sheet looks solid to me on my perspective.
What about some "valuation" parameters? For this information, I have been using Yahoo Finance again, in particular the Yahoo "Key Statistics" for Pall. Here we can see that this is a large cap stock with a market capitalization of $3.52 Billion. The trailing p/e is modest (imho) at 22.90, and the forward p/e (fye 31-Jul-06) is even nicer at 17.58. The PEG (5 yr expected) is reasonable, if not cheap, at 1.54.
The Price/Sales ratio is 1.77. Lately, I have been looking at other companies in the same "industry group" to see what kind of valuation this represents.
According to my my Fidelity source, PLL is a part of the "Diversified Machinery" industry group. The Price/Sales of Pall at 1.8 is midway between a low for Eaton (ETN) at 0.9, Ingersoll-Rand (IR) at 1.3, Illinois Tool Works (ITW) at 2.0, and Roper (ROP) at 3. Thus valuation per this parameter is "fair". Not cheap, not expensive, sort of Goldilocks "just right!"
Other numbers from Yahoo show 124.45 million shares outstanding with 121.60 million that float. Currently there are 2.97 million shares out short (as of 4/8/05) representing 2.44% of the float, or 6.105 trading days of volume. Thus, in my own 3 day rule, this is a significant short interest, and any upward movement of the stock price, might induce other short sellers to scramble trying to cover their "presold" shares.
The company does pay a small dividend of $.40/share yielding 1.52%. The last stock split was a 4:3 split, according to Yahoo, way back in December, 1992.
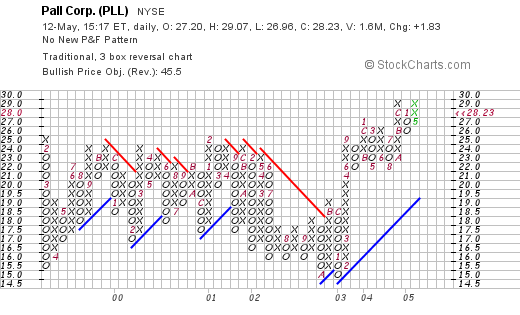
How about "technicals"? How does the chart look like? I have been using "point & figure" charts from Stockcharts.com for this purpose. This chart actually is interesting to me. The company really went nowhere between 1999 and 2003 when it traded in a range between $15.50 and $25/share.

It was only in september, 2003, when it failed to return to the mean and then in what appears to be about October, 2004, when it broke through the $26 level and headed higher. The stock chart actually looks quite nice and does not appear over-valued. (always imho).
So what do I think? Well, you know I wouldn't list the stock on this blog unless I liked it :). The latest quarterly report was solid, the Morningstar sheet looks good with growing revenue, earnings, free cash flow, and a solid balance sheet. The valuation looks nice. And the chart looks pretty solid to me. I guess I like it :).
Thanks so much for stopping by! If you have any questions or comments, please feel free to leave them right here on the blog or email me at bobsadviceforstocks@lycos.com.
Bob


