


Hello Friends! Thanks so much for stopping by and visiting my blog, Stock Picks Bob's Advice. As always, please remember that I am an amateur investor, so please consult with your professional investment advisors prior to making any investment decisions based on information on this website.
 Looking through the list of top % gainers on the NYSE today, I saw that DJ Orthopedics (DJO), an old pick of mine, was on the list today. DJO is trading at $31.35, up $.95 or 3.13% on the day as I write.
 I first posted DJ Orthopedics (DJO) on Stock Picks Bob's Advice on August 22, 2003, when it was trading at $10.89. The stock has thus appreciated $20.46 or 187.9% since posting. Unfortunately, I do not own any shares or options on this company.
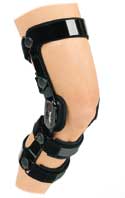
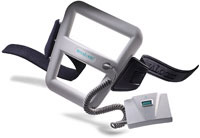
According to the Yahoo "Profile" on DJO, the company "...engages in the design, manufacture, and marketing of surgical and nonsurgical products that repaid, regenerate, and rehabilitate soft tissue and bone, help protect against injury, and treat osteoarthritis of the knee."
 On October 27, 2005, DJO reported 3rd quarter 2005 results. Net revenues for the quarter ended October 1, 2005, increased 15.5% to $72.1 million, up from $62.5 million in the same quarter last year. Net income grew 61.4% to $7.5 million or $.33/share up from $4.7 million or $.20/share in the third quarter of 2004.
Looking longer-term at the Morningstar.com "5-Yr Restated" financials on DJO, we can see that since 2000, revenue has grown steadily from $143.6 million to $269.6 million in the trailing twelve months (TTM). Earnings improved from a loss of $(.85) in 2002, increasing to $.64/share in 2003, dipping to $.63/share in 2004, and have grown strongly this past year to $1.05/share int eh TTM.
Free cash flow has also been improving steadily the last few years with $11 million reported in 2002, improving to $36 million in the TTM.
The balance sheet looks reasonable with $6.2 million in cash and $86.3 million in other current assets...plenty to almost cover both the $32.5 million in current liabilities and the $65.2 million in long-term liabilities.
 Checking some "Key Statistics" from Yahoo on DJO, we find that this is a small company with a market capitalization of only $691.00 million. The trailing p/e is a moderate 26.89 with a more reasonable forward p/e of only 21.50. The reported "5 yr estimated" PEG comes at 1.71. However, with the strong latest quarter, I am not sure this figure takes that result into consideration.
Using the Fidelity.com eresearch website to get a better 'feeling' on the value of DJO relative to other companies within its industrial grouping of "Medical Appliances/Equipment", we can see that the Price/Sales ratio is quite reasonable within its group.
Leading the group is St. Jude (STJ) with a Price/Sales ratio of 7.1, followed by Medtronic (MDT) at 6.7, Zimmer Holding (ZMH) at 5.2, Biomet (BMET) at 4.9, and Edwards Lifesciences (EW) at 2.7. At the bottom of the list, representing the best value in regards to this parameter, is DJ Orthopedics (DJO) with a Price/Sales ratio of only 2.50.
Reviewing some more numbers from Yahoo, we find that there are 21.87 million shares outstanding. as of 10/11/05, there were 1.60 million shares out short, representing 7.40% of the float or 9.1 days of trading volue. Using my own '3 day rule' on short interest, this looks significant to me imho.
No cash dividend and no stock dividends are reported on Yahoo.
What about a chart? Taking a look at the Stockcharts.com "Point & Figure" chart on DJO:
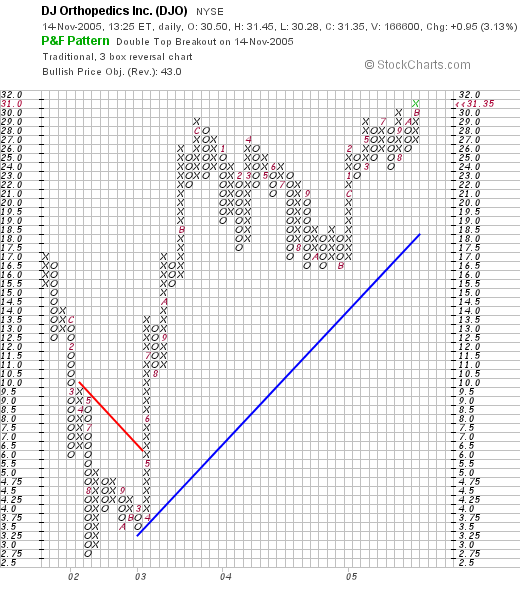
The chart currently looks strong. The stock declined sharply from $17 in late 2001, dropping to a low of $2.75 in August, 2002. From there the stock broke through its resistance line in May, 2003, and hasn't looked back, charging higher to the $31 level. This looks like a strong chart to me!
So what do I think? The stock looks very attractive to me. Valuation is reasonable in light of the small size and quick growth in earnings, the latest quarterly report was quite strong, the Morningstar.com wasn't quite perfect, but still looked quite good for the past few years, and valuation is reasonable. On top of all of this, the chart looks encouraging as well.
Now, if only I had a signal that I could be buying shares of stock :(. Oh well, thanks again for stopping by and visiting. I hope that my discussions are helpful to you in thinking about stocks. Be sure to explore the links in each article. And if you have any comments or questions, please feel free to leave them on the blog or email me at bobsaviceforstocks@lycos.com.
Bob