Hello Friends! Thanks so much for stopping by and visiting my blog, Stock Picks Bob's Advice. As always, please remember that I am an amateur investor, so please remember to consult with your professional investment advisors prior to making any investment decisions based on information on this website.
 As I like to do when looking for a potential stock pick, I started out tonight looking through the list of top % gainers on the NYSE today. Near the top of the list was Veritas DGC Inc. (VTS), which I of course initially confused with Veritas Software (VRTS), which of course you wouldn't do would you? Anyhow, VTS closed at $37.28, up $3.00 or 8.75% on the day. I do not own any shares of this stock nor do I have any options on this equity.
"Image courtesy of Veritas DGC Inc. All rights reserved."
 So what does Veritas DGC do anyway? Well, according to the Yahoo "Profile" on VTS:
Veritas DGC, Inc. provides geophysical information and services for the national and independent oil and gas companies worldwide. It acquires, processes, interprets, and markets geophysical information that provides 2D and 3D images of the subsurface. The company also produces 4D surveys, which record fluid movement in the reservoir, by repeating specific 3D surveys over time. In addition, it uses geophysical data for reservoir characterization to enable its customers to recover oil and natural gas.Veritas DGC is in the Seismic Information business for the Oil Industry!
As is often the case, what drove the stock higher today was an earnings report. In fact, yesterday, after the close of trading VTS announced 1st quarter 2006 earnings. The results, on first glance, were nothing short of fabulous. Revenue for the quarter climbed 30% to $168.7 million from $129.6 million. For the quarter earnings were $11.8 million or $.32/share, up about 1,000% (honestly) from $978,000 or $.03/share the year earlier. The latest quarter does include a $2 million one time insurance payment, but even without that payment, the earnings growth was phenomenal! Expectations by Thomson Financial were reported to be $.20/share on $155.4 million of revenue. Clearly, the company blew away analysts expectations. That, of course, is always bullish for a stock price.
 And what does Morningstar report on this company? Taking a look at the "5-Yr Restated" financials from Morningstar.com on VTS, we can see that except for a small dip in revenue from $476.6 million in 2001 to $452.2 million in 2002, revenue has grown steadily to $634 million in the trailing twelve months (TTM). Earnings have been erratic; dropping from $.68 to a loss of $(1.77) between 2001 and 2003, then turning positive in 2004 and increasing to $2.37/share in the TTM.
And free cash flow? This is solidly positive, increasing from $170 million in 2003 to $269 million in the TTM.
The balance sheet as reported by Morningstar shows $249.4 million in cash and $203 million in other current assets. This is quite adequate to cover both the $192.4 million in current liabilities and the $191.6 million in long-term liabilities combined.
 And how about some valuation 'numbers' on this stock? Looking at Yahoo "Key Statistics" on Veritas DGC, we find that the stock is a mid-cap stock with a market capitalization of $1.29 billion. The trailing p/e is nice at 15.74, and the forward p/e is actually higher (?) (fye 31-Jul-07) at 18.36. No PEG is reported.
Using the Fidelity.com eResearch site on VTS, we can see that Veritas DGC is in the "Oil & Gas Equipment/Svcs" Industrial Group. Within this group, VTS sports a very reasonable Price/Sales ratio of 1.9. Topping this group is Schlumberger (SLB) at 4.5, BJ Services (BJS) at 4.1, Baker Hughes (BHI) at 3, Cooper Cameron (CAM) at 2, then Veritas DGC (VTS) at 1.9 and Halliburton (HAL) at 1.7.
Looking for some additional numbers on VTS, Yahoo shows 34.59 million shares outstanding. As of 11/10/05, there were 2.42 million shares out short, representing 7% of the float or 4 trading days (the short ratio) of volume. This is a bit heavy imho, and may be some of the buying pressure in this stock.
No cash dividend is paid and the last stock split reported by Yahoo was a reverse 1:3 split in January, 1995.
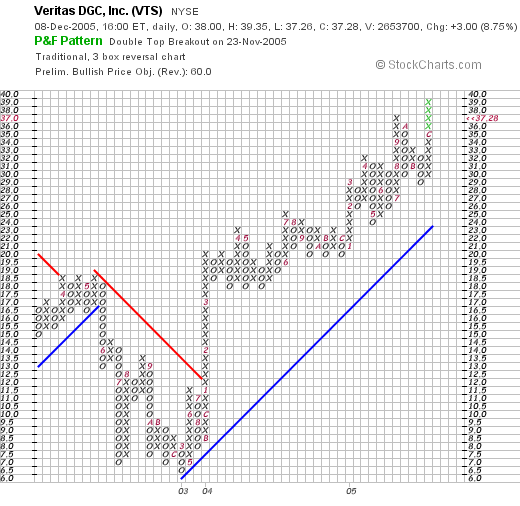
What about a chart? Looking at a "Point & Figure" Chart on VTS from Stockcharts.com, we can see that the stock traded lower from $18.50 in April, 2002, to $6.50 in March, 2003, and then started trading higher. The stock is trading nicely higher since that period, above its support line on the graph. It is interesting that this period of weakness in the chart corresponds nicely with the underlying performance of the company during this time.

So what do I think? Well, the company is certainly in a very hot energy-related field. The latest quarterly report was superb, the Morningstar report for the last few years has been strong and valuation is downright cheap in both the p/e and the price/sales reviews. The chart looks nice and I don't think it is done with its climb imho. Unfortunately, I don't have a buy signal to allow me to buy this stock. But the overall picture is certainly interesting.
Thanks so much for stopping by! If you have any comments or questions, please feel free to email me at bobsadviceforstocks@lycos.com. Or you can just leave your comments right on the blog.
Bob
Posted by bobsadviceforstocks at 10:18 PM CST
|
Post Comment |
Permalink
Updated: Thursday, 8 December 2005 11:19 PM CST
Updated: Thursday, 8 December 2005 11:19 PM CST


