


CLICK HERE FOR THE PODCAST ON HIBBETT

Hello Friends! Thanks so much for stopping by and visiting my blog, Stock Picks Bob's Advice. As always, please remember that I am an amateur investor, so please remember to consult with your professional investment advisors prior to making any investment decisions based on information on this website.
I try to do several things simultaneously on this website. First of all, I am looking to find stocks that fit my criteria for investment. Those stocks with good momentum, fundamentals, valuation, and a reasonable chart. To determine how these selections are doing I try to review past stock selections each weekend as I did earlier today.
On top of this, I am also trying to build a real trading portfolio based on these same criteria and portfolio management strategy. In my attempt to be as straight-forward and transparent as possible, I post my actual trades as soon as I can after I do them, and also have started reviewing my individual stocks with you so that you can get a better feel for my own actual portfolio. I started this about a year ago, and was reviewing my holdings weekly. However, with only 20 positions now, that would mean reviewing each stock more than once/year. Thus, even with a maximum of 25 positions, I am going to continue to try to review these stocks; however, I am going to try to do this every other week! Two weeks ago I reviewed my Genesco holding. Going alphabetically, I am up to Hibbett (HIBB), one of the strongest stocks in my portfolio.
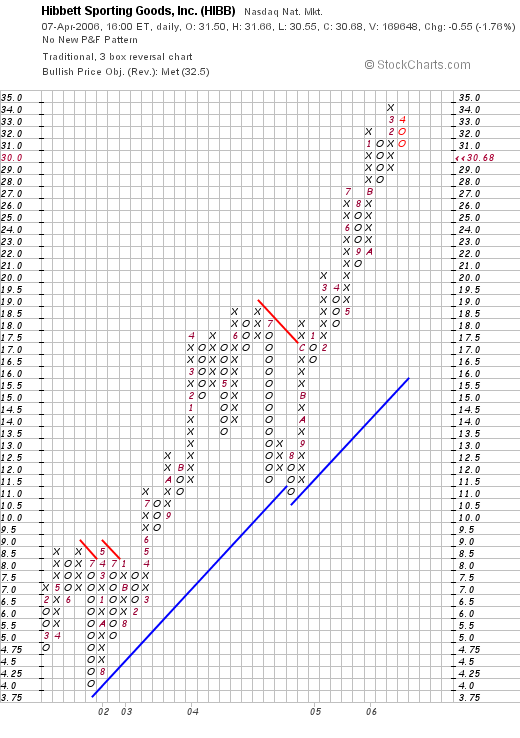
 I currently own 84 shares of Hibbett Sporting Goods (HIBB) which closed at $30.68 on April 6, 2006. These shares were acquired on March 6, 2003, with a cost basis of $6.50/share giving me a gain of $24.18/share or 372% since purchase.
As is my strategy, I have been selling portions of my holdings as the stock price appreciates. Unfortunately, when I initially set up my trading strategy, I was selling 1/4 positions of the remaining shares, and my positions have been dwindling in size initially even as I took my profits. Realizing that 1/4 was too large a position to be selling, I have kept my same sale points, but now sell 1/6th of my remaining positions at the same intervals.
 In case you are new to my blog, or don't recall my selling strategy, let me remind you that first of all, after an initial purchase, I will sell all of my shares quickly at an 8% loss on the downside. Otherwise, I sell my shares slowly, selling 1/6th of my holding at the following grouped targets (I group by four targets): 30, 60, 90, 120% gains, then 180, 240, 300, and 360%, then 450, 540, 630, 720%, etc.
 After having sold a stock once at a 30% targeted gain, I sell all of my shares at break-even. Otherwise, I sell all of my shares if the stocks retrace 50% of the highest sale-at-a-gain point. That is, if I have sold portions three times, with the last sale being at 90% appreciation, then I would sell all of my remaining shares if the stock retraces to a 45% appreciation level.
But let's get back to Hibbett.
 After puchasing 100 shares in January, 2003, and another 100 shares in February, 2003, at approximately $21/share at that time, I started selling portions of my shares as the stock appreciated. I sold 50 shares 5/30/03, 50 shares 9/4/03, 40 shares 10/15/03, 20 shares 4/5/04, 42 shares 2/4/05, 32 shares 5/20/5, 24 shares 6/16/05, and finally 27 shares 11/21/05. From my original approximately $4,500 investment in HIBB, I have sold shares 8 times with proceeds totalling $8,510.41, with a total of realized gains of $4645.15. I still have $2,577.12 worth of Hibbett Stock in my Trading Portfolio.
Since my last sale was my 8th sale, this would have been at the 450% appreciation point. The stock is trading under this level now. If I were to be selling 1/6th of my position, I shall be waiting for the 540% appreciation level (!), or 6.4 x $6.50 = $41.60. On the downside, I shall be unloading all of my Hibbett shares if the stock declines to 50% of my highest sale point or at a 225% gain, 3.25 x $6.50 = $21.13/share.
 But let's stop talking about me and let's talk about Hibbett. Let's see if the stock still looks like it belongs in this blog.
First of all, their business. According to the Yahoo "Profile" on Hibbett, the company
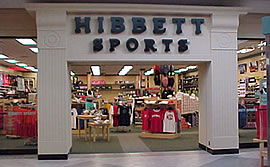
"...operates sporting goods stores in small to mid-sized markets in the southeast, mid-atlantic, and midwest United States. The company, through its stores, offers athletic equipment, footwear, and apparel. As of February 2, 2006, it operated 549 Hibbett Sports stores, including smaller-format Sports Additions athletic shoe stores and larger format Sports & Co. superstores."Let's check and see if there is any news of significance on the company.
The latest news appears to be the 4th quarter 2006 earnings report. Reported on March 9, 2006, the company reported:
"Net sales for the 13-week period ended January 28, 2006, increased 12.8% to $120.8 million compared with $107.1 million for the 13-week period ended January 29, 2005. Comparable store sales increased 2.5% in the fourth quarter of fiscal 2006. Net income for the fourth fiscal quarter increased 21.7% to $9.9 million compared with $8.1 million in the fourth fiscal quarter of last year. Earnings per diluted share increased 26.1% to $0.29 compared with $0.23 per diluted share in the prior year."So from my perspective this was a satisfactory report. Revenue was up nicely, earnings were solid, but the same store sales gain of 2.5% is a bit anemic and I suspect that is why the stock price is currently consolidating instead of continuing to charge higher.
How about longer-term?
 Looking at the Morningstar.com "5-Yr Restated" financials on HIBB is simply drop-dead gorgeous. This is a textbook example of what I am looking for in a stock. I mean talking about having all of your ducks in a row!
Revenue has steadily grown from $210 million in 2001 to $378 million in 2005 and $427 million in the trailing twelve months (TTM). Earnings have also been steadily growing from $.32/share in 2001 to $.71/share in 2005 and $.92/share in the TTM. Shares outstanding has also been fairly steady with 33 million in 2001, increasing to 35 million by 2005 and 36 million in the TTM.
Free cash flow? Also perfect imho. With $11 million in 2003, increasing to $33 million in 2005 and $35 million in the TTM.
What about the Morningstar.com reported balance sheet? Calculating the "current ratio", comparing the total current assets to the current liabilities, gives us a total of $155.2 million in current asets, balanced against $56.7 million in current liabilities--almost a current ratio of 3. The current assets can easily pay off the total combined liabilities of $70 million, more than two times over.
 What about some valuation numbers on this stock?
Reviewing the Yahoo "Key Statistics" on Hibbett, we find that HIBB is a mid-cap stock with a market capitalization of $1.1 billion. The trailing p/e is a moderate 31.37, with a forward p/e (fye 28-Jan-08) of only 23.42. Calculating the PEG based on the 5 Yr Expected growth, gives us a PEG of only 1.19. Thus, valuation by this measure isn't bad at all.
According to the Fidelity.com eResearch website, Hibb is the 'priciest' of the stocks in the "Sporting Goods Stores" industrial group, with a Price/Sales ratio of 2.5. This is followed by Golf Galaxy (GGA) at 1.5, Dick's Sporting Goods (DKS) at 0.8, Big 5 Sporting Goods (BGFV) at 0.5, and Sports Authority (TSA) at 0.4. No bargain by this parameter!
Finishing up with Yahoo, we find that there are 35.71 million shares outstanding with 35.47 million of them that float. Currently there are 1.62 million shares out short (3/10/06) representing 4.60% of the float, or 7.2 trading days of volume. This number, if I use my arbitrary 3 day cut-off, looks significant to me and on any good news, the short-sellers could be subject to a bit of a squeeze as they scramble to cover. However, on the other hand, a heavy dose of short-sellers suggest investors who believe the stock should be trading lower.
What about a chart? Looking at a "Point & Figure" chart on Hibbett from StockCharts.com, we can see an absolutely GORGEOUS graph of the stock which after some consolidation in July, 2001, climbed almost perfectly from $4.00 level to the current $30.68 mark. The stock really hasn't consolidated as much as I thought! There isn't much weakness on this graph at all.
So what do I think? Well I sure am glad I own this stock! Unfortunately, my sales have been a bit too large and my position has dwindled a bit since my original purchase. Hopefully, with 1/6th sales in the future, the positions will be able to increase in size as they spin off their profits.
How about the stock? Well, everything looks nice except for two points I should review: the Price/Sales ratio is indeed a bit steep for its group and the same store sales number at 2.55% is a tad anemic but then again the entire retail market appears a bit weak. I like their position in small towns across the south-east as they shadow the Wal-Mart stores. There appears to be a lot of room for them to continue to expand this concept.
Thanks so much for stopping by and visiting! I hope I wasn't too verbose today, but then again, I enjoy discussing things with you and sometimes it takes a few words to get a point across :).
If you have any comments or questions, please feel free to leave them on the blog or email me at bobsadviceforstocks@lycos.com. Please be sure to visit my Bob's Advice Podcast Website! Have a great weekend!
Bob
Updated: Saturday, 8 April 2006 8:39 PM CDT