


Hello Friends! Thanks so much for stopping by and visiting my blog, Stock Picks Bob's Advice! As always, please remember that I am an amateur investor, so please remember to consult with your professional investment advisers prior to making any investment decisions based on information on this website.
![]()
Looking through the list of top % gainers on the NASDAQ, I came across Hardinge (HDNG), a stock that I have seen make the top % list a few times in the past few weeks. Hardinge closed at $35.45, up $2.61 or 7.95% on the day. I do not have any shares nor do I own any options on this stock.
HARDINGE (HDNG) IS RATED A BUY
Let's take a closer look at this stock which has also been part of the IBD 100 list recently.
What exactly does this company do?
According to the Yahoo "Profile" this company
"...through its subsidiaries, engages in the design, manufacture, distribution, and marketing of computer controlled metal-cutting lathes, machining centers, grinding machines, collets, chucks, indexing fixtures, and other industrial products. It also offers workholding devices for machine tools. The company provides its services to aerospace, automotive, construction equipment, defense, energy, farm equipment, medical equipment, recreational equipment, telecommunications, and transportation industries, as well as to small and medium-sized independent job shops."
How did the company do in the latest quarter?
On May 10, 2007, Hardinge reported 1st quarter 2007 results. Net sales for the quarter came in at $87 million, up 15% over the $75.4 million in net sales for the same quarter in 2006. Net income was $5.3 million or $.60/diluted share, up 173% from net income of $1.9 million or $.22/diluted share in the same quarter in 2006. Orders for the quarter came in at $95.6 million, up 25% compared to the $76.7 million in orders for the same quarter in 2006.
How about longer-term results?
Reviewing the Morningstar.com "5-Yr Restated" financials on Hardinge (HDNG), we can see that revenue has been steadily increasing from $169 million in 2002 to $327 million in 2006 and $338 million in the trailing twelve months (TTM).
Earnings have been a little less consistent, dropping from $.23/share in 2002 to a loss of $(1.30)/share in 2003. The company returned to profitability in 2004 with $.50/share in earnings and has grown earnings steadily to $1.58/share in 2006 and $1.96/share in the TTM.
Hardinge, after paying $.10/share in dividends in 2002, cut it back to $.02/share (at the same time as it turned to a loss from a profit). However, since 2002, the company has raised its dividend each year with $.14/share paid in 2006 and $.16/share in the TTM.
The company has maintained outstanding shares at a steady 9 million.
Free cash flow which was a negative $(12) million in 2004 and $(11) million in 2005, turned positive in 2006 at $3 million, and has been $2 million in the TTM.
The balance sheet appears solid with $15.4 million in cash and $227.2 million in other current assets reported. This total of $242.6 million, when compared to the current liabilities of $75.5 million yields a healthy current ratio of 3.21. In addition, the company has a modest $106.6 million in long-term liabilities.
What about some valuation numbers?
Checking the Yahoo "Key Statistics" on Hardinge, we can see that this is a small cap stock with a market capitalization of $315.15 million. The trailing p/e is a moderate 18.04 with a forward p/e of only 15.76. No PEG ratio is reported.
Looking at Fidelity.com eresearch website for more information, we find that the Price/Sales ratio (TTM) also is reasonable for HDNG coming in at 0.86, with an industry average of 1.51. In terms of profitability, the company doesn't do quite as well with a Return on Equity (TTM) of 11.18% compared to the industry average reported on Fidelity of 23.12%.
Finishing up with Yahoo, we find that there are 8.89 million shares outstanding with 7.19 million that float. As of 5/10/07, there were 175,950 shares out short representing 2% of the float or only 0.9 trading days of volume. This doesn't appear significant to me.
The company currently pays a forward annual dividend of $.20/share yielding 0.6%. The last stock split was a 3:2 split in June, 1998.
What does the chart look like?
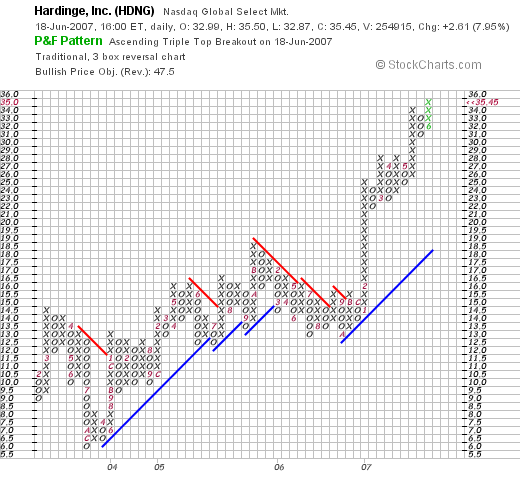
If we review a "Point & Figure" chart on Hardinge (HDNG) from StockCharts.com, we can see that the stock which dipped to $6.00 in December, 2003, climbed to $18.50 in November, 2005, only to pull back to $12.50 in October, 2006. Since that time, the stock has broken through resistance climbing sharply in February, 2007, from $16 to $25. Recently, the stock has been pushing higher once again into the $35 range this past month. The chart looks quite strong to me.
Summary: What do I think about this stock?
Quite frankly, I like this stock a lot. You all may figure I haven't yet met a stock I haven't liked....and that is almost true :). But seriously, the company had a terrific quarter with blow-out numbers on earnings. They have been steadily increasing revenue. They even pay a dividend and have been increasing it!
The number of shares is small but steady, free cash flow is now positive, and the balance sheet is solid.
Valuation-wise, the Price/Sales ratio is quite reasonable although the Return on Equity is a bit under the average. Finally, the chart looks very strong! If I were in a position to be buying a stock, this is the kind of stock I would be buying today! Meanwhile, I shall add it to the blog and keep it in my "vocabulary" of investable stocks.
Thanks so much for stopping by and visiting my blog. If you have any comments or questions, please feel free to email me at bobsadviceforstocks@lycos.com or just leave a note right on the website. If you get a chance, be sure and visit my Stock Picks Podcast Website, where I discuss many of the same stocks I write about here on the blog.
Bob