


Hello Friends! Thanks so much for stopping by and visiting my blog, Stock Picks Bob's Advice! As always, please remember that I am an amateur investor, so please remember to consult with your professional investment advisers prior to making any investment decisions based on information on this website.
The market is doing a little better today with the Dow up 77.07 and the NASDAQ ahead by 9.57. In addition, we have oil down at $87.55, down $(.73)/barrel. Not a huge rally, but a nice day nonetheless.
It is in this context that I thought I might find and write up a new stock this afternoon. I shall try to be briefer than usual but still cover the important points.
 Silicom (SILC) made the list of top % gainers on the NASDAQ today and as I write is trading at $15.13, up $1.55 or 11.41% on the day. I do not own any shares nor do I have any options on this stock.
Let's take a closer look and I will explain why
SILICOM (SILC) IS RATED A BUY
First of all,
What exactly do they do?
According to the Yahoo "Profile" on SILC, the company
"...through its subsidiary, Silicom Connectivity Solutions, Inc., engages in the design, manufacture, marketing, and support of connectivity solutions for a range of servers and server-based systems in Israel, the United States, and internationally. It primarily manufactures server networking cards with and without bypass (Server Adapters), and legacy products, including connectivity solutions for portable personal computers and broadband Internet access products."
How did they do in the latest quarter?
On October 29, 2007, Silicom reported 3rd quarter 2007 results. For the quarter ended September 30, 2007, revenues came in at $6.6 million, up 59% from the $4.2 million in the same quarter of 2006. Net income climbed 147% to $1.6 million or $.25/diluted share compared to $666,000 or $.12/diluted share for the 3rd quarter of 2006.
How about longer-term results?
Examining the Morningstar.com "5-Yr Restated" financials on SILC, we can see that revenue has steadily grown since 2002 when the company reported $2.7 million in revenue. This increased more than five-fold to $16 million in 2006. Earnings have also imporved from a loss of $(.61)/share in 2002 to $(.30)/share in 2004, $.30/share in 2005 and $.49/share in 2006.
Outstanding shares which were at 4 million increased to 5 million in 2006. Free cash flow which was at $-0- in 2005, improved to $2 million in 2006.
The balance sheet, as reported on Morningstar, looks solid with $5.0 million in cash, plenty to cover both the $3.5 million in current liabilities and the $1.2 million in long-term liabilities. Calculating the current ratio, the company has a total of $13 million of current assets, which when compared to the current liabilities of $3.5 million works out to a ratio of 3.71--very healthy from my perspective.
What about some valuation numbers?
Checking Yahoo "Key Statistics" on SILC we can see that this stock is a micro cap stock with a market cap of only $96.44 million. The trailing p/e is a very reasonable (imho) 16.05 with a forward p/e of only 13.75. The PEG works out (5 yr expected) to a modest 0.93.
Examining the Fidelity.com eresearch website for valuation, we find that the Price/Sales (TTM) is a very reasonable 2.77 compared to the industry average of 7.66. In terms of profitability, SILC comes in a bit under the average in terms of "Return on Equity" TTM of 21.64% compared to the industry average of 26.70%.
Finishing up with the numbers from Yahoo, there are 6.49 million shares outstanding with only 4.45 million that float. As of 11/9/07, therewere 142,440 shares out short representing 3.1% of the float or 0.6 trading days of volume. No dividends are reported and no stock splits are recorded on Yahoo.
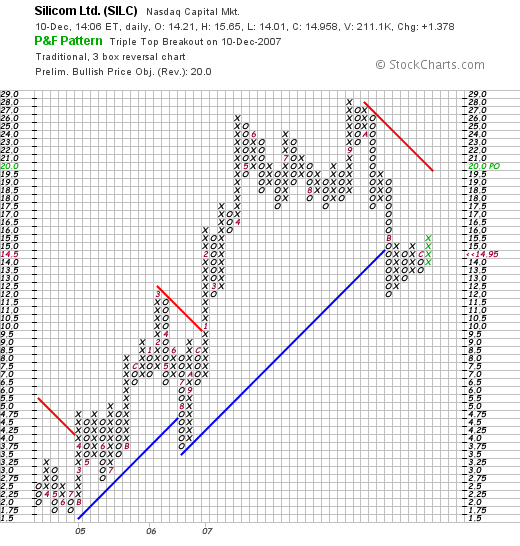
What about the chart?
Looking at the "point & figure" chart on Silicom from StockCharts.com, we can see that since July, 2004, when the stock was selling at as low as $1.70, the stock has appreciated strongly to a recent high of $28 in September, 2007. The stock recently sold off to a low of $12.00 in November, 2007. The stock is still welling below support levels and under resistance at around $19. Of all of the things I reviewed on this stock, the chart appears to be the weakest part of the equation. However, it is not enough to keep me from posting that "buy" assessment.
Summary: What do I think?
This is a really small company with a market capitalization under $100 million. However, the earnings results were very nice, the Morningstar report was solid, and valuation is very reasonable. The only thing keeping me back at all is the chart which is a bit less than encouraging--although recently the stock has been consolidating and moving higher.
Thanks again for visiting my blog! If you have any comments or questions, please be sure to leave them on the website or email me at bobsadviceforstocks@lycos.com.
If you get a chance, be sure and visit my Stock Picks Podcast Page where some of the many stocks I write about are presented in a radio show format. Other places to visit include my Covestor Page where the performance of my actual trading portfolio is tracked and compared to other participating investors, and my SocialPicks page where my stock picks from the past year are all reviewed and the results monitored.
If you are looking for a unique place to invest your money, consider exploring Prosper.com where you can join with other like-minded investors and lend money to individuals. These non-secured loans are quite high risk so please make sure you understand the risks involved before participating in this website.
Thanks again for visiting! Have a great week trading and investing!
Bob


