Hello Friends! Thanks so much for stopping by and visiting my blog, Stock Picks Bob's Advice! As always, please remember that I am an amateur investor, so please remember to consult with your professional investment advisers prior to making any investment decisions based on information on this website.
 This past Thursday (12/24/09) I sold a portion of my 3M (MMM) holding as it had appreciated to a 90% gain from my initial purchase. (I wrote about it here.) Having only 7 positions in my portfolio, well under my maximum of 20 holdings, this partial sale of my 3M holding as it appreciated gave me a 'buy signal' to be adding a new holding to my portfolio and to transfer some of my cash into equity. With that in mind, I chose to purchase 50 shares of Johnson & Johnson (JNJ) today at $64.93/share. The size of the purchase was based on my own calculation of the average size of my holdings in my trading account and what 125% of that size would allow me to purchase.
Let's take a closer look at this bluest of blue-chip stocks Johnson & Johnson (JNJ) and why it might represent a good addition to my growing stock portfolio.
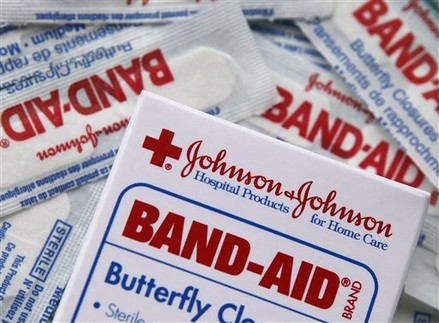
First of all Johnson & Johnson does quite a bit more than just make band-aids! As the Yahoo "Profile" on JNJ points out, the company
"...engages in the research and development, manufacture, and sale of various products in the health care field worldwide. Its Consumer segment provides products used in baby care, skin care, oral care, wound care, and women’s health care fields, as well as nutritional and over-the-counter pharmaceutical products...."
Johnson and Johnson is not the picture of uninterrupted growth that I prefer to find in my investments. It is a picture of a large growth stock with quality brands that due to the economic slowdown presents a compelling opportunity for investment from my perspective.
On October 13, 2009, JNJ reported 3rd quarter earnings. Revenue dipped (5.3)% for the quarter to $15.08 billion, down from $15.92 billion the prior year. Earnings however came in stronger at $3.35 billion or $1.20/share, compared to $3.31 billion or $1.17/share the prior year. The company beat expectations of $1.13 on earnings, but missed on revenue expectations which had been estimated to come in at $15.19 billion.
Longer-term, looking at the Morningstar.com "5-Yr Restated" financials on Johnson & Johnson, we can see the relatively steady growth in revenue from $47.3 billion in 2004 to a peak of $63.7 billion in 2008 before dipping to $60.5 billion in the trailing twelve months (TTM).
 Earnings have increased in an uninterrupted fashion from $2.74/share in 2004 to $4.58/share in the trailing twelve months. Dividends have been paid and have been increased annually from $1.10/share in 2004 to $1.80/share in 2008 and $1.90/share in the TTM. Outstanding shares increased from 2.99 billion shares in 2004 to 3.00 billion in 2005 before beginning a steady descent as the company bought back shares dippping to 2.84 billion shares in 2008 and 2.79 billion in the TTM.
Free cash flow has grown slowly from an impressive $11.5 billion in 2006 to $12.6 billion in the TTM.
If we look at the balance sheet as presented on Morningstar.com, we can see that JNJ has $11.9 billion in cash, $23.7 billion in other current assets for a total of $35.6 billion in current assets. Compared to the $19.2 billion in current liabilities this yields a current ratio of 1.85. The company has a significant but apparently manageable long-term liabilties of $21.9 billion.
In terms of valuation, according to the Yahoo "Key Statistics" on Johnson & Johnson, the company has a market cap of $179.18 billion. The trailing p/e is a modest 14.18 with a forward p/e (fye 28-Dec-10) estimated at 13.17. The PEG is reported at 1.87 suggesting that the 5 yr expected growth rate is in the single digits.
Yahoo reports that there are 2.76 billion shares outstanding and that 21.33 million of them as of November 30, 2009, are out short. This represents only 1.8 trading days of volume. The company pays a forward dividend of $1.96/share with a yield of 3.00%. The dividend is well-covered by earnings with a payout ratio of only 41%. The company last split its stock in June, 2001.
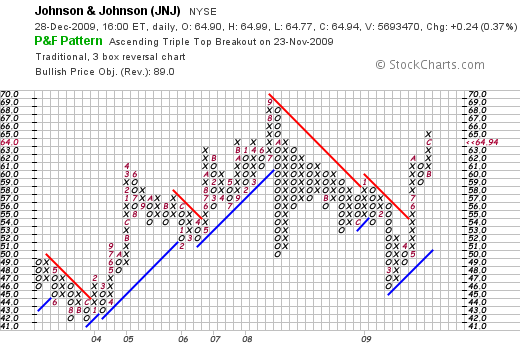
Examining a 'point & figure' chart on Johnson & Johnson (JNJ) from StockCharts.com we can see that the stock has rallied from a low of $42/share in December, 2003, to a peak of $69 in September, 2008, before dipping to a recent low of $46 in March, 2009. Since that time, the stock price has rallied strongly to break through resistance levels to its current level of $64.94/share.

To summarize, my partial sale of shares of my 3M stock entitled me to add a new position. In these uncertain times, Johnson & Johnson offers some comfort in its solid and growing dividend history, low p/e, steady history of revenue growth interrupted only by a recent dip in revenue, and strong free cash flow generation with a solid balance sheet. Johnson & Johnson has a whole flock of brands from Tylenol to Aveeno to Splenda, Sudafed and Motrin. Still having bruises from the market turmoil, it is nice to buy some Band-Aids to cover over some of my superficial financial injuries!
Thanks again for stopping by and visiting! If you have any comments or questions, please feel free to leave your comment here or email me at bobsadviceforstocks@lycos.com.
Yours in investing,
Bob


