Hello Friends! Thanks so much for stopping by and visiting my blog, Stock Picks Bob's Advice! As always, please remember that I am an amateur investor, and that you should always consult with your professional investment advisor prior to making any decisions based on information on this website.
I apologize for the infrequency of my posts here on this blog. I have not forgetten any of you who might choose to follow my posts and I hope that I may have contributed to your understanding of my own methods (which far from unique or original) may assist you in making decisions on purchases of shares that hopefully will ultimately be profitable for you.
 Looking through the Monday (9/18/17) edition of the Investor's Business Daily "IBD50", I came across Lam Research (LRCX) that happened to be listed as #13 on the list of top 50 stocks as rated by the IBD. Lam Research closed at $172.99 on September 15, 2017, up $.41 or .24% on the day. I do not currently own any shares of LRX but I may buy some in the future as I find this particular investment very attractive as I shall try to explain.
As I look through this list of stocks, I apply my own strategy of trying to identify stocks with strong growth characteristics without being, from my perspective, too overly priced. In fact even as a momentum investor, I am looking for good value, perhaps making me a GARP investor.
What exactly does Lam Research do?
According to the Yahoo Profile on LRCX, the company
"..designs, manufactures, markets, refurbishes, and services semiconductor processing equipment used in the fabrication of integrated circuits worldwide."

And the latest quarterly results?
On July 27, 2017, LRCX reported 4th quarter 2017 results. Earnings for the quarter came in at $3.11/share exceeding Zacks estimates of $3.02. Sequentially this was an 18.9% increase over the prior quarter and year-over-year this was a sharp 84.1% increase.
Revenues for the quarter were equally impressive coming in at $2.34 billion exceeding estimates of $2.31 billion and this was an 8.9% sequential improvement and a 51.7% increase over the prior year.
The company also raised guidance for fiscal first quarter 2018 with a new earnings estimate of $3.25 (+/- 12 cents) over the prior guidance, according to Zacks of $2.76/share.
I like to call this kind of quarterly report a "Trifecta" (with apologies to my horse racing fans) as the company came in with strong earnings as well as revenue and beat expectations and then went ahead and raised guidance!
And longer-term results?
For this I like to turn to Morningstar which has some excellent information for stocks as well as mutual funds which many of us are more familiar with their 'star ratings'. Reviewing the 5-year financials, we can see outstanding results with revenue increasing in an un-interrupted fashion from $3.59 billion in 2013 to $5.9 billion in 2016 and $8.0 billion in 2017.
Similarly, diluted earnings per share have grown dramatically from $.66/share in 2013 to $5.22/share in 2016 and $9.24/share in 2017. Outstanding shares have grown modestly from 173 million shares in 2013 to 184 million shares in 2017. I prefer to see some retirement of outstanding shares with buy-backs but this isn't much of an inflation of shares outstanding.
Free cash flow data from Morningstar is also quite impressive. Lam Research reported $559 million in free cash flow in 2013 which increased to $1.2 billion in 2016 and $1.9 billion in 2017.
And valuation? Taking a look at some Yahoo Statistics on LRCX, we find that the company is a large cap stock with a market capitalization of $28.1 billion. The trailing P/E is a moderate 18.72 but the forward P/Eis a dirt-cheap 12.69 giving this stock a screaming bargain PEG ratio of 0.65 (5 year expected). There are 162.46 million shares outstanding with 9.21 million shares out short and with average trading volue of 2.32 million, this yields a short ratio of 3.81---a bit over my own arbitrary 3 day level of significance.
The company pays a small dividend of $1.80/share yielding 1.09% going forward. LRCX has paid dividends regularly since 2014 and has increased its dividend payments each year.
And technicals on this stock?
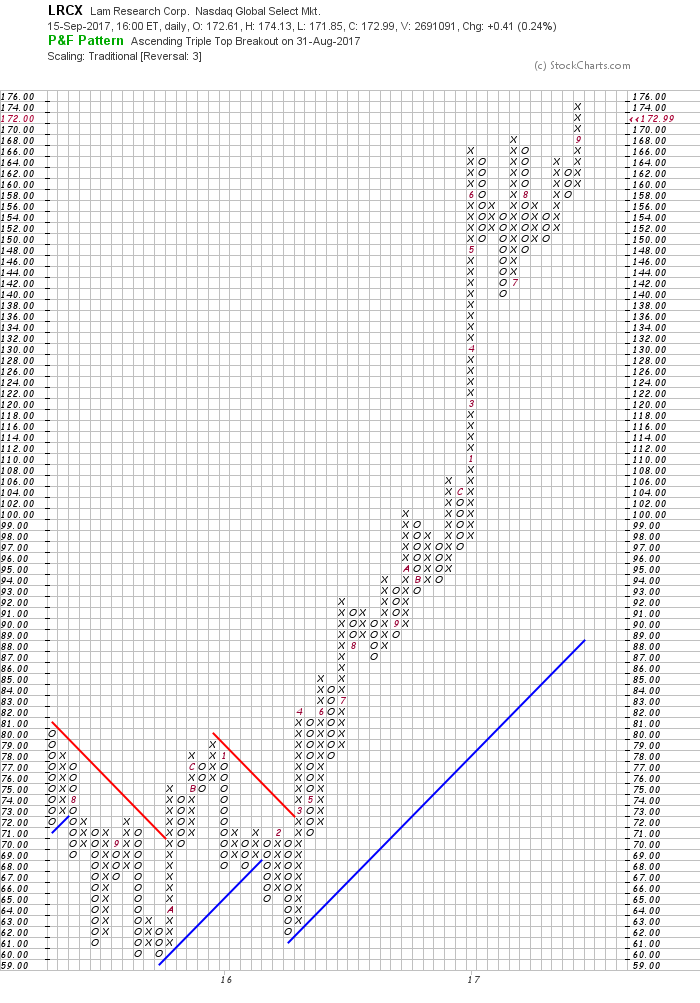
Looking at the StockCharts.com 'Point & Figure' chart on Lam Research we can see that the stock was trading sideways between July, 2015 and March, 2016 in the $60 to $80 range and then literally 'took off' moving rapidly up to $100 in December, 2016, and then once again in January, 2017, moved sharply higher up to $166 and is currently trading near its high at $172.99.

To summarize:
Lam Research (LRCX) is firing on 'all cylinders'. The company has reported strong earnings that exceeded expectations, it has a 5 year record of growing its business, it has great value with a PEG under 1.0, the chart is quite strong and the company even pays a dividend which it has also increased regularly over the last several years.
Some people might complain that Lam, like many successful tech companies is 'expensive', that is it sells at over $170/share and they might liike something 'cheaper' so that they could purchase a larger number of shares. But expensive and cheap are not based on the price of a share which tells you only how many shares you might own for a given amount of buying power. This stock while "expensive" in price is actually "cheap" in value as its P/E and PEG ratio tell a different story of a stock price lagging its actual value. Thus the steep upward ascent in the stock price.
Thank you again for stopping by and visiting here. If you have questions or comments you can leave them here on the blog. With luck, I shall get to a few more posts on a more regular basis :).
Yours in investing,
Bob


