


Thanks so much for stopping by! The trading portfolio is doing a bit of a recovery today as the market improves....two days does not make a bull market...but maybe after a third? As always, please remember to consult with your investment advisors and do your own due diligence on all stocks discussed on this website!
 Scanning through the lists of greatest gainers today, I came across Advanced Neuromodulation Systems (ANSI). I do not own any shares of this stock nor do I have any options or leveraged positions. ANSI is trading, as I write, at $33.03, up $3.56 on the day or 12.08%. According to Yahoo.com, ANSI "...designs, develops, manufactures and market advanced implantable neuromodulation devices that improve the quality of life for people suffering from chronic pain."
This morning, ANSI announced 1st quarter 2004 results. For the three months ended March 31, 2004, revenue increased 35% to $26.6 million from $19.6 million the prior year. Net income for the quarter increased 51% to $4.0 million or $.19/diluted share from $2.6 million or $.13/diluted share last year. Bottom line, this company had a terrific quarter and the stock price has responded accordingly!
If we look at a "5-Yr Restated" financials from Morningstar.com, we can see a fairly impressive and steady growth in revenue from $23.4 million in 1998 to $83.6 million in the trailing twelve months. The company, extrapolating the just reported revenue figures, is operating at a $100 million/year rate for 2004.
Earnings dipped from $.46/share in 1998 to $.06/share in 2000, but have increased steadily and dramatically since then.
Free cash flow which was negative at $(1) million in 2000, has turned positive at $1 million for the trailing twelve months.
The balance sheet is gorgeous! With $96.6 million in cash alone enough to cover the current liabilities of $7.7 million AND the long-term liabilities of $5.4 million, about EIGHT TIMES OVER! And they also have $39.8 million in OTHER current assets. This part of the equation is a "no-brainer".
If we look at "Key Statistics" from Yahoo, we can see that the Market Cap is a small $659.97 million with a trailing p/e of 47.35 which sounds rich, but the company is growing so fast that the forward p/e (fye 31-Dec-05) is only 27.97. Thus, the PEG is at 0.91...making valuation less of a problem. Price/sales is also a bit rich at 6.01.
Yahoo reports 20 million shares outstanding with 18.60 million of them that float. There are a good number of shares out short, with 2.25 million reported as of 4/7/04, representing 12.11% of the float or 3.798 trading days. This is at a level, that with good news, as we got today, we may see a bit of a panic, or squeeze, as the short-sellers scramble to cover their shorts.
Yahoo does not report any cash dividend and the last stock split reported was a 3:2 split in July, 2003.
If we look at the ANSI Point & Figure graph:
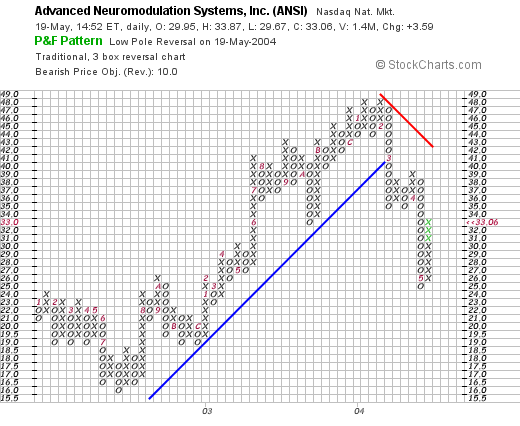
we can see that this stock was trading quite nice between August, 2002 and February, 2004, and actually has broken down from its recent support level of $40. Technically, imho, would like to see the stock break through its resistance level at around $41 before reporting its "technical good health"....but then again, I am but an amateur in reading these charts so you may have a different take in this matter!
What do I think. Well, if I didn't have some trading rules REQUIRING ME TO SIT ON MY HANDS, I would probably be picking up some of these shares. However, I still have lots of margin and my trading rules demand that I sell some stock at a targeted gain before adding another position. Oh well, but that is old news to you of course!
Thanks so much for stopping by and visiting! If you have any comments, questions, or words of encouragement please feel free to post them right here or email me at bobsadviceforstocks@lycos.com
Bob
Updated: Wednesday, 19 May 2004 2:26 PM CDT