


Hello Friends! It is getting late in the evening, but I do have a stock to post! Actually, I have SO MANY stocks discussed here on Stock Picks Bob's Advice, that I thought that I had actually discussed this one, Cooper (COO), already! Actually, the confusion is that I DO OWN shares of COO in my "Trading Portfolio", that were initially purchased in February, 2003. You see there's the rub....I purchased it BEFORE I started my Blog! Anyway, thanks again for stopping by and visiting and be sure to consult with your professional investment advisors prior to making any investment decisions based on information on this website, as I am an amateur investor. If you have any questions or comments about this website, please feel free to email me at bobsadviceforstocks@lycos.com and I will try to get right back to you!
 The Cooper Companies (COO) had a nice day today, closing at $63.33, up $5.38 or 9.28% on the day. As I noted above, I DO own some shares of COO in my trading account, which I also follow on this website. According to the Yahoo "Profile", The Cooper Companies "...develops, manufactures and markets healthcare products through its two principal business units: CooperVision (CVI) and CooperSurgical (CSI). CVI develops, manufactures and markets a range of contact lenses for the worldwide vision care market. CSI develops, manufactures and markets medical devices, diagnostic products and surgical instruments and accessories used primarily by gynecologists and obstetricians."
 What drove the stock higher today, and I feel like I am beginning to sound like a broken record, was an earnings report and the Management ALSO raising guidance on upcoming earnings. Yesterday, after the close of trading, COO announced Third Quarter 2004 results. Revenue came in at $129.1 million, a 16% increase when results are adjusted for currency fluctuations. Earnings came in at $.58/share, up 21% from the prior year. In addition, COO raised fiscal 2004 revenue guidance to $488-$493 million and EPS of $2.59-$2.61, up from prior revenue guidance of $483-$493 million and earnings of $2.55-$2.58/share. Although not a large increase in guidance, the fact that guidance was being raised was enough to spark a run on the stock.
 How about longer-term? If we look at a "5-Yr Restated" financials on Morningstar.com, we can see that revenue growth has been steady, increasing from $168.2 million in 1999 to $451.7 million in the Trailing Twelve Months (TTM).
Earnings per share have also increased EACH AND EVERY YEAR from $.88/share in 1999 to $2.40 in the TTM. In addition, COO has been paying a dividend at least since 1999 when it was $.02/share and has been intermittently been raising it to the $.06/share in the TTM.
How about Free Cash Flow? This also looks nice with $9 million in free cash flow reported in 2001, increasing to $47 million in the TTM.
And how about the Balance sheet? According to Morningstar numbers, this looks very nice with $23.1 million in cash and $231.1 million in other current assets, enough to cover the $113.5 million in current liabilities AS WELL AS pay off most of the Long-term liabilities from the Current Assets alone.
And valuation? Looking at Yahoo "Key Statistics" , we can get most of this information. This is a mid cap stock (there are many definitions, but if we use under $10 billion down to about $2 billion, this fits in at $2.07 Billion in capitalization.) The trailing p/e isn't bad at 26.39 and the forward p/e (fye 31-Oct-05) is even nicer at 20.83. The PEG isn't bad at 1.13, and the price/sales is a bit richer at 4.19.
Yahoo reports 32.67 million shares outstanding with 31.40 million of them that float. Of these shares, 2.31 million shares are out short, a bit of a heavy short interest representing 3.794 trading days or 7.35% of the float. (I use 3.0 trading days arbitrarily as a cut-off to ascertain whether I think the # of shares out short is "significant".)
The stock dividend which I have already discussed is $.06/share or 0.10%. The last stock split was a 2:1 in November, 2002.
And what do the 'Technicals' look like? If we look at a Point and Figure chart from Stockcharts.com:
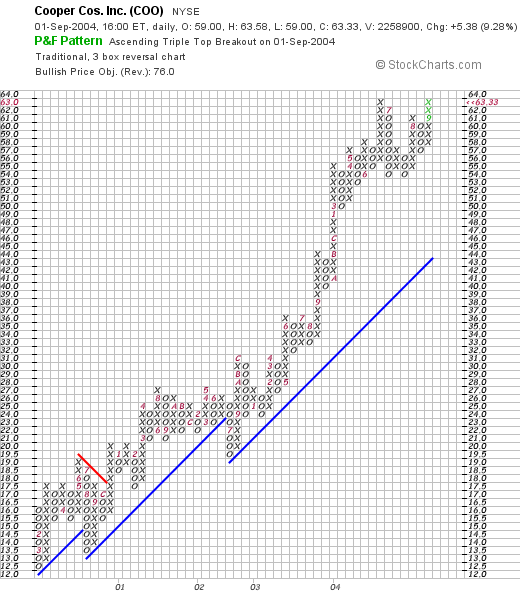
we can see what in my opinion is a BEAUTIFUL stock graph from at least as far back as 2000 when it was trading at $12.50 to its current level of $63 range. If anything, the stock price looks a wee bit ahead of itself.
So what do I think. Hey I really like this stock a lot. In fact I OWN shares in this stock. The recent earnings report was strong, they just RAISED guidance for the rest of the year, the steady growth in revenue, earnings and dividends is very impressive. The free cash flow is positive and growing and the balance sheet looks clean. The valuation isn't really bad, there are a bit of a heavy # of shares already out SHORT....and yes, the graph looks strong.
Thanks again for stopping by! Again if you have any questions, please feel free to email me at bobsadviceforstocks@lycos.com.
Bob