 Hello Friends! Thanks again for stopping by and visiting my blog, Stock Picks Bob's Advice. As always please remember that I am an amateur investor, so please consult with your professional investment advisors prior to making any investment decisions based on information on this website!
 Looking through the list of top % gainers on the NASDAQ today, I came across ANSYS (ANSS), which closed at $37.03, up $2.63 or 7.65% on the day. I do not own any shares nor do I have any options on ANSS.
What drove the stock higher today was an excellent 4th quarter 2004 earnings results. For the quarter ended December 31, 2004, total revenue came in at $38.9 million, up from $33.3 million the prior year. Diluted earnings per share came in at $.36 (or $.33 if adjusted for a one time tax benefit), compared with $.22/diluted share last year during the fourth quarter of 2003.
 How about longer-term? Looking at a "5-Yr Restated" financials on Morningstar.com, we can see a nice 'ramp-up' of revenue from $63.1 million in 1999 to $128.9 million in the trailing twelve months (TTM). Earnings during this period have also fairly consistently grown from $.44/share in 1999 to $.90/share in the TTM.
Free cash flow has been solid and improving recently. This was $21 million in 2001, and has grown to $45 million in the TTM.
Balance-sheet-wise, ANSS looks good with $124.3 million in cash alone, adequate to cover the $54.2 million in current liabilities. There are NO long-term liabilities according to Morningstar.com. In addition, ANSS is reported to have an additional $33.6 million in other current assets.
How about valuation? Looking at "Key Statistics" on ANSS from Yahoo, we can see that this company is a mid-cap market cap of $1.15 billion. The trailing p/e is a bit rich at 41.10, the forward p/e is 32.77 and the PEG (5 yr expected) is also a bit rich at 2.25. The price/sales is 8.27.
Yahoo reports 30.97 million shares outstanding with 29.40 million of them that float. Of these 744,000 are out short as of 1/10/05. This represents 2.53% of the float or a mnodest 3.477 trading days of volume.
No cash dividend are reported. The stock did split recently 2:1 on 10/5/04.
How about technicals?

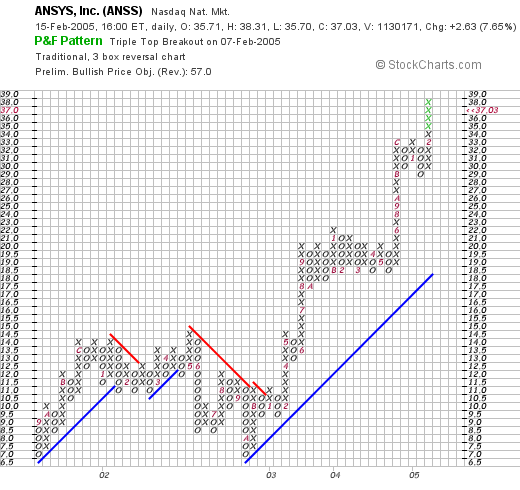
Taking a look at a Point & Figure Chart from Stockcharts.com, we can see a fairly pretty and steady advance in stock price. The stock did pull back after January, 2002, when it dropped from $14.00 to a low of $7.00 in October, 2002. However, since that October, 2002, date, the stock has been rising steadily and strongly to its current level of $37.03.
So what do I think? Everything appears to be in line, the recent earnings, the 5 year record, the free cash flow, and the balance sheet. The chart also looks very nice. I think the valuation is a little bit of concern to me....but will withhold judgement on that question for now. It has the characteristics that I like to see in a stock: good recent quarterly growth, steady growth in earnings, growing free cash flow, and a good balance sheet. I would prefer a cheaper valuation...but then again you cannot always have everything!
Now, if I only had a signal from my own trading account, and I might be buying a few shares!
Thanks so much again for stopping by! If you have any questions or comments, please feel free to email me at bobsadviceforstocks@lycos.com.
Bob


