


 Hello Friends! Thanks so much for stopping by and visiting my blog, Stock Picks Bob's Advice. As always, please remember that I am an amateur investor, so please consult with your professional investment advisors prior to making any investment decisions based on information on this website.
 I have had a couple of letters recently asking me again how I pick stocks...and bemoaning my recent sparsity of new stock picks. So today I dedicated myself at finding a new stock pick and hopefully using that selection to demonstrate the how and why of my selection methods. I hope that this is helpful for you.
After many years of buying stocks, I came across the observation that it may be possible to make money on a stock investment by purchasing stocks on a day that they are making a large move in an upward (!) direction. Sort of banking on a continued momentum in stock price after a single day of outperforming most other issues. But this is only my first screen!
There are a lot of places to look for large percentage gainers in the market. I have taken to using the Money.cnn.com site but I have also utilized the lists on USA Today as well. Frankly, any source that provides a list will suffice.
For this example, I found a candidate for inclusion today on the money.cnn.com list of top % gainers on the NYSE. I have lately tried to stay with stocks that are near $10 or higher, as the lower-priced stocks tend to be a bit more volatile and I end up selling them quickly on their pull-backs.
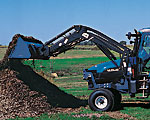 Alamo Group (ALG) made the list today, and as I am writing is trading at $24.80/share, up $.95 or 3.98% on the day. I do not own any shares nor do I hold any options on this equity. When I first saw the name, in fact, I thought it was the rental car company (see what I know!), and was surprised to find that it was an agricultural implements company. In fact, turning to the Yahoo "Profile" on Alamo Group, we can see that this company "...is a manufacturer of equipment for right-of-way maintenance and agriculture such as tractor mounted mowing and other vegetation maintenance equipment, street sweepers, agricultural implements and related after-market parts and services."
 My next criterion to assess a stock investment is to check the latest quarter's results. Basically, I am just looking for a quarter in which both revenue and earnings are growing. My stock market selections are basically what I would call high "quality" stocks. We can go back and forth on what the definition of "quality" really is. In my opinion, quality is about consistency of corporate performance. I want to fill my portfolio with consistently growing companies...both growing their earnings as well as their revenues!
Usually I can find this information right on Yahoo under "headlines". However, Alamo Group is a little harder to find...I would rather read a report of earnings than struggle with a 10-Q. I usually go over to the homepage of the company and look for their news or earnings releases. That is where I found the latest quarterly report for ALG.
On November 4, 2004, Alamo Group (ALG) announced their 3rd quarter 2004 results. Net sales for the quarter ended September 30, 2004, increased 24% to $88.0 million from $70.7 million the same quarter the prior year. Net income was $4.2 million or $.43/diluted share, a 59% increase over the prior year's $2.6 million or $.27/diluted share. The report does note that results were affected by an acquisition of Rousseau Holdings, however, excluding the effect of that acquisition, revenue was still up 17% and earnings were still up 65% over the prior year.
 Well the latest quarter was very nice! However, how about a longer-term view on this company? Have they shown the ability to continue this growth? For that I turn to Morningstar.com, and fortunately, the information that I use is still available without charge on their website.
 The information I like to review is the "5-Yr Restated" financials on Morningstar.com on ALG. First, looking at the series of bar-graphs we can see that revenue has increased extremely steadily from $176.6 million in 1999 to $325.0 million in the trailing twelve months (TTM).
Next, the earnings, which have been a bit more erratic, have improved from $.63/share in 1999 to $1.30 in the TTM. In fact, they have steadily improved after dipping to $.65/share in 2002.
How about "Free Cash Flow"? This is found under the earnings chart, and shows that ALG had $1 million in free cash flow in 2001 and although erratic, stayed positive, and in the TTM had $14 million in free cash flow. Not being an accountant, in my simple understanding the free cash flow is the actual cash that is being created or consumed by the entity. In the old dot-com era, these little firms would be loaded with cash and talk about their "burn rate" which I assume was their amount of negative free cash flow. Probably more complex than that, but it works for me!
 Finally on Morningstar.com, I like to check a basic balance sheet. What do I look for? Simply put, I would much rather see assets outweigh liabilities. And more importantly, current assets especially cash, outweighing current liabilities. For ALG, we can see that they have $7.1 million in cash and $153.7 million in other current assets, which is plenty to cover both the $51.8 million in current liabilities AND the $19.7 million in long-term liabilities more than two times over. This looks just fine to me!
My next stop is to look and see if I can get some "valuation" issues defined. My approach tends to be eclectic, that is, I do not want to limit myself to momentum, valuation, or technical approaches...rather why not try to utilize all of these perspectives to try to identify a "quality" investment?
For this, I refer back to Yahoo "Key Statistics" on ALG. Here we can discover that this is really a small company with a market capitalization of only $241.50 million. The trailing p/e is reasonable at 19.06. There aren't any forward p/e's, I assume the company is too small to have many analysts following, but the price/sales at 0.71 is also cheap being under 1.0.
According to Yahoo there are only 9.74 million shares outstanding with only 2.70 million of them that float. There are only 12,000 shares out short as of 2/8/05, representing 0.44% of the already small float or only 0.3 trading days of volume to cover. I arbitrarily use 3.0 trading days as a cut-off for a significant level of short interest. Above that is bullish in my humble opinion.
Yahoo also shows that the company pays a small dividend of $.24/share yielding 1.01%. No stock splits are reported. While I am not requiring stocks to have a dividend, the presence of a dividend just makes that investment that more attractive!
What about "technicals"? That is, how does the chart look? Lately, I have been using "point and figure" charts which show the "battle" between the forces driving a stock higher (columns of x's), and forces driving a stock lower (columns of o's). Again, a nice free service is Stockcharts and here is the "Point & Figure" chart on ALG:
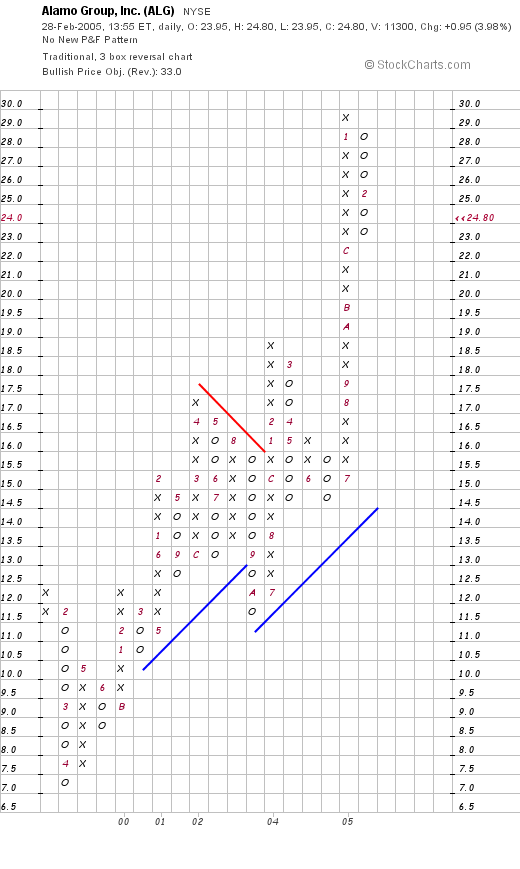
Bottom line, this is a gorgeous graph which goes all the way back to April, 1999, when the stock price bottomed out at around $7.00 and shows a steady appreciation in stock price to the current levels around $24.80. The stock basically looks great if not a bit ahead of itself.
So what do I think? Putting all of this together I find a series of "passing marks" for Alamo Group (ALG) in my evaluation. What were they? In summary, a nice price move today, a solid earnings report, a very pretty five year picture of earnings and revenue growth (with earnings being a little less consistent), solid free cash flow, a solid balance sheet, a dividend, reasonable valuation, and a nice chart!
I am not buying any shares because I am simply not in the market to buy anything. That is, I wait for a buy signal from my own portfolio which if I were selling a portion today at a gain, I probably would be putting in an order for some shares of this stock. On the downside, the company is very small and may be subject to volatility. But thus far, the stock has been performing quite steadily in an upward direction!
Thanks again for stopping by! I hope that my explanation was not too detailed...and that you bore with me. If you have any questions, comments, or words of encouragement, please feel free to email me at bobsadviceforstocks@lycos.com.
Bob