Stock Picks Bob's Advice
Thursday, 28 October 2004
October 28, 2004 Cabot Microelectronics (CCMP)

Hello Friends! Just came back from a week in New Orleans. This beautiful photo is courtesy of the State of Louisiana Tourism Office, and it is certainly worth a trip to see the original in person! After being a regular blogger for the last 18 months, I really do go through a bit of withdrawal as I stay away from the 'net. I found myself going to internet cafes to catch up with what was going on...I really need to get myself a good laptop with a nice WiFi port. As always, please remember that I am an amateur investor so please do your own due diligence on all stocks discussed and consult with your professional investment advisors before making any decisions to make sure that all investments are appropriate, timely, and likely to be profitable for you! If you have any questions or comments, please feel free to email me at bobsadviceforstocks@lycos.com.

Anyway, I am back in business! So, while scanning the
list of top % gainers on the NASDAQ this afternoon, I came across Cabot Microelectronics (CCMP) which closed at $35.70, up 13.15% on the day. I do not own any shares of Cabot, nor do I own any options. According to the
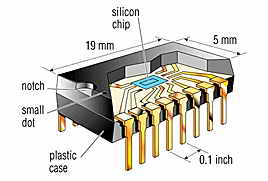
Yahoo "Profile", CCMP "...is a supplier of high-performance polishing slurries used in the manufacture of integrated circuit (IC) devices within the semiconductor industry, in a process called chemical mechanical planarization (CMP)." O.K., I am not a wiz on this stuff, so it appears that this company's fortune is tied to the chip market. And they are doing just fine!
What drove the stock higher today, was the
4th quarter and year-end earnings announcement. For the quarter ended September 30, 2004, revenue came in at $82.7 million, up 7.5% sequentially from $76.9 million in the prior quarter and up 21.8% from $67.9 million the prior year same quarter. Net income for the quarter was $13.2 million, up 7.5% from $12.2 million the prior quarter and up 36.5% from the $9.6 million the prior year. On a per share diluted basis, this came in at $.53/share this quarter, up sequentially from $.49/share the prior quarter and up from $.39/share the prior year. For the year, revenues were up 23.0% to $309.4 million, and diluted earnings per share came in at $1.88, up 22.9% from the $1.53 reported in fiscal 2003. These look like solid results to me!
How about longer-term? Looking at
a Morningstar.com "5-Yr Restated" financials, we can see the steady growth in revenue from $98.7 million in 1999 to the $294.6 million in the trailing twelve months (TTM). (as the above paragraph notes, as of today the TTM came in actually at $309.4 million!). Earnings have been fairly flat with $1.72 reported in 2001, and $1.88 reported in 2004. Free cash flow is a bit nicer with $27 million in free cash flow increasing to $46 million in the trailing twelve months.
Also attractive, the balance sheet per Morningstar looks solid to me with $155.9 million in cash, more than enough to cover both the $28.4 million in current liabilities and the modest $16.1 million in long-term liabilities more than 4 times over. In addition, CCMP is reported to have an additional $69.8 million in other current assets. Looks nice to me!
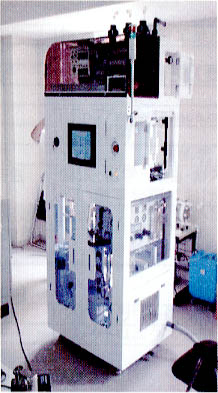
(The picture at right is a "Chemical Mechanical Polishing (CMP) Slurry Feeder Equipment made by Takada Corporation in Japan.)
How about valuation questions? Looking at
"Key Statistics" on CCMP from Yahoo, we can see that this is small cap corporation with a market capitalization of only $885.1 million. The trailing p/e isn't bad at 20.62, with a forward p/e of 18.03 (fye 30-Sep-05). With the current fast growth rate, the PEG comes in at an attractive 0.69.
Yahoo reports 24.79 million shares outstanding with 24.70 million of them that float. As of 10/8/04, there were 6.67 million shares out short, representing 27.00% of the float, or 8.164 trading days. This is certainly significant to me, both in the large % of the float out short as well as the greater than 3 days of trading volume. With the great results reported today, we could be seeing signs of a "short squeeze".
No cash dividend is paid, and no stock dividend is reported on Yahoo.com.
How about technicals? If we look at
Stockcharts.com for a
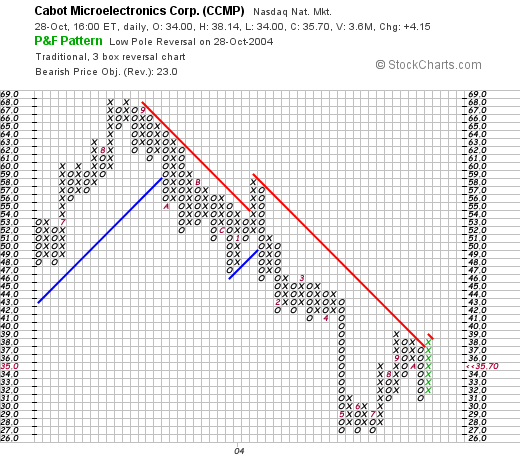
"Point & Figure" chart on CCMP, we can see that this stock has been trading LOWER since breaking through a support level at $56 in September, 2003. Recently it has broken through a resistance level at around $37, to possibly change its current price direction. This is not an overwhelming picture of strength technically, but the stock has certainly NOT gotten ahead of itself!
So what do I think? Well, the recent earnings and revenue report looks excellent, the company HAS been growing nicely the past five years, and the earnings while not growing steadily the past five years HAVE been growing nicely the past couple of years! The company is generating lots of cash and is quite solvent and the valuation is nice. It is just that the Industry the company has been in has been fairly week the past year, and this is holding back the stock price imho. Certainly valuation is also nice now with a PEG under 1.0. Personally, I am not buying this stock because I haven't sold any of my holdings at a gain...."allowing" me to add another position. However, I certainly would be game to pick up some shares if the timing WAS right!
Thanks again for stopping by! If you have any questions, comments, or words of encouragement, please feel free to email me at bobsadviceforstocks@lycos.com. I am a bit behind in responding to the mail, so bear with me, I shall be trying to post a couple of the notes right here on the blog!
And don't forget to vote on Tuesday!
Bob
Posted by bobsadviceforstocks at 1:48 PM CDT
|
Post Comment |
Permalink
Updated: Thursday, 28 October 2004 7:04 PM CDT
Monday, 18 October 2004
October 18, 2004 Diagnostic Products (DP)
Hello Friends! Thanks so much for stopping by. It would not be fun for me to write if there wasn't a reader that was reading! I hope that the simple words I send out into cyberspace are somehow helpful to you. Please remember that I am an amateur investor, so please consult with your professional investment advisors to make sure that all investments discussed are appropriate, timely, and likely to be profitable for you. And if you have any comments, questions, or words of encouragement, please feel free to email me at bobsadviceforstocks@lycos.com and I will try to get back to you either directly IN the blog, or by email!

Since so many people reading this blog are new to my methods let me review today's pick and then share with you my rationale. Generally, my first step in identifying a stock of interest is to scan the
lists of "Top % Gainers". Lately, my bias is to avoid stocks under $10 and this narrows my list further. I also try to avoid re-reviewing stocks that I have listed already in
Stock Picks Bob's Advice. Skimming through the list, I noted that the fist stock on the list is an old favorite of mine, Select Medical (SEM) that I have reviewed here in the past. They are being taken private by a management leveraged buy-out, so we will soon be unable to follow that company! A little further down the list I came across Diagnostic Products (DP) which I have not previously reviewed. (If you can believe it, I have looked at SO MANY stocks that I have to look through my own lists of stocks reviewed to make sure!)
Diagnostic Products (DP) is having a great day, trading as I write at $42.18, up $1.90 or 4.72% on the day. I do not own any shares of this stock nor do I have any options. According to the
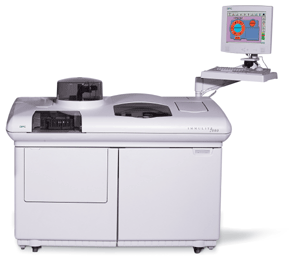
Yahoo "Profile", DP "...develops, manufactures and markets immunodiagnostic systems and immunochemistry kits used in hospital, reference and physicians' office laboratories and in veterinary, forensic and research facilities."
What is my next step? One thing I have learned from being a fan of the CANSLIM method proposed by William O'Neil, is to check the latest quarter results. I do not follow O'Neil's technique closely in evaluating stocks, but have learned much from reading the IBD and some of his writing. I look for significant growth in both revenue and earnings in the latest result. If that isn't present, I look no further!
On July 23, 2004, Diagnostic Products
announced 2nd quarter 2004 results. Sales for the quarter were $110.5 million, a 15% increase over the same quarter last year, and earnings were $18.6 million, or $.62/diluted share, a 12% increase from the $16.6 million or $.56/diluted share in the second quarter of 2003. In my opinion, this was a solid earnings/revenue report from the company, and when I read it, I was still interested!
So what is my NEXT step? Well for me, I am looking for what I call "quality" companies. O.K., so you want to know what I call "quality". For me, consistency of results and a solid financial performance counts. Let me explain by discussing DP's "quality".
For this, I turn to the
"5-Yr Restated" financials on Morningstar.com. The first thing on this sheet I like to see is a steady improvement in revenue over the past five years as demonstrated by progressively larger blue bars in the top graph. Here we see that revenue was $216.2 million in 1999, and then increased sequentially to $415.1 million in the trailing twelve months (TTM). This looks great!
Next, earnings. Again, this is a BEAUTIFUL report, showing earnings of $.75/share in 1999, increasing EACH AND EVERY YEAR to $2.23 in the TTM. Not too many companies have both--consistent revenue AND earnings growth! As an added treat, I look at dividends. Well the company is reporting $.24/share since 1999. Ideally, they might be INCREASING their dividend, but while you can't always get everything, no harm in inquiring!
A good Optometrist friend of mine got me thinking about Free Cash Flow; in fact he showed me how to look at this on Morningstar! When the tech bubble was running its course, I don't know if you remember but I recall lots of discussions about the "burn rate". This was the rate at which start-ups were burning up their available cash. Needless to say, CREATION of cash is more important in picking a stock than the DESTRUCTION of cash reserves!
For DP, this is found under the main group of numbers in the section called Cash Flow $Mil". Here we see in the bottom of each column, that in 2001, DP was $6 million free cash flow positive, this has improved to $25 million in 2002 and 2003 and up to $37 million in the TTM. Thus, not only is this company CREATING free cash, it is creating increasing amounts of free cash each year! I like this information a lot!
Finally, a quick look at the balance sheet. Now, I have said ZILLIONS of times, that I am not a professional investment person, so my understanding is based on simple examination of obvious numbers. I hope that is clear. What I like to see is lots of assets and little liabilities. Furthermore, I am concerned about current stuff more than long-term stuff. In other words, for DP, here we see that the company, according to Morningstar, has $65.2 million in cash AND $200.6 milllion in OTHER current assets. This is balanced against $81.6 million (I believe this 3:1 ratio is referred to as the current ratio); and shows a solid balance sheet. In addition, their long-term liabilities is what I would call a 'measly' $9.8 million. This ALSO looks great!
Finally, a little examination of 'valuation'. This information I usually retrieve from
Yahoo "Key Statistics". Here we can get some 'parameters' of this stock. For instance, this is a "mid cap" stock with a market capitalization of $1.23 Billion. The trailing p/e is 18.90. (For me anything under 20 is usually reasonable). Furthermore, estimates for future earnings (fye 31-Dec-05) results in a future p/e or forward p/e of only 15.67. From this information we can get the PEG raio, which is a ratio of P/E to the Growth rate (Thus PEG). For DP, this comes in at 0.99, suggesting that not only are the numbers we have reviewed solid, but the valuation is reasonable! (This is sort of like a restaurant with great food at a great price...excuse the comparison but I am finishing up lunch as I write :)).
Yahoo reports 29.11 million shares outstanding with 21.30 million that float. Of these, 1.01 million are out short representing 4.75% of the float or 13.849 trading days of volume. That means, since it is more than my 3 day cut-off, that there are a lot of BORROWED shares that have been pre-sold, and there will be a lot of buying pressure if the stock moves higher from people scrambling to cover their short sales. In other words, this is in general a good number to see! (Although it does concern me that so many people are negative on this stock!)
As I reported, this sheet also shows the small $.28/share dividend (I guess they ARE raising it) yielding 0.70%. For completeness, it is interesting to note that the last stock split was in June, 1989, about 15 (!) years ago when they split 2:1. Maybe it is time for another split?
Finally, I like to look at what I call "technicals". For me, this is looking at a "Point & Figure" chart from
Stockcharts.com:
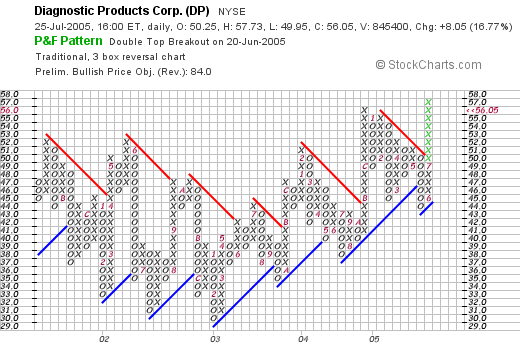
If anything, this is a bit of a less-strong factor in this stock pick. The stock was moving strongly higher since late 2000, when it was trading at around $19.50. The price peaked and has had three episodes of bouncing against a high at around $52 and then turning lower, first in October, 2001, then May, 2002, and finally in February, 2004. I would like to see this stock trade strongly higher over $45 to break through its current resistance level before being confident about its upward course. But then again, I am not a pro at looking at stocks so I have it right here for you to review.
So what do I think? Well the stock is moving higher today, has a great recent earnings report, the Morningstar.com "5-Yr" looks solid with steady revenue and earnings growth, the free cash flow is positive and growing and they even pay a dividend. The balance sheet also looks nice with lots of assets and cash and only a small amount of current debt with very little long-term debt. In addition, valuation is reasonable, with a p/e in the teens, a PEG under 1.0, and lots of shares out short!
Why don't I buy some shares, you ask? Well, my own trading portfolio doesn't let me buy another position until I sell some of one of the ones I own at a gain. I built this into my trading methods to prevent me from buying into a declining market. So far it is working even though I do like this stock a lot!
Thanks so much for stopping by! If you have any questions or comments, please feel free to email me at bobsadviceforstocks@lycos.com and come visit again!
Bob
Sunday, 17 October 2004
"Looking Back One Year" A review of stock picks from the week of September 8, 2003

Hello Friends! It is late Sunday, and I really got to get some shut-eye, but before I do, I wanted to post my "Weekend Review". It is one of the best ways I know to restore some humility to my sometimes inflated ego! Now of course, my reviews assume a buy and hold strategy, and I personally recommend selling if it drops 8%....so the performance of the picks isn't EXACTLY like it would be if it were in a managed account. But then again, there is not arguing witha stock price!
As always, please remember that I am an amateur investor so please do your own due diligence prior to making any decisions about any of these stocks and please consult with your professional investment advisors to make sure your ideas are timely, appropriate, and likely to be profitable for you! If you have any comments, questions, or words of encouragement, please feel free to email me at bobsadviceforstocks@lycos.com . I should warn you, that I may be answering your comments or questions right here in the blog!

On September 8, 2002, I
posted Merit Medical (MMSI) on
Stock Picks Bob's Advice at a price of $23.10. MMSI had a 4:3 split in December, 2003, reducing our stock price to $17.325. MMSI closed on 10/15/04 at $11.23 for a loss of $(6.10) or (35.2)%. Not a very auspicious start to the week!
On July 22, 2004, MMSI
announced 2nd quarter 2004 results. Revenue came in at $38.9 million, up from $34.6 million last year. Net income was $5.1 million compared to $4.2 million the prior year, and on a per share basis, this came in at $.18/share vs $.16/share last year. However, a few days ago, Merit
pre-announced 3rd quarter results which were below expectations but still higher than last year. Revenue is anticipated to come in about $35-$36 million (down from the prior quarter but ahead of last year), and earnings about $.14-$.15/share. Management attributed this to "...reduced demand for Merit's products during the third quarter." Not exactly encouraging and the stock price has reflected this outlook!
On September 8, 2003, I
wrote-up Hi-Tech Pharmacal (HITK) at $28.75. HITK closed at $16.59 on 10/15/04, for a loss of $(12.16) or (42.3)%.
On September 8, 2004, HITK
announced quarterly earnings. Net sales for the quarter ended July 31, 2004, were $12.1 million, a 31% increase in the prior year's sales of $9.3 million. Net income, however, came in at $869,000, down from $953,000, last year, a decrease of 9%. Earnings per diluted share came in at $.10/share, down 9% from $.11/share last year as well. Again, this shows the importance of INCREASING earnings, and the stock price reflects this report.

I
posted Scientific Games (SGMS) on this blog on 9/12/03 at $11.55. SGMS closed on 10/15/04 at $19.36, for a gain of $7.81, or 67.6%.
On July 28, 2004, SGMS
announced 2nd quarter 2004 results. Revenues jumped 38% to $178.1 million from $128.8 million in the same quarter last year. Net income (before preferred stock dividend) jumped 55% to $19.5 million or $.21/share compared to $12.6 million or $.14/share the prior year. These were great results!

Finally, on 9/12/04, I posted Hanger Orthopedig Group (HGR) at $14.75. Hanger closed at $5.48 on 10/15/04 for a loss of $(9.27) or (62.8)% over the past year.
On August 16, 2004, HGR
announced 2nd quarter results. Unfortunately, they have had accounting irregularities that are being cleared up and have taken the "stuffing" out of this stock price. For the quarter ended June 30, 2004, net sales increased by $6.2 million, or 4.5%, to $145.1 million from $138.9 million last year. Unfortunately, net income DECREASED to $2.2 million or $.10/diluted share from last year's $7.8 million or $.34/diluted share. There are plenty of footnotes on this report, and this is not something that results in stock price appreciation to say the least!
Anyhow, I could have just skipped THAT week. Why don't we review our TASER pick again??? lol. But seriously, that was a rough week with three losing issues and one strong gain. The average performance for the week was a loss of (18.2)%. Nothing to write home about!
Please remember that this illustrates the risk of picking "momentum" stocks! However, if we had cut our losses at near 8% on the three losers, and had stayed with our one gainer, well then we wouldn't really have done so badly would we?
If you have any comments, questions, or words of encouragement, please feel free to write me at bobsadviceforstocks@lycos.com . Have a great week investing everyone!
Bob
Friday, 15 October 2004
October 15, 2004 Dorel Industries "B" (DIIB)

Hello Friends! I am just getting geared up around here to push some voter interest! I cannot tell you how important I think it is that you all make sure you get your votes counted. It REALLY is a different sort of election!
As always, please remember that I am an amateur investor so please always consult with your professional investment advisors to make sure that all investments discussed are appropriate, timely, and likely to be profitable for you! If you have any questions or comments, feel free to email me at bobsadviceforstocks@lycos.com .

I was scanning through the lists of top % gainers today and came across Dorel Inds "B" (DIIB). I do NOT own any shares or options in this company. DIIB is having a great day today trading as I write at $28.24, up $2.13 or 8.16% on the day. According to the
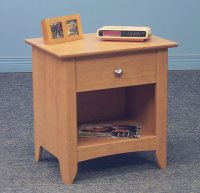
Yahoo "Profile" on DIIB, Dorel "...specializes in two market segments: juvenile products and home furnishings. Dorel's product offering includes juvenile products such as infant car seats, strollers, high chairs, toddler beds, cribs, infant health and safety aids, play-yards and juvenile accessories, and home furnishings such as a variety of ready-to-assemble (RTA) furniture for home and office use...." Among the brands that I recognized when I went to the
Dorel website included Schwinn bicycles and Cosco car-seats and strollers.
On August 4, 2004, DIIB
reported 2nd quarter 2004 results. For the quarter ended June 30, 2004, revenues came in at $403.5 million this quarter, compared to $264.7 million last year. Net earnings were up 11.3% to $18.1 million or $.55/share compared with $16.3 million or $.50/share last year. These are fairly solid results!
How about longer-term? Checking the
Morningstar.com "5-Yr Restated" financials, we can see that revenue has been increasing steadily with $.6 billion in revenue in 1999, increasing to $1.2 billion in the trailing twelve months (TTM).
Earnings dipped from $1.36 to $.61 between 1999 and 2000, however, since then, earnings have been steadily improving with $2.36 reported in 2003. Free cash flow has also been solidly positive with $36 million reported in 2002, increasing to $111 million in 2002, with $76 millin reported in 2003.
The balance sheet is solid if not spectacular with $13.9 million in cash and $445 million in other current assets as opposed to the $263.7 million in current liabilities and the $352.0 million in long-term debt.
What about valuation? Taking a look at
"Key Statistics" from Yahoo, we can see that this is a mid-cap stock with a market capitalization of $922 million. The trailing p/e is cheap at 11.93 and the forward p/e is even nicer at 8.26. Even the Price/Sales ratio is reasonable at 0.60 and the stock is elling at 1.63 times "book".
Yahoo reports 32.76 million shares outstanding with 32.50 million of them that float. There are currently 513,000 shares out short representing 1.58% of the float. However, due to the low daily trading volume, the short ratio is an astronomic 128.25 trading days of short volume. This would certainly be 'ripe' for a squeeze!
Yahoo does not show any cash dividend and the last split reported was a 2:1 in August, 1998.
How about "technicals"? Using
Stockcharts.com, we can review a "Point & Figure" chart on Dorel:
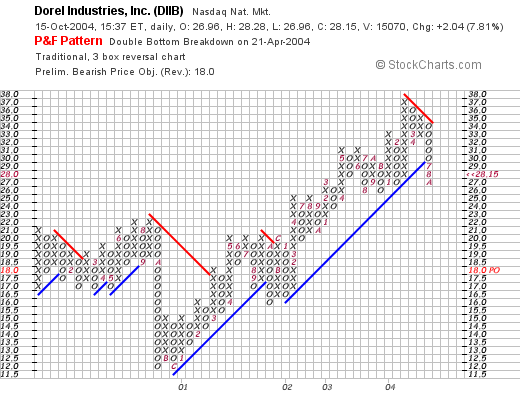
Here we can see that this stock broke down in price to about $11.50 in late 2000, Since that time it has successfully been trading higher to its current level at around $28. Looks nice to me!
 So what do I think? Well, it IS a Canadian company, so that gives it a little bit of a currency spin...but that really shouldn't be a problem. I like and am familiar with their brands (a Peter Lynch moment!), the latest quarter looks nice, the last five years has been steadily improving, free cash flow is solid, the balance sheet is good, valuation is excellent and the chart looks nice! What is there NOT to like? lol. Now if I just had some money to invest! As you may know, I like to wait for a sale of one of my pre-existing positions prior to adding funds to establish a new position in this portfolio!
Thanks again for stopping by! If you have any questions, comments, or words of encouragement, please feel free to email me at bobsadviceforstocks@lycos.com
Bob
Monday, 11 October 2004
"Charles Kirk responds"
Hello Friends! I am afraid I may be getting some notoriety out here in cyberspace! A few days ago I posted a letter about Stock Picks which mentioned The Kirk Report in a less than flattering fashion. This was not my opinion, and I apologize publicly to Mr. Kirk, a fellow blogger, who works hard at providing a quality product to the Internet Community. In fact, I have provided a link to The Kirk Report on each of my Blog Pages because I felt it was content that was worth reading!
Mr. Kirk writes:
Bob,
Thank you for posting the letter you received about my website at your
blog. A few dozen readers who apparently saw that post have contacted
me to say how much they appreciate my website and have found it very
useful despite what you printed.
Sincerely,
Charles E. Kirk, The Kirk Report
http://www.kirkreport.com
I very much hope this clears the air on this question. Thank you Mr. Kirk for taking the time to write! I hope that you come back often and visit, and I hope that my readers also visit your blog and take advantage of what your site has to offer!
Bob
Sunday, 10 October 2004
"Looking Back One Year" A review of stock picks from the week of September 1, 2003

Hello Friends! It has been a couple of weeks since I looked back at some past picks. I don't know about you, but my life sure gets busier and busier! O.K. so that ISN'T a very good excuse...well anyway, I am glad I am back on track for now. What I do in these reviews, if you are new to this website, is try to assess how selections that I posted here on
Stock Picks Bob's Advice have performed about a year later. I like to look at selections at a week at a time. This week, I am up to the week of September 1, 2003, about 13 months ago. As always, please remember that I am an amateur investor, so please consult with your professional investment advisors prior to making any investment decisions based on information on this website. And as I sometimes like to add, past performance, both good and bad, is no guarantee of future performance!

The first stock to be posted that week was Sohu.com, which I
posted on this blog on September 2, 2003, at a price of $33.47. This was a loss of $(16.01) or (47.8)%. NOT a very exciting selection. Please remember, that in actual practice, I utilize an 8% stop loss on all of my actual investments, but for the sake of this review, I assume a "buy and hold" strategy.
On July 28, 2004, SOHU
reported 2nd quarter 2004 results. They reported that revenues jumped 41% from the prior year to $27.3 million. Net income for the quarter came in $9.9 million or $.25/share compared with $7.5 million or $.19/share the prior year. In the same announcement, SOHU cut guidance to $28.1 to $29.1 million, with net income between $.23 and $.25/diluted share. They are thus predicting a sequential drop in net income. The "street" didn't like this report and the stock corrected.

On September 3, 2003, I
posted Take-Two Interactive (TTWO) on Stock Picks at a price of $35.75. On October 8, 2004, TTWO closed at $34.18, for a loss of $(1.57) or (4.4)%.
On September 9, 2004, TTWO
announced 3rd quarter 2004 results. For the third quarter ended July 31, 2004, sales grew 6% to $160.9 million from $152.1 million the prior year. However, the company lost $(14.4) million or $(.32)/share compared with a profit of $5.7 million or $.13/share in the year-ago period. This even exceeded First call estimates for a loss of $(.30)/share. Not exactly stellar results!

On September 4, 2003, I
posted Interpore International (BONZ) on Stock Picks at $17.50. Interpore was acquired by Biomet (BMET) on June 18, 2004, at a price of $14.50/share. This represented a loss of $(3.00)/share or (17.1)%.
So how did we do that week? Well in one word, AWFUL. This is one of the few weeks I can recall when ALL of the stock picks came in with losses. For the three stocks the average loss was (23.1)%. This only shows you the importance of having a loss limit in your strategy. As I have said many a time, I hold my stocks to an 8% loss and then out they go!
Thanks so much for stopping by! If you have any questions, comments, or words of encouragement, please feel free to email me at bobsadviceforstocks@lycos.com .
Bob
Posted by bobsadviceforstocks at 5:44 PM CDT
|
Post Comment |
Permalink
Updated: Sunday, 10 October 2004 9:52 PM CDT
Thursday, 7 October 2004
A Reader Writes, "...I think you do a great job with your blog."

Hello Friends! I really like getting mail, and Jeff was kind enough to write me this evening. (Ever since I was a kid, I have always liked getting regular mail....and now, with the blog, I am just as tickled!) (I enclosed a copy of "Refrigerator Pies" by Wayne Thiebaud, a wonderful artist I admire...wouldn't it be fun to share some art here as well?)
He wrote:
I'm a semi-professional too. And, I think you do a great job with your blog. I have been reading it for about a week. You do a great job of presenting good information on companies. You're fair and honest about it. In comparison to the Kirk Report. He has some good ideas. But, he seems to be trying to make money on the market instead of in the market, with donations,without legitimate credentials. Anyway, I think you do a great service. I hope you will keep it up..Now I don't want to make any comments about the
The Kirk Report, as he is a fellow blogger, but I appreciate the kind words that Jeff has written. (I really should warn readers that I may post their letters but I don't want to discourage them from writing!)
I will try hard to hang in there and write away....writing actually gets easier over time, and I hope that my entries are more informative as I go on. I am learning a lot right with you as well!
Thanks again for stopping by Jeff, and please keep those cards and letters coming...at bobsadviceforstocks@lycos.com .
Bob
October 7, 2004 Parlux Fragrances (PARL)

Hello Friends! I felt like I needed to liven up the website...so here it is a portrait of Christopher Columbus to commemorate the upcoming Columbus Day Holiday on October 12th. Hard to believe that it has been 500 years since Columbus "discovered" America. Seems like yesterday!
Thanks so much for stopping by and visiting my blog,
Stock Picks Bob's Advice. I have provided a link because some of you may well be reading this post on a third party site and might wish to stop by and visit the original! As always, please remember that I am an amateur investor, so please do your own investigation of all stocks discussed on this website and consult with your professional investment advisors prior to making any investment decisions to make sure that all investments are appropriate, timely, and likely to be profitable for you! Remember, I love to hear from all of you, so if you have any questions, comments or words of encouragement, please feel free to email me at bobsadviceforstocks@lycos.com .
As a quick review for any of you that are new to this blog, I like to present stocks for "consideration". Stocks that I believe may represent companies that have demonstrated qualities that could result in positive price appreciation.
In a nutshell, I start my search scanning the
lists of top % gainers in the market. From this list, lately, I try to stay with stocks at least $10. I have avoided financial issues because my methodology does not conform well to these types of investments. Otherwise, I check most of the stocks on the list looking first to the latest quarterly result, looking for increasing revenue and earnings; then the last several years on Morningstar.com, again looking at revenue and earnings, but also free cash flow, dividend growth, and the balance sheet; then checking Yahoo.com for a look at valuation, and finally, a quick inspection of a point & figure chart from Stockcharts.com.

Today, while looking through the lists of top percentage gainers I came across Parlux Fragrances (PARL). I do not have any shares or options in this investment. PARL, as I write, is trading at $14.95, up $.98 or 7.02% on the day. According to the
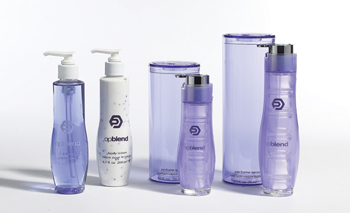
Yahoo "Profile", PARL "...is engaged in the creation, design and manufacture, distribution and sale of prestige fragrances and beauty-related products marketed primarily through specialty stores, national department stores and perfumeries on a worldwide basis."

On August 5, 2004, PARL
reported 1st quarter 2005 results. For the quarter ended June 30, 2004, net sales increased to $23.0 million from $16.9 million last year. Net income was up 200% to $2.2 million compared with $.7 million last year. On a per share fully diluted basis this came in at $.21/share vs. $.08/share in the prior year.
How about longer-term? Checking the
"5-Yr Restated" financials on Morningstar.com, we can see a steady revenue growth from $66 million in 2000 to $87 million in the trailing twelve months (TTM). Earnings have been less steady, dropping to a loss of $(.57)/share in 2002, but increasing since then to $.76/share in the trailing twelve months.
Free cash flow has also been improving. Again, a negative $(6) million in 2002, but improving to $13 million in the TTM.
Balance-sheet-wise, they appear quite solvent with $7.6 million in cash and $60.4 million in other current assets balanced against $13.1 million in current liabilities and only $1.6 million in long-term liabilities.
How about "valuation"? Looking at
Yahoo "Key Statistics", we can see that this is a very SMALL cap stock, some might even say MICRO cap!, with a market cap of only $137.70 million. The trailing p/e is reasonable at 20.21. No forward p/e (? any analysts making estimates?), and thus, no PEG. Price/sales isn't bad at 1.46.
There are only 9.06 million shares outstanding with 7.80 million that float. Currently there are 215,000 shares out short, representing 2.76% of the float or 5.375 trading days of volume. This is a bit higher than my 3 day short coverage ratio that I use to consider a significant short position.
No cash dividend is reported and the last stock split was a 2:1 reported by Yahoo for November, 1995.
How about "technicals"? Looking at a point & figure chart from
Stockcharts.com:
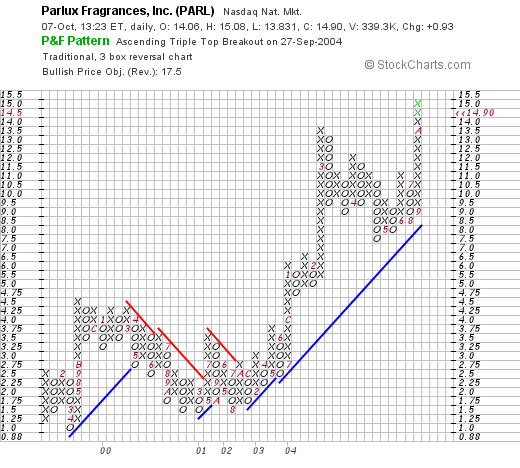
we can see that the stock, which was trading sideways between early 1999 and late 2002, in the range of $1.25 to $4.75, broke through resistance in September, 2003, at about $3.50, and has traded strongly higher since that time. The chart looks nice to me!
So what do I think? This is a very small stock and may represent opportunity, or volatility. The latest quarter looks solid, the five year record of increasing revenue is great. Earnings have been on the rise the last few years, free cash flow is improving, the balance sheet is nice, and valuation is reasonable. Furthermore, the chart looks strong to me!
But as you may know, I just SOLD my ANN to preserve my gain, and I cannot buy anything until the market signals me that the "coast is clear" by a sale of one of my holdings at a gain. That is why my latest transactions have been sales!
 Thanks so much for stopping by! Always remember that I am an amateur investor so please consult with your invesment advisors prior to making any investment decisions based on information on this website. Again, if you have any questions or comments, please feel free to email me at bobsadviceforstocks@lycos.com .
Bob
"Trading Transparency" ANN
Hello Friends! Just a quick note to update you on a trade in my Trading Portfolio. I just sold 225 shares of my Ann Taylor Stores (ANN) at $21.80 as it just got into the loss column. I had purchased these shares 10/1/03, a little over a year ago at $21.85/share. On December 1, 2003, I sold 50 of my original 200 shares for a gain of $376.40. Since I had already sold a portion at a gain, my trading rules dictates a sale as it approaches the break-even on the way down. And sell I did!
Will keep you posted!
Bob
Wednesday, 6 October 2004
October 6, 2004 Wolverine World Wide (WWW)
Hello Friends! Thanks so much for stopping by. If you are new to this website, you might want to see my main page:
Bob's Advice for Stocks, where I review some of the parameters I like to consider when evaluating a stock. In a nutshell, I like to start first evaluating the
lists of top % gainers for the day. Often I will start first with the NASDAQ, but sometimes, like today, I review the NYSE lists first. In any case, I go through a screening process, first checking the latest quarter financial results, then looking at the last 5 years on Morningstar, checking valuation issues with yahoo, and then look at a chart from Stockcharts.com.
There really isn't anything 'magic' about what I do. I had a semi-professional investor tell me what I was doing was just "due diligence". I guess that was a compliment. But please remember that I am an amateur investor, so consult with your own professional investment advisors prior to making any investment decisions based on information on this website.

How about a shoe company for a change? I was scanning the
list of top % gainers on the NYSE, when I came across Wolverine World Wide (WWW). WWW was the second-best %-gainer on the NYSE today, closing at $28.90, up $2.53 or 9.59% on the day.

According to the
Yahoo "Profile", WWW "...is a designer, manufacturer and marketer of a broad line of casual shoes, outdoor and work footwear and constructed slippers and moccasins. The Company's footwear products are organized under five operating units: The Wolverine Footwear Group, the Outdoor Group, Caterpillar Footwear, The Hush Puppies Company and Other Branded Footwear."
What drove the stock higher today, was that the company
announced 3rd quarter 2004 earnings. For the quarter, revenue rose 13% to $260.9 million from $230.6 million last year. Earnings rose 34% to $21.9 million or $.55/share from $16.4 million, or $.40/share in the year-ago period. Even nicer, the company RAISED guidance for 2004 to a range of $1.60 to $1.62 per share on revenue of $975 to $985 million. Previously, they had guided to $1.44 to $1.52/share on revenue of $960 to $980 million.
'

How about longer-term? Well, if you have visited here before, you will know that the next place I like to look is the
Morningstar.com "5-Yr Restated" financials. There we can see the steady improvement in revenue from $665.6 million in 1999 to $937 million in the trailing twelve months (TTM).
Earnings have been a bit more erratic, dropping from $.78/share in 1999 to $.26/share in 2000, but then steadily improving to the current $1.43/share in the TTM.
Free cash flow has been outstanding, improving from $43 million in 2001 to $94 million in the TTM. The balance sheet also looks nice per Morningstar.com with $63.6 million in cash and $342.2 million in other current assets, enough to cover the current liabilities about four times over. In addition, the company has $62.9 million in long-term debt.

How about the "valuation" of WWW? Looking at
Yahoo "Key Statistics", we can see that the market cap is a mid-cap $1.13 billion. The trailing p/e is 20.21 with a forward p/e (fye 3-Jan-06) of 16.71. The PEG is at 1.35, a little steep.
Yahoo reports 39.12 million shares outstanding with 38.00 million of them that float. As of 9/8/04, there are 1.17 million shares out short, representing 3.07% of the float or 7.535 trading days (!). This appears significant to me as I use a 3 day cut-off for signifance for this figure.
WWW also pays a small dividend of $.26/share yielding 0.99%. The last stock split reported on Yahoo was a 3:2 split as of May 27, 1997.
Looking at a "Point & Figure" chart from
Stockcharts.com:
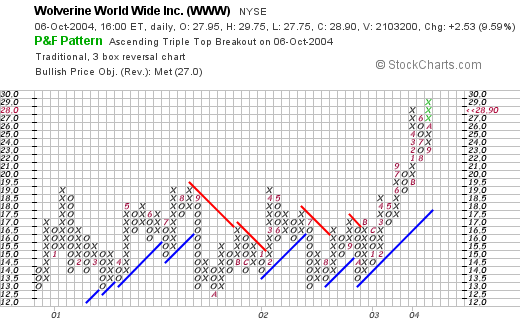
We can see that this stock has been trading sideways from 2001 through 2003 and in early 2004, this stock broke out to a higher level.
At this point in the discussion, I like to summarize. First, the stock had a nice move today, showing good daily momentum. The recent earnings are solid (came out today), the latest five years shows steady revenue growth and fairly steady free cash flow improvement, with an outstanding balance sheet. Valuation is reasonable. There are even a few shorts outstanding that may add to an upward move of this company.
By the way, I do not own any shares of this company nor do I own any options.
Currently, in my "Trading Portfolio", I am patiently waiting hopefully for American Healthways to hit a sale point (30% appreciation) which would permit me in my trading allowance to add a new position. If you have any comments or questions, please feel free to email me at bobsadviceforstocks@lycos.com
Bob
Posted by bobsadviceforstocks at 11:51 AM CDT
|
Post Comment |
Permalink
Updated: Wednesday, 6 October 2004 10:39 PM CDT
Newer | Latest | Older
 Hello Friends! Just came back from a week in New Orleans. This beautiful photo is courtesy of the State of Louisiana Tourism Office, and it is certainly worth a trip to see the original in person! After being a regular blogger for the last 18 months, I really do go through a bit of withdrawal as I stay away from the 'net. I found myself going to internet cafes to catch up with what was going on...I really need to get myself a good laptop with a nice WiFi port. As always, please remember that I am an amateur investor so please do your own due diligence on all stocks discussed and consult with your professional investment advisors before making any decisions to make sure that all investments are appropriate, timely, and likely to be profitable for you! If you have any questions or comments, please feel free to email me at bobsadviceforstocks@lycos.com.
 Anyway, I am back in business! So, while scanning the list of top % gainers on the NASDAQ this afternoon, I came across Cabot Microelectronics (CCMP) which closed at $35.70, up 13.15% on the day. I do not own any shares of Cabot, nor do I own any options. According to the Yahoo "Profile", CCMP "...is a supplier of high-performance polishing slurries used in the manufacture of integrated circuit (IC) devices within the semiconductor industry, in a process called chemical mechanical planarization (CMP)." O.K., I am not a wiz on this stuff, so it appears that this company's fortune is tied to the chip market. And they are doing just fine!
 What drove the stock higher today, was the 4th quarter and year-end earnings announcement. For the quarter ended September 30, 2004, revenue came in at $82.7 million, up 7.5% sequentially from $76.9 million in the prior quarter and up 21.8% from $67.9 million the prior year same quarter. Net income for the quarter was $13.2 million, up 7.5% from $12.2 million the prior quarter and up 36.5% from the $9.6 million the prior year. On a per share diluted basis, this came in at $.53/share this quarter, up sequentially from $.49/share the prior quarter and up from $.39/share the prior year. For the year, revenues were up 23.0% to $309.4 million, and diluted earnings per share came in at $1.88, up 22.9% from the $1.53 reported in fiscal 2003. These look like solid results to me!
 (The picture at right is a "Chemical Mechanical Polishing (CMP) Slurry Feeder Equipment made by Takada Corporation in Japan.)


 Since so many people reading this blog are new to my methods let me review today's pick and then share with you my rationale. Generally, my first step in identifying a stock of interest is to scan the
  Diagnostic Products (DP) is having a great day, trading as I write at $42.18, up $1.90 or 4.72% on the day. I do not own any shares of this stock nor do I have any options. According to the
  For this, I turn to the

 On September 8, 2002, I
  On September 8, 2003, I
  I
I  Finally, on 9/12/04, I posted Hanger Orthopedig Group (HGR) at $14.75. Hanger closed at $5.48 on 10/15/04 for a loss of $(9.27) or (62.8)% over the past year.
  Hello Friends! I am just getting geared up around here to push some voter interest! I cannot tell you how important I think it is that you all make sure you get your votes counted. It REALLY is a different sort of election!
  I was scanning through the lists of top % gainers today and came across Dorel Inds "B" (DIIB). I do NOT own any shares or options in this company. DIIB is having a great day today trading as I write at $28.24, up $2.13 or 8.16% on the day. According to the
  On August 4, 2004, DIIB
  What about valuation? Taking a look at
 So what do I think? Well, it IS a Canadian company, so that gives it a little bit of a currency spin...but that really shouldn't be a problem. I like and am familiar with their brands (a Peter Lynch moment!), the latest quarter looks nice, the last five years has been steadily improving, free cash flow is solid, the balance sheet is good, valuation is excellent and the chart looks nice! What is there NOT to like? lol. Now if I just had some money to invest! As you may know, I like to wait for a sale of one of my pre-existing positions prior to adding funds to establish a new position in this portfolio!
 The first stock to be posted that week was Sohu.com, which I
  On September 3, 2003, I
  On September 4, 2003, I
  Hello Friends! I felt like I needed to liven up the website...so here it is a portrait of Christopher Columbus to commemorate the upcoming Columbus Day Holiday on October 12th. Hard to believe that it has been 500 years since Columbus "discovered" America. Seems like yesterday!
  Today, while looking through the lists of top percentage gainers I came across Parlux Fragrances (PARL). I do not have any shares or options in this investment. PARL, as I write, is trading at $14.95, up $.98 or 7.02% on the day. According to the
  On August 5, 2004, PARL
  How about "valuation"? Looking at
 Thanks so much for stopping by! Always remember that I am an amateur investor so please consult with your invesment advisors prior to making any investment decisions based on information on this website. Again, if you have any questions or comments, please feel free to email me at bobsadviceforstocks@lycos.com .
 How about a shoe company for a change? I was scanning the
  According to the
  How about longer-term? Well, if you have visited here before, you will know that the next place I like to look is the
  How about the "valuation" of WWW? Looking at