Stock Picks Bob's Advice
Friday, 23 July 2004
"Trading Transparency" GPRO
Hello Friends! The BEAR is growling and I can feel it gnawing on my portfolio!

A few moments ago, my shares of Gen-Probe (GPRO) hit and went past the 8% loss limit and out the shares went. I had purchased 300 shares of GPRO at $41.30 on 5/27/04, and now just sold my 300 at $37.567 for a loss of $(3.733) or (9)%. That puts me down to 20 positions...down 2 in the last 2 days. I will not be purchasing any new positions until I sell a portion of my existing holdings at a gain.
How many positions will I go down to in the worst scenario. I was thinking about this today. Since my goal is 25 positions, and currently am using margin, in the current situation, I would go down to about 12 positions to eliminate margin and to 6 positions to go to 50% cash. Thus, 6 will be the bottom limit. Hopefully, I will not get there! However, if I do, I will replace my positions to maintain a 50% exposure to equities.
Thanks so much for stopping by! If you have any comments or questions please feel free to email me at bobsadviceforstocks@lycos.com and please remember that I am an amateur investor and you should consult with your professional investment advisors prior to taking any action based on information on this website.
Bob
Thursday, 22 July 2004
"Trading Transparency" LWAY
Just a quick note to update you on Lifeway Foods (LWAY). A few moments before the close of trading today, I reviewed the holdings and realized that LWAY was moving into the loss column. Since I had already sold a portion of my holdings at a gain, I needed to avoid allowing the remaining position to move into a loss situation and it was sold a couple of cents below the purchase price. Details to follow.
Thanks so much for stopping by! If you have any questions or comments, please feel free to email me at bobsadviceforstocks@lycos.com .
Bob
Wednesday, 21 July 2004
"Handling Bad News" HIBB
Hello Friends! I usually don't post much before the market opens but we have a problem child in the
Current Trading Portfolio.

Yesterday, after the close of trading, Hibbett (HIBB)
announced reduced expectations for the 2nd quarter. They said, per the article, that "a sluggish June period, along with a slowdown in sales of fitness equipment and licensed apparel, would cut into profits." They announced that they would soon be reporting same store sales growth of 2-3% (instead of 5-6% earlier expectations) and $.13-$.15/share for the quarter (instead of the $.18-$.20 earlier expected). The stock is NOT doing well in after-hours trading, apparently trading at least at one point down almost 16%. (Based on the prior close of $22.56, this would amount to an almost $3.50 loss BEFORE it even opens. What should we do?
First, let's see what the current holdings are and out situation with this company. As of yesterday's close, I own 172 shares of HIBB that were acquired on 3/6/03 for a cost basis of $9.74/share for an unrealized gain of $2,204.43 or 131.54%. I don't want to lose all of my gain, but then again, I do not want to panic and sell prematurely.
The strategy that I utilize is to sell stocks slowly when we have made gains. I have been doing this all along with HIBB. On 2/7/03, I made my first purchase of HIBB, buying 100 shares at $22.10 for a cost of $(2,224.95). On 3/6/03, I purchased 100 shares of HIBB at $21.71 for a cost of $(2,185.95). Thus, my total cost for all of my HIBB shares was originally $(4,410.90.)
HIBB has had two stock splits since I have owned these shares, the first a 3:2 on July 16, 2003, and a 3:2 on August 19, 2004. I have sold my HIBB shares multiple times already: 50 shares 5/30/3 for proceeds of $1,423.48, and a gain of $311.00, 50 shares 9/4/03 for $1,256.94 with a gain of $515.29, 40 shares 10/15/03 for $1,072.74 and a gain of $483.44, and finally 20 shares 4/5/04 for proceeds of $766.58 and a gain of $475.12. Thus I have already SOLD $4,519.74 of HIBB (remember, my COST was $4,410.90), and have taken gains of $1,784.85. I am not at very much risk of losing ANY principle as I have taken OUT my original investment after four sales as planned.
Still what do I do? If my last sale was at a 120% gain target (presumably), I should sell HIBB if my gain gets to a 60% level....allowing it to retrace 1/2 of the gain...that is my strategy at least.
With a current cost basis of $9.74, a 60% gain would be 160% of $9.74 or $15.58. This is my new sale target on the downside.
Now THAT was a long analysis. If the stock is indeed trading down 15% in after-hours that would get us to about $19/share. We have a little room to go before I pull the plug!
Thanks so much for stopping by! Always remember that I am an AMATEUR investor, so please consult with your professional investment advisors prior to taking any action on stocks discussed on this website. If you have any questions, comments, or words of encouragement, please email me at bobsadviceforstocks@lycos.com .
Bob
Tuesday, 20 July 2004
A reader writes "Try Bloomberg"
Hello Friends! This is a short note for the evening. Oscar wrote a little earlier today:
"
Try Bloomberg.com - look at the symbol of your stock and read thru the boxes"

Here is the link for the
Bloomberg Website. I am quite honestly not real familiar with this website, but it appears to work a lot like Yahoo Finance. I guess the bottom line is that it doesn't really matter which financial information provider you have, as long as it is reputable (as Bloomber is!)...and it provides you with enough data to make a decision.
Thanks so much for your comments. If you have any other questions or comments, please feel free to email me at bobsadviceforstocks@lycos.com .
Bob
July 20, 2004 Florida Rock Industries (FRK)
Hello Friends! Thanks so much for stopping by. I got caught by the JUNO sell-off today....sometimes better to avoid those micro-cap stocks that are overly-volatile. (Some day I may learn I hope.) Please remember that I am an AMATEUR investor, so please consult with your professional investment advisors prior to making any decisions based on things you read on this website. Also please do your own investigation of all stocks discussed to verify information posted.

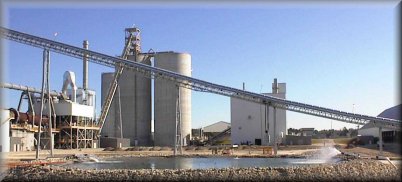
Florida Rock Industries (FRK) is having a very nice day today trading currently at $42.21, up $2.04 or 5.08% on the day. I do not own any shares nor do I have any options in this stock. According to the
Yahoo "Profile" on FRK, they operate "...principally in three business segments: construction aggregates, concrete products and cement and calcium products." I believe this is our first "rock" stock.
On April 20, 2004, FRK announced their second quarter 2004 results. (I do not have a link for this as it came off of their website). Consolidated total sales for the quarter increased 40% to $228.6 million from $163.6 million the prior year. Net income came in at $24.5 million or $.56/share up from $16.3 million or $.37/diluted share a more than 50% increase. These are very nice results.
If we look a bit longer-term at
"5-Yr Restated" financials on Morningstar.com, we can see that revenue has steadily increased from $597 million in 1999 to $988 million in the trailing twelve months (TTM).

Earnings per share have shown a nice progression from $1.07/share in 1999 to $2.60/share in the TTM. Also nice, the company DOES pay a small dividend and it has been increasing it from $.16/share to $.61/share in the TTM...and increasing it EACH year since 1999. Free cash flow has also been excellent and INCREASING from $54 million in 2001 to $104 million in the TTM.
Looking at the balance sheet on Morningstar.com, we can see that the company has $42.5 million in cash and $162.7 million in other current assets. This is plenty to cover the $106.5 million in current liabilities and make a big dent in the $190.3 million in long-term liabilities reported.
How about valuation? Looking at
"Key Statistics" On Yahoo, we can see that this is a mid-cap stock with a Market Cap of $1.83 Billion. The trailing p/e is nice at 17.89 with a forward (fye 30-Sep-05) of 14.86. Thus the PEG is downright cheap at 0.99 with a Price/Sales of 1.99 which isn't too rich either.
Yahoo reports 43.25 million shares outstanding with 31.30 million of them that float. Of these shares, 1.33 million shares are out SHORT, which is a LOT for this company (as of 6/7/04), and thus, the short ratio is 7.319 trading days. As you know, I like to use 3.0 days to assign any significance to this number. This is a lot of trading days....and with good results, and a bit of an upward move, we might see a bit of a squeeze. I like this figure.
The company, as noted above, pays a $.66/share dividend yielding 1.66% which isn't too bad in today's low money-market rate environment. Yahoo does not report any stock split.
How about technicals? Looking at stockcharts.com, one of my favorite free websites for basic charting, we can see with a Point & Figure chart:
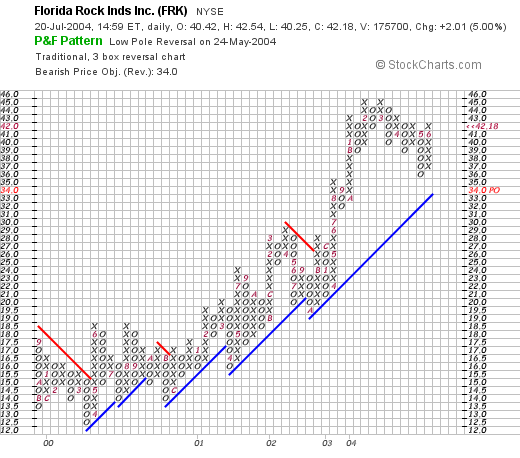
this stock has been trading very nicely above its support levels since it was about $12 in April, 2000. It does not appear over-extended. I don't see much I don't like about this chart imho.
Well what do I think? Well, I am not much into rock stocks :), but this stock looks very nice. We have a GREAT recent earnings report, the past five years shows steady growth in revenues and earnings, the company pays a small and GROWING dividend, the free cash flow is strong and growing, the balance sheet is fine, the valuation looks excellent with a PEG under 1.0, and why we even have a bunch of short-sellers out there WAITING to buy shares! Technically the chart looks just fine. If I wasn't WAITING for a stock to sell at a gain, I might just be nibbling on this cement stock (is that a mixed metaphor or what?)....but you know the same old problem...I don't have any money to buy stock now!
Thanks so much for stopping by. If you have any questions, comments, or words of encouragement, please feel free to email me at bobsadviceforstocks@lycos.com .
Bob
"Trading Transparency" JUNO
Hello Friends! Just a quick note to catch you up. The market has turned around nicely today but my Juno Lighting (JUNO) which I only had 100 shares in my trading account has NOT been performing well and hit a 13% loss. Out it went. A few moments ago I pulled the plug at $28.53. I had purchased the shares on 4/7/04 at $33.37. Will keep you posted!
Bob
Monday, 19 July 2004
July 19, 2004 Stryker (SYK)
Hello Friends! The market has closed and there is one stock I would like to review with you. I actually reviewed this once before on a MSN site, but haven't posted it yet here as it just made the
list of top % gainers on the NYSE. Stryker Corporation (SYK) closed at $47.95, up 4.15% on the day. As always, please remember that I am an amateur investor, so please consult with your own professional investment advisor prior to making any investment decisions based on information on my
blog, Stock Picks Bob's Advice or elsewhere on the website.

According to the
money.cnn.com "Snapshot", Stryker Corporation's "...principal activities are to develop, manufacture and market surgical and medical products. The Group operates in two segments: Orthopaedic Implants and MedSurg Equipment." I do not own any shares or options in this company.
Stryker
reported 2nd quarter 2004 earnings on July 15th. Total second-quarter sales rose to $1.04 billion from $891.7 million last year. Second quarter net earnings rose to $152.7 million or $.37/share from $107.5 million or $.26/share last year. They also announced they had paid down virtually all of their debt during the quarter.
In addition, on the same day, SYK
upped their earnings outlook for fiscal 2004 to $1.42/share up from its previous forecast of $1.40. Although the revision is small, it is the direction and the fact that there was a revision that is significant.
If we look at a
"5-Yr Restated" financials on Morningstar.com, we can see that revenue has steadily grown from 1999 when it was $2.1 billion to the $3.8 billion in revenue in the trailing twelve months.
Earnings/share have also grown strongly during this period from $.05/share in 1999 to $1.19/share in the TTM. A cash dividend is paid, rising from $.03/share to $.06 in 2002. (Per Yahoo, the company has paid $.07/share yielding 0.15% in the TTM).
Free cash flow is excellent increasing from $311 million in 2001 to $453 million in the TTM. This company is spinning off almost 1/2 of a billion dollars each year in free cash flow!
Balance sheet wise, SYK has $48.9 million in cash and $1.4 billion in other current assets, enough to easily pay off both the current liabilities of $798.3 million and the $145.5 million in long-term liabilities combined. From the latest quarterly report, apparently they HAVE paid off virtually all of their debt and are looking into acquisitions.
How about valuation? If we look at
"Key Statistics" from Yahoo, we can see that this is a Large Cap stock with a market cap of $19.19 billion. The trailing p/e is 40.26, the forward p/e is 28.54 (fye 31-Dec-05), and the PEG is 1.94 with a price/sales of 4.65. This stock is not a cheap stock at all!
There are 400.19 million shares outstanding with 272.20 million that float. Currently there are 5.99 million shares out short, for a short ratio of 4.904 as of 6/7/04. This is significant, and may account for the price rise today in the face of an overall declining market.
Yahoo shows that SYK does pay a dividend of $.07/share (even though Morningstar does not show any dividend for 2003), yielding 0.15%. The stock recently split 2:1 in May, 2004.
How about the "technicals"? If we look at a Point & Figure chart from Stockcharts.com:
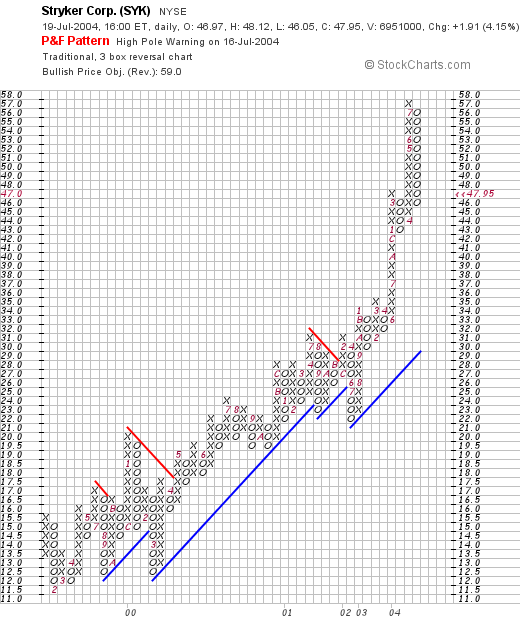
we can see what appears to be one of the strongest graphs on this blog with a nice ascent from February, 2000, to the current level. The stock has pulled back from its lofty $57 level recently, but the price chart, in my opinion, while a bit ahead of the support line, has not broken down at all.
 So what do I think? I really like this stock....but I do not have any money available to buy shares :). The latest quarterly report was strong, they have announced an increase in their own estimates for 2004, the record on Morningstar is impeccable with a steady growth in revenue, earnings, and even dividends. The free cash flow is excellent. The balance sheet is nice, and the current quarterly report points out they have paid off their debt, the valuation IS a bit steep with a PEG over 2.0, but sometimes you just GOT to pay for quality, but this is a draw-back. And the graph looks very strong. Looks like a winner to me!
Thanks so much for stopping by! If you have any questions, comments, or words of encouragement, please feel free to email me at bobsadviceforstocks@lycos.com .
Bob
Posted by bobsadviceforstocks at 6:31 PM CDT
|
Post Comment |
Permalink
Updated: Sunday, 1 August 2004 2:42 PM CDT
A Reader Writes
Hello Friends! Happy Monday everyone. Checking the mail this morning, Paul writes:
"
Bob - a wonderful site and thanks for your time consumming
analysis - could you tell me how to find "shorts" for any particular company - thanks, paul"
Thanks Paul for writing! I have found that the level of short interest is an interesting statistic which may be indicative of future price movement. This serves two purposes, raising the question that somebody may actually know something bad about a company...and maybe the individual investor should be cautious. Or perhaps on a more encouraging note, if there is a large short interest, then maybe these shares, which need to be covered eventually, will drive the price higher in a "squeeze".
I use Yahoo.com for most of my data. Unfortunately, it is always a little stale...and if somebody has a better place to look, well then let me know. However, it is adequate for my purposes. If you go to
"Key Statistics", which for illustration purposes, I am using SANDISK...which can be found along the left hand side of the main quote section:
on the "Summary" section of each Yahoo finance quote, you can find "Key Statistics" under "Company"....then looking in the second column of the "Key Statistics" you will see the number of shares out short, the date of that statistic, and the short ratio which is the number of days of current average trading volume that it would take to cover. For my purposes, I use 3 days as a cut-off of significant short interest!
Thanks again for your inquiry. I hope that was helpful and answers your question. If you have any other questions or anyone else for that matter, please feel free to email me at bobsadviceforstocks@lycos.com . Please remember that I am an AMATEUR investor, so please consult with your professional investment advisors before making any investment decisions based on information contained on my website.
Bob
Posted by bobsadviceforstocks at 9:22 AM CDT
|
Post Comment |
Permalink
Updated: Sunday, 1 August 2004 2:41 PM CDT
Saturday, 17 July 2004
"Looking Back One Year" A review of stock picks from the week of July 7, 2003

Hello Friends! I just finished posting Masonite (MHM) and now for a little house-cleaning...time for the retrospective on this blog. If you are a new reader, I like to pick lots of stocks on my
blog, but to determine whether this is even working (!), I have always tried to look back and figure out what happened to these stocks. I must point out that the "system" that drives my trading portfolio includes sales at 8% losses, and other sales on gains as well. This review reflects a "buy and hold" philosophy that I do not personally practice....so my results would be affected by this. Please always remember, that I am an amateur investor, so please remember to consult with your own professional investment advisor to make sure if the investments discussed are appropriate and timely for you!
The week of July 7, 2003, was not a very busy week on this blog. In fact, I only posted two stocks. (About this time in the process, I am relieved to figure that out....so I can get to some personal "chores" around the house!)

On July 7, 2003, I
posted FindWhat (FWHT) on
Stock Picks Bob's Advice at a price of $22.16. FWHT closed at $18.23 on 7/16/04 for a loss of $(3.93) or (17.8)%.
The
1st quarter 2004 earnings results was released on April 26, 2004. Revenue in the first quarter ended March 31, 2004, increased 56% over the prior year. This represented 18 sequential quarters of revenue growth. Net income in the quarter came in at $3.8 million, or $.16/share, a 41% increase over the prior year's $2.7 million or $.13/share. In addition, FWHT raised fiscal 2004 guidance, based in part on acquisitions of Comet Systems and Espotting. The company does appear to be on track, but the stock price is certainly a bit disappointing....

On July 8, 2003, I
posted Websense (WBSN) on
Stock Picks Bob's Advice at $20.26. WBSN closed on 7/16/04 at $31.63 for a gain of $11.37 or 56.1%.
On May 7, 2004, WBSN
filed a 10-Q report for the quarter ended March 31, 2004. Revenue for the quarter increased to $24.6 million from $18.5 million the prior year. Fully diluted earnings jumped to $.22/share from $.17/share the prior year. The company appears to be doing just fine.
So how did we do that week? Well, one winner WBSN with a 56.1% gain, and one loser, FWHT, with a (17.8)% loss. Ironically, both were the so-called "dot-com" stocks. Averaging these two stocks, we come out with a 19.2% gain on the week. Not too bad over the past year.
Thanks again for stopping by! If you have any questions, comments, or words of encouragement, please feel free to email me at bobsadviceforstocks@lycos.com .
Bob
Masonite Intl (MHM)
Hello Friends! I don't usually post any new stock ideas on Saturday, but I had this stock I wanted to share with you on Friday but never got around to it! I am sure glad you stopped by and please do make yourself at home. If you are reading this on a third party website, like thegoldencoast.com, then be sure to come by and visit my
blog where you can review all of my endless commentary on stocks of interest. Please do remember, I am an amateur investor, this is my hobby, so please remember to consult with your professional investment advisors before taking any action on stocks discussed on this website to make sure they are timely, appropriate, and profitable for you!

Yesterday, while scanning the
list of top % gainers on the NYSE, I came across Masonite (MHM) which closed yesterday at $24.99, up $1.16 on the day or 4.87% in an otherwise mediocre market. First of all, I do not have any shares of this stock nor do I own any options. I believe that the stock is moving up on anticipation of 2nd quarter 2004 earnings, which should be released Monday per an
announcement from Masonite this past Tuesday. According to the
Yahoo "Profile", Masonite International "...is a manufacturer of doors, door components and door entry systems for new residential construction, home repair, renovation and remodelling, and commercial use."
We will have the 2nd quarter 2004 earnings results in just a couple of days, but let's take a look at the
1st quarter 2004 results which were released April 21, 2004. For the quarter ended March 31, 2004, sales increased 16% to $468 million from $402.2 million the prior year. Net income jumped 36% to $27.7 million from $20.3 million. And on a per share fully diluted basis, earnings jumped to $.51/share from $.38/share, a 34.2% increase. These were pretty nice results.
If we look longer-term, we can see from
Morningstar "5-Yr Restated" financials that revenue has grown steadily since even before 1999 when they reported $1.1 billion in revenue, and increased to $1.8 billion in the trailing twelve months. Earnings/share, while dipping from $1.00 in 1999 to $.84 in 2001, have steadily increased from that time. Free cash has been postitive and strong with $44 million reported in 2001 and $105 million reported in the trailing twelve months (TTM).
The balance sheet looks just fine with $129.7 million in cash and $625.9 million in other current assets, enough to easily cover the $370.6 million in current liabilites and much of the $589.6 million in long-term liabilities as well.
Looking at
"Key Statistics" on Yahoo we can see that the Market Cap is a mid-cap level $1.36 billion. The trailing p/e is a very reasonable 11.84 with a forward p/e of 8.89. I do not see a PEG on Yahoo, but with an
"Analysts Estimates" of $2.81 for Dec 05 on Yahoo and $2.54 from Dec 05, we can see that analysts are expecting a $.27/share growth or a $.27/$2.54 10.6% growth in earnings. If we divide the p/e of 11.84 by the 10.6 we get a PEG of 1.12 which isn't too high either! The Price/Sales is also very cheap at 0.70.
Yahoo reports 54.43 million shares outstanding with 52.30 million of them that float. Currently there are only 60,000 shares out short as of 6/7/04, but this does represent 3.75 trading days due to the low average trading volume on this company. No cash dividend is paid and no stock splits are reported on Yahoo.
How does the chart look like? If we look at a Point & Figure Chart from Stockcharts.com:
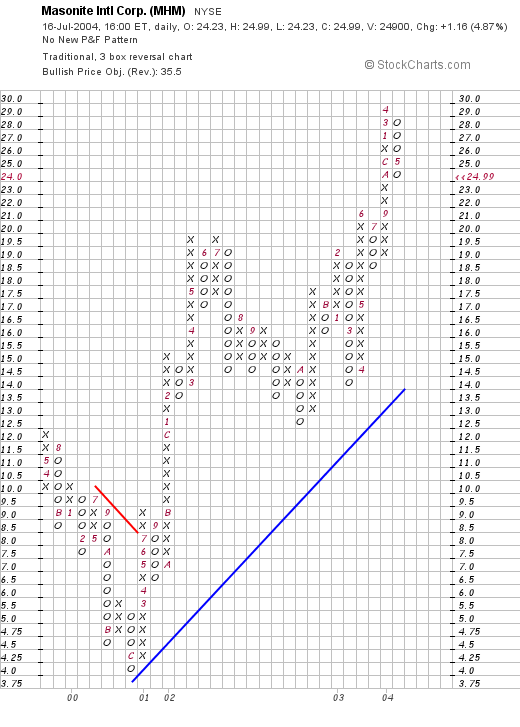
it appears that this stock was trading lower through late 2000, then in July, 2001, it broke through a resistance level at about $9.50 and has headed strongly higher since then to its current levels. The chart looks strong to me.
So what do I think. Frankly, I decided to post this one today because I thought it was too pretty a picture to ignore. I would pay close attention to the earnings results coming out Monday morning and this could confirm my assessment or cause me to give pause. I would look for continued strong revenue growth and earnings growth to confirm that this company is continuing on its excellent past record. I like the latest quarter earnings that I have available, the past revenue growth is superb, the cash flow and balance sheet look nice, the valuation is excellent and the chart is impeccable. My only hesitation is the rather low trading volume...but that is only a small footnote to my evaluation. I cannot personally buy any shares as my system of waiting for a sale at a gain to purchase shares is holding me back! But then again there are so MANY stocks that I do like!
Thanks again for stopping by! If you have any questions, comments, or words of encouragement, please feel free to email me at bobsadviceforstocks@lycos.com .
Bob
Newer | Latest | Older


