Stock Picks Bob's Advice
Monday, 18 September 2006
Precision Castparts (PCP)
Hello Friends! Thanks so much for stopping by and visiting my blog, Stock Picks Bob's Advice! As always, please remember that I am an amateur investor, so please remember to consult with your professional investment advisors prior to making any investment decision based on information on this website.
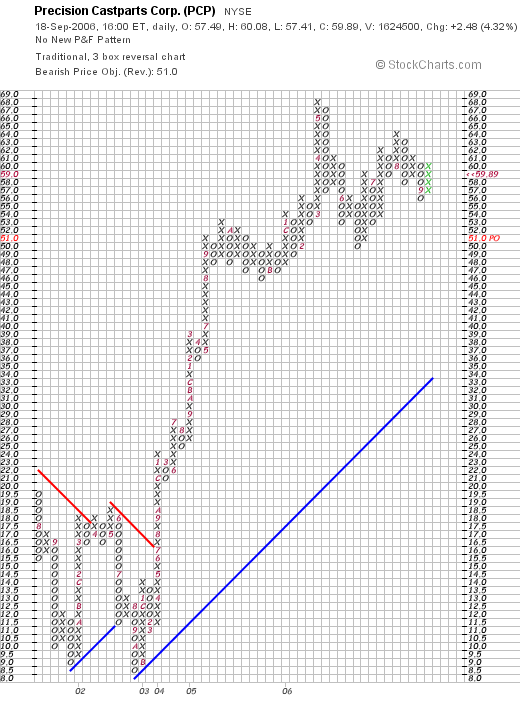
 I was looking through the list of top % gainers on the NYSE tonight, and came across Precision Castparts (PCP) which closed at $59.89, up $2.48 or 4.32% on the day in an otherwise anemic market. I do not own any shares of PCP nor do I own any options on this company.
This review tonight is more or less a "revisit" of an old stock pick that was brought to my attention by George K., a good friend of mine, and a member of my stock club who suggested I take a look at PCP. In fact, I reviewed PCP on Stock Picks Bob's Advice on February 19, 2006, when it was trading at $56.37. Since the post, the stock has appreciated $3.52 or 6.2%. I hope that George picked up a few shares of this one at the time of his email and my discussion. If I find out, I will try to pass it on to you.
Let's take another look at this company and I will try to show you why I now fully agree with George that this stock deserves a spot on this blog!
1. What exactly does this company do?
According to the Yahoo "Profile" on Precision Castparts, the company
"... engages in the manufacture of metal components and products; and the provision of investment castings, forgings, and fasteners/fastener systems for critical aerospace and industrial gas turbine applications. It operates through four segments: Investment Cast Products, Forged Products, Fastener Products, and Industrial Products."
2. Was there any news today to explain the stock move higher?
Looking through the news today, I found a single story from Motley Fool listing Precision Casparts (PCP) as one of the "Best Stocks of the Millennium. And what they are discussing is the appreciation of stocks since the end of 1999, December 31, 1999 to be exact. PCP was one of six stocks discussed, having appreciated 770% since that date! (The other stocks were Middleby, National Healthcare, Itron, and ITT). Was this the story that drove the stock higher? Probably not, but that was the only news item on the stock that I could locate!
3. How did the company do in the latest reported quarter?
On July 25, 2006, Precision Castparts (PCP) reported results for the 1st quarter of fiscal 2007. For the quarter ended July 2, 2006, sales increased 31.6% from $853 million in sales to $1.12 billion. Net income for the quarter increased from $77.9 million to $118 million, or $.86/diluted share, up 48.3% from $.58/diluted share. (These results include results from the newly acquired Special Metals operation). This quarter's results exceeded analysts' expectations of $.74/share. Sales results also exceeded expectations of $1.06 billion.
4 . How about longer-term financial results?
Reviewing the Morningstar.com "5-Yr Restated" financials, we can see that revenue, which dipped from $2.2 billion in 2002 to $1.8 billion in 2003, has subsequently steadily increased to $3.5 billion in 2006 and $3.8 billion in the trailing twelve months (TTM).
Earnings, however, have been quite erratic, increasing from $.41/share in 2002 to $1.17/share, then dropping to a loss of $(.01)/share in 2005, increasing to $2.58/share in 2006 and $2.85/share in the TTM.
The company has increased shares somewhat from 103 million in 2002 to 133 million in 2006 and 135 million in the TTM.
Free cash flow has been strongly positive if not steady with $87 million in 2004, $292 million in 2005, dropping to $132 million in 2006 and $227 million in the TTM.
The company has a relatively small amount of cash with $97.8 million reported. When combined with the $1.8 billion in other current assets, results in a total current assets of $1.91 billion. When compared to the $1.1 billion in current liabilities, results in a 'current ratio' of 1.74.
5. How about some valuation numbers on this stock?
Reviewing Yahoo "Key Statistics" on Precision Castparts, we find that this is a large cap stock with a market capitalization of $8.11 billion. The trailing p/e is a moderate 21.02 and the forward p/e (fye 02-Apr-08) is even nicer at 13.74. With the rapid growth in earnings anticipated, the PEG works out (5 yr expected) to a very nice 1.10. From these parameters the stock appears reasonably valued.
Examining the Fidelity.com eresearch website for data on PCP, we can see that this company is in the "Steel & Iron" industrial group. Relative to the Price/Sales ratio, this stock is the richest in valuation in the group with a Price/Sales ratio of 2.1. This is followed by Oregon Steel Mills (OS) at 1.3, Nucor (NUE) at 1.1, Steel Dynamics (STLD) at 1.1 and Gibraltar Industries (ROCK) at 0.5.
Insofar as profitability is concerned, as measured by the Return on Equity (ROE), PCP is also near the bottom of the 'heap'. Topping this list is Nucor with a ROE of 33.3%, followed by Steel Dynamics (STLD) at 29.1%, Oregon Steel at 22.8%, Precision at 18.6%, and Gibraltar Industries at 10.3%.
Returning to Yahoo, we can see that there are 135.48 million shares outstanding with almost all, 134.87 million share, that float. Of these that float, 1% or 1.38 million shares are out short representing a short ratio of 1.2. The company pays a dividend of $.12/share yielding 0.2%. The last stock split was a 2:1 split on September 9, 2005.
6. What does the chart look like?
Reviewing the "Point & Figure" chart from StockCharts.com on PCP, we can see that the stock, which drifted lower between July, 2001 when the stock was trading at $15.50, hit a low of $8.50 in October, 2002. The stock broke through resistance in July, 2003, at $17 and has traded higher since. The upward move of this stock chart appears to have slowed but is still moving higher.
7. Summary: What do I think about this stock?
Let's review some of the observations I have made above. First of all, the stock moved nicely higher on the heels of a 'top millennium' stock on Motley Fool. The latest quarter was quite strong with solid growth of both earnings and revenue with the company beating expectations on revenue and earnings results. On Morningstar.com, except for the erratic earnings, the company has produced solid revenue growth, a reasonable balance sheet, and a strong chart to boot! On the downside, while the p/e isn't bad and the PEG is just over 1.0, the Price/Sales as well as the Return on Equity numbers left a little to be desired. I am willing to overlook those valuation numbers in light of the phenomenal earnings report and the possibility of future earnings growth. Overall, I like this company a lot! (Good pick George!)
Of course, since I have not sold any portion of my stocks at a targeted gain, I am still not 'elibible' to be buying a new position. But if I were.....this would be the kind of stock that I would be looking at!
Thanks once again for stopping by! If you have any comments or questions, please feel free to email me at bobsadviceforstocks@lycos.com or go ahead and leave your comments right on the blog. Also, be sure and visit my Stock Picks Podcast Website.
Bob
Sunday, 17 September 2006
"Looking Back One Year" A review of stock picks from the week of May 16, 2005

Hello Friends! Thanks so much for stopping by and visiting my blog, Stock Picks Bob's Advice! As always, please remember that I am an amateur investor, so please remember to consult with your professional investment advisors prior to making any investment decisions based on information on this website.
The weekend is almost over and I wanted to make sure I get to the 'stock pick review' that I have been doing each weekend (unless I get too busy) for the past several years. I do not think it is enough to just write up some stock ideas and leave it at that. I owe it to you, the reader, to examine those past selections and find out how they turned out. I suppose that this continued re-examination of stocks can help me refine my own ideas about what makes a good stock market pick.
For the sake of this review, I am assuming a buy and hold strategy for these picks. For my average performance, I am assuming that an equal dollar purchase has been made of all stocks that particular week and that by averaging each stock's performance, I can arrive at some sort of average for the group of investments. As you probably know, most of the stock picks are not actually purchased by me in my trading portfolio. However, virtually every single stock in there came out of the same process that led me to write the stocks up! I continue to post my trades...both purchases and sales, and try to update my trading portfolio at intervals as well as going through my actual holdings about every two weeks.
In regards to that 'buy and hold' strategy, as you probably know, if you are a regular reader here, I use a very disciplined trading strategy with all of the stocks that I own. First of all, I will have only a maximum of 25 positions (currently I am at 11). My minimum holdings are also limited at 6, although I have never been at that level, I am currently below my maximum # of positions as well. I only add a new position if I sell a portion of a holding at a targeted gain...currently I use 30, 60, 90, 120%, then 180, 240, 300 and 360%, then 450, 540, 630, 720...etc. as targeted gains. At each of those targeted price appreciation levels, I am currently selling 1/6th of my remaining shares (I was selling 1/4 of my position until I realized that the size of my positions was dwindling). When I do sell a stock at a gain, I use that as a signal that the market is 'ripe' for a new position to be added.
However, when I sell on what I call bad news I don't do anything with the proceeds, what I like to refer to as "sitting on my hands". Currently bad news sales occur when either there is a fundamental announcement of bad news, or the stock price declines to targeted sale points. My current targets are at an (8)% loss after a first purchase, break-even if I have sold a portion at the first targeted appreciation (30% gain), or 1/2 of the highest appreciation target achieved. The final strategy means that if I have sold a portion of a stock three times (that is at 30, 60, and 90% appreciation targets), my targeted sale on the downside would be at 1/2 the 90% appreciation point...or at 45% appreciation, instead of break-even or even at an 8% loss.
 The first stock discussed that week was American Healthways (AMHC) that on January 31, 2006, announced a change in name to Healthways (HWAY). I posted my 'pick' on May 16, 2005, when the stock was trading at $39.42. HWAY closed at $48.05 on September 15, 2006 for a gain of $8.63 or 21.9%.
 On June 26, 2006, HWAY announced 3rd quarter 2006 results. Revenues climbed 36% to $106.8 million, up from $78.4 million in the prior year same period. Net income came in at $9.3 million or $.26/diluted share, up from $8.5 million or $.24/diluted share in 2005. This exceeded analysts' expectations of $.21/share, on $104.6 million in revenue. The company also raised guidance for the full year for earnings of $1.17 to $1.20, up from prior guidance of $1.16 to $1.19/share. Revenue guidance was unchanged in the range of $415 million to $435 million for the full year.
 On May 18, 2005, I posted FactSet Research (FDS) on Stock Picks Bob's Advice when it was trading at $31.53. FDS closed at $47.21 on September 15, 2006, for a gain of $15.68 or 49.7% since posting.
On June 20, 2006, FactSet reported 3rd quarter fiscal 2006 results. For the quarter ended May 31, 2006, revenues climbed 24.5% to $98.8 million, from $79.3 million in the same quarter the prior year. Net income increased to $21.0 million from $19.6 million last year same period. Diluted earnings per share grew to $.41 up from $.39 the prior year.
 Finally, on May 20, 2005, I posted Kyphon on Stock Picks Bob's Advice when it was trading at $28.85/share. On September 15, 2006, KYPH closed at $39.27, for a gain of $10.42 or 36.1% since posting.
On July 26, 2006, Kyphon reported 2nd quarter 2006 results. Revenue for the quarter ended June 30, 2006, totaled $101.1 million, up 35% over the $75.0 million reported in the same quarter the prior year. Net income for the quarter increased 19% to $9.5 million or $.21/diluted share, up from $7.9 million or $.18/diluted share for the same period last year.
So how did I do with these three stocks? In a word, terrific! I do not think that this performance is accidental but is related to all of the underlying strength of the companies involved. However, past performance is NO guarantee of future performance, so take this with a grain of salt. Anyhow, averaging the three stocks, I had an average performance of a gain of 35.9% since posting these stocks a bit over a year ago.
Thanks so much for stopping by and visiting! If you have any comments or questions, please feel free to drop me a line at bobsadviceforstocks@lycos.com or go ahead and leave your comments on the blog! Please also visit my Stock Picks Podcast Site and you can hear me talk about many of these same stocks I have been writing about here!
Have a great week everyone!
Bob
Posted by bobsadviceforstocks at 8:22 PM CDT
|
Post Comment |
Permalink
Updated: Sunday, 17 September 2006 9:10 PM CDT
Saturday, 16 September 2006
Zumiez (ZUMZ)
CLICK HERE FOR MY PODCAST ON ZUMIEZ
Hello Friends! Thanks so much for stopping by and visiting my blog, Stock Picks Bob's Advice! As always, please remember that I am an amateur investor so please remember to consult with your professional investment advisors prior to making any investment decisions based on information on this website.
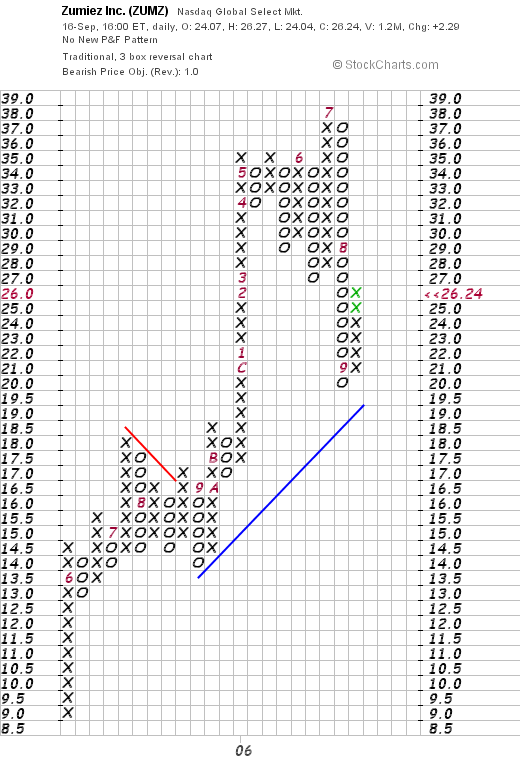
 Zumiez (ZUMZ) made the list of top % gainers on the NASDAQ more than once this past week. Zumiez was on the list yesterday, closing at $26.24, up $2.29 or 9.56% on the day. I do not own any shares nor do I have any options on this stock. I did buy 22 shares for my son in his account a couple of months ago.
 I have been watching this stock for awhile as there is a Zumiez store in my local mall. But more significantly, when the same store sales reports have been announced, Zumiez is one of the strongest retail firms reporting from my perspective. More on this in a bit. But above all, I think this company deserves a spot on the blog for all of the things I like to see in a stock.
1. What exactly does this company do?
According to the Yahoo "Profile" on Zumiez, the company
"...operates as a mall based specialty retailer of action sports related apparel, footwear, equipment, and accessories in the United States. It offers apparel offerings, including tops, bottoms, outerwear, and accessories such as caps, belts, and sunglasses; and footwear offerings, such as action sports-related athletic shoes and sandals. The company also provides equipment offerings or hardgoods, including skateboards, snowboards, and ancillary gear, such as boots and bindings; and miscellaneous novelties and digital versatile discs. It serves young men and women between the ages of 12 and 24."
2. Was there any news reported to explain the big move higher?
Actually, I didn't see any particular news on Friday to explain the move higher! Earlier in the week Piper Jaffray upgraded the stock from "Market Perform" to "Outperform" which might still have had an effect on Friday.
3. How did they do in the latest quarter?
 On August 16, 2006, Zumiez (ZUMZ) reported 2nd quarter 2006 results. For the quarter ended July 29, 2006, total sales increased by 41.5% to $55.8 million, from $39.4 million reported in the same quarter in the prior fiscal year. Net income for the quarter was $1.6 million or $.06/diluted share, up 94% from the $848,000 or $.03/share reported the prior year. This beat analysts expectations of $.05/share for the quarter. During the quarter, comparable store sales increased 12.6% compared with the 11.6% comparable (same-store) sales growth reported in 2005. In an additional positive note, the company raised guidance for fiscal 2006 to $.66 to $.67/diluted share. This is what I call my 'trifecta plus' in an earnings report. For me, that means the company increased its revenue, increased its earnings, beat expectations AND raised guidance. Everything an investor could desire in an earnings report!
4. How about longer-term financial results?
Reviewing the Morningstar.com "5-Yr Restated" financials on Zumiez, we can see the steady picture of revenue growth with $84.7 million in revenue in 2001, increasing to $205.6 million in 2006 and $220 million in the trailing twelve months (TTM).
Unfortunately, Morningstar doesn't show any income figures as the company came public in May, 2005.
Free cash flow has improved from $1 million in 2004 to $8 million in 2006 and $15 million in the TTM.
The balance-sheet is solid with $38 million in cash, which by itself could cover the $32.9 million in current liabilities and much of the $9.4 million in long-term liabilities. Adding in the $43.4 million of other current assts results in $81.4 million in total current assets, which when compared to the $32.9 million in current liabilities yields a current ratio of 2.47.
5. What about some valuation numbers on this stock?
 Looking at the Yahoo "Key Statistics" on Zumiez, we find that this is a mid-cap stock with a market capitalization of $723.91 million. The trailing p/e is rich at 50.85, with a forward p/e (fye 28-Jan-08) much nicer at 29.48. This company's growth is expected by analysts (5 yr expected) to be so strong that the PEG works out to a very reasonable .98.
Per the Fidelity.com eresearch website, ZUMZ is in the "Apparel Stores" industrial group. Within this group, ZUMZ is the richest in valuation in regards to the Price/Sales ratio with a ratio of 3.2. Zumiez is followed by American Eagle (AEOS) at 2.6, Chico's (CHS) at 2.4, Abercrombie & Fitch (ANF) at 2.1, Limited (LTD) at 1.1 and Gap (GPS) at 1.
Checking relative profitability, ZUMZ is towards the bottom with a Return on Equity (ROE) of 19.8%. This group is topped by Abercrombie at 35.9%, Limited at 30.8%, American Eagle at 26.7%, Chico's at 26.1%, and following Zumiez is Gap at 17.2%. Thus, from these two measures the company appears richly valued with a Price/Sales relatively high and a profitability relatively low.
Returning to Yahoo, we find that there are 27.59 million shares outstanding with 14.68 million that float. As of 8/10/06 there were 3.06 million shares out short, representing 13.9% of the float or 5.9 trading days of volume. This high level of short interest (I use a short ratio of 3 as a cut-off), may well explain the move higher Friday as short-sellers scramble to cover their shorts! No cash dividends are paid and the last stock split was a 2:1 split on April 20, 2006.
6. What does the chart look like?
Looking at a "Point & Figure" chart from StockCharts.com, we can see that this stock has moved strongly, if unevenly, higher since coming public in May, 2005. The stock hit a high of $38 in July, 2006, and is now bouncing off support in the area of $21 to close at $26.24 Friday. The chart has stayed above the blue 'support line' and looks encouraging to me without being over-extended.
7. Summary: What do I think about this stock?
Let's review some of the things that led me to write up this stock on the blog. First, the stock made a nice move higher on Friday, and indeed was strong for much of last week after a brokerage house upgraded the stock to 'outperform'. And the latest quarter? Strong with a 41.5% increase in revenue and a 94% increase in earnings.
The company both beat expectations and raised guidance in the latest quarter. However, same store sales which were in the 10-11% range in the latest quarter has dropped down to the 4.7% range the past month. In addition, the Morningstar.com report is solid with steady revenue growth (since company is a relatively recent IPO, Morningstar has limited earnings and share # reports), free cash flow, and a solid balance sheet. Valuation-wise, the p/e is quite rich at just over 50. However, earnings are anticipated to continue to growing rapidly and the PEG is under 1. The company is no bargain either as measured by Price/Sales ratio as well as Return on Equity. However, the relatively large short-interest may well be moving this stock higher as well. Finally, the chart looks nice.
On a Peter Lynch style approach, I like the fact that this is a very small retail firm with fairly steady and positive same store sales growth. I think they cater to a unique youth audience and are quite successful at it as well! Assuming the ability to continue to growth those sales at stores open at least a year, this company has lots of room to grow. We will need to continue to watch those same-store sales numbers which come out monthly, to make sure that this relatively weak figure for same store sales does not deteriorate.
So am I buying any shares? No, of course not. If you are a regular reader, you will know that I shall be sitting on my hands until one of my regular stocks hits a sale at an appreciation target.
Thanks so much for visiting! If you have any comments or questions, please feel free to leave them on the blog or email me at bobsadviceforstocks@lycos.com.
Bob
Posted by bobsadviceforstocks at 10:01 PM CDT
|
Post Comment |
Permalink
Updated: Sunday, 17 September 2006 10:49 PM CDT
Thursday, 14 September 2006
NeuroMetrix (NURO)
Hello Friends! Thanks so much for stopping by and visiting my blog, Stock Picks Bob's Advice! As always, please remember that I am an amateur investor, so please remember to consult with your professional investment advisors prior to making any investment decisions based on information on this website.
 Earlier today I noted that NeuroMetrix (NURO) was behaving well in an otherwise anemic market. (The market is consolidating today after several days of price appreciation and in the face of an otherwise weak retail report). As I write, NURO is trading at $20.50, up $1.76 or 9.39% on the day. I do not have any shares or options on this stock.
I would like to briefly share with you some of my thoughts on this stock and why I have chosen it for this blog.
As I do with all of my picks, I start with the stocks that are moving strongly higher that day. NURO made the list of top % gainers on the NASDAQ today with its strong move to the upside.
According to the Yahoo "Profile" on NeuroMetrix, the company
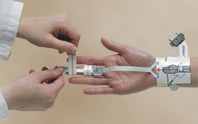
"...engages in the design, development, and sale of proprietary medical devices used to diagnose neuropathies. The company offers NC-stat System, a neuropathy diagnostic system that provides physicians the ability to diagnose patients with neuropathies at the point-of-service."
Reviewing the latest quarterly report, on July 27, 2006, NURO reported 2nd quarter 2006 results. 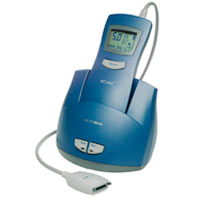 For the quarter ended June 30, 2006, revenue came at $14.0 million, a 73% increase over the $8.1 million reported in the second quarter of 2005. Net income worked out to $1.36 million or $.13/share, as compared with a loss of $(636,500) or $(.05)/share the prior year. The report notes that results would have been even better minus the stock-based compensation reporting requirements.
Loking longer-term at the Morningstar.com "5-Yr Restated" financials, we can see the steady increase in revenue from $3.5 million in 2001 to $34.3 million in 2005 and $45.2 million in the trailing twelve months (TTM). Net income has improved from a loss of $(10) million in 2001, improving to a profit of $1 million in 2005 and improving to $3 million in the TTM. On a per share basis, results were first reported in 2005 when $.07/share were reported. This has sharply improved to $.25/share in the TTM.
The free cash flow trend is encouraging with $(4) million in free cash flow improving to $(3) million in 2004, $1 million in 2005 and $3 million in the trailing twelve months.
The Morningstar.com balance sheet looks solid with the company reported to have $34.7 million in cash, enough to pay off both the $6.0 million in current liabilities and the $1.2 million in long-term liabilities combined...more than 4x over.Calculating the 'current ratio', with the total current assets working out to $45 million, when compared to the $6 million in current liabilities, this works out to a ratio of 7.5 which is quite solvent.
 Reviewing Yahoo "Key Statistics" on NURO, we find that this stock is a small cap stock with a market capitalization of only $262.73 million. The trailing p/e is a very rich 87.09, but the forward p/e is a bit better (fye 31-Dec-07) at 38.87, but still rich. Thus, the PEG at 1.51 is not a steal, but with the rapid growth anticipated, the current p/e may not be as bad as it looks at first glance.
Reviewing the Fidelity.com eresearch website, we can see that this company is in the "Medical Instruments/Supplies" industrial group. It tops the group in terms of the Price/Sales ratio with a ratio of 5.4. NURO is followed by Cytycf (CYTC) at 5.3, Stryker (SYK) at 4, Boston Scientific (BSX) at 3.2, Becton Dickinson (BDX) at 3.1 and Baxter (BAX) at 3.
Also, in terms of profitability, as measured by Return on Equity (ROE), NURO is less than stellar with Becton Dickinson at the top at 20.4%, Cytyc at 20.1%, Stryker at 19.9%, Baxter at 19.7% and NeuroMetrix at 8.7%, only followed by Boston Scientific at (55.7)%. Clearly, this stock is not an intrinsic bargain, but investors are paying for the future rapid growth and the possibilities that this investment represents, not the actual current performance.
Returning to Yahoo, we can see that there are 12.52 million shares outstanding and 11.88 million that float. Of these, 24.9% were out short as of 8/10/06, representing 2.86 million shares or 10.1 trading days of volume. I use a 3 day rule and this is triple my level for significance. There does appear to be quite a few shares sold short on this company and what we are witnessing today may well represent part of a squeeze on the shorts.
No dividend is paid and no stock splits are reported by Yahoo.
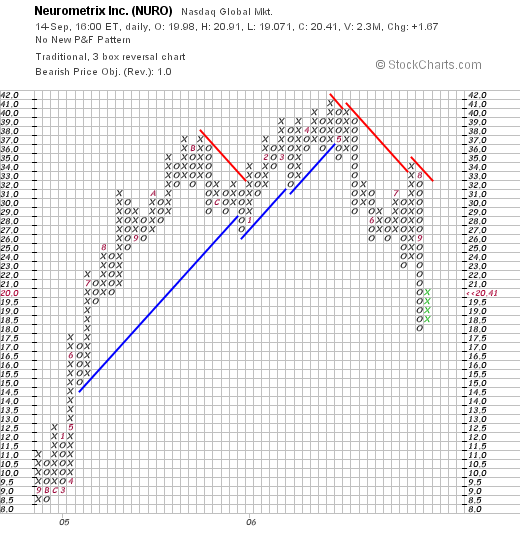
What about the chart? If we review a "Point & Figure" chart from StockCharts.com on NURO, we can see that the company which was trading strongly higher from $8.50 in September, 2004, broke through resistance and peaked at $41 in April, 2006. Indeed the chart looks like the stock 'rolled over' and the price declined to the recent low of $18. Today's nice move to $20.41 does not really break this trend. Hopefully, the upcoming quarter will be strong and the shorts will once again be 'squeezed' if we are to see this stock turn around and move to new highs. It would be nice to see this stock trading above $32 before I could feel more comfortable suggesting that this stock should be bought in here.
Thanks again for stopping by and visiting! If you have any comments or questions, please feel free to leave them on the blog or email me at bobsadviceforstocks@lycos.com. Also, be sure and stop by and visit my Stock Picks Podcast Website.
Bob
NeuroMetrix (NURO)
Hello Friends! I don't have time to do a whole post...but take a look at NURO and I think you might like what you see. Latest quarter, Morningstar, and today's move make it an interesting idea. I haven't looked at this one before, don't own any shares, am not planning at this time to buy any shares (I don't have a buy signal), but I was afraid that with my busy schedule, I wouldn't get around to writing this one up!
Regards!
Bob
Wednesday, 13 September 2006
"Revisiting a Stock Pick" Global Payments (GPN)
CLICK HERE FOR MY PODCAST ON GLOBAL PAYMENTS
Hello Friends! Thanks so much for stopping by and visiting my blog, Stock Picks Bob's Advice! As always, please remember that I am an amateur investor so please remember to consult with your professional investment advisors prior to making any investment decisions based on information on this website.
 We had another nice day in the market. I cannot remember how long it has been since we have had so many up days in a row! I hope it is not premature to start getting optimistic about things, but with the interest rate hikes on hold and energy prices pulling back, we might just have the beginnings of a new bull market. Hopefully, that is not wishful thinking :).
Going back to my usual haunts looking through the top % gainers lists, I came across what I call an "old favorite" of mine, Global Payments (GPN) which made the list of top % gainers on the NASDAQ, closing at $41.25, up $2.61 or 6.75% on the day. I have an arbitrary rule on this blog that I do not like to review past stock picks until at least a year has passed.
I first reviewed Global Payments on Stock Picks Bob's Advice on September 9, 2005, when it was trading at $68.89. GPN had a 2:1 stock split October 31, 2005, making my effective stock pick price actually $34.45. With today's close at $41.25, the stock has appreciated $6.80 or 19.7% over the past year. I do not own any shares nor do I have any options on this stock.
Let's take another look at this stock and see why I think it deserves a spot on Stock Picks!
1. What exactly does this company do?
If we look at the Yahoo "Profile" on Global Payments, we can see that this company
"...provides payment processing and consumer money transfer services worldwide. The company operates in two business segments, Merchant Services and Money Transfer."
2. Was there any news today to explain the stock price move?
Today, as reported, UBS upgraded GPN from "Neutral" to "Buy". Scouring the news on Global Payments, I found another story regarding GPN's acquisition of Sarajevo-based Diginet, an "indirect payment processor" adding to its "presence in the Balkan region." Personally, I have observed that most acquisitions result in the acquiring company dropping slightly in price and the company to be acquired climbing higher. However, some acquisitions might well be additive to earnings. It does appear that the UBS upgrade may have been the bigger news.
3. How did the latest quarterly report turn out?
This news report was a little harder to locate but was easily retrieved from the company website. Global Payments announced 4th quarter 2006 results on July 28, 2006. For the quarter ended May 31, 2006, revenue grew 15% to $238.8 million, up from $207.7 million in the same quarter the prior year. 4th quarter GAAP net income was $34.1 million, compared with $23.5 million the prior year. On a per share basis this worked out to $.41/diluted share, up from $.29/diluted share the same quarter the prior year.
4. How has this company done longer-term?
Reviewing the Morningstar.com "5-Yr Restated" financials on GPN, we can see the steady pattern of revenue growth from $463 million in 2002 to $784 million in 2005 and $908 million in 2006.
Earnings have grown just as consistently with $.31/share reported in 2002, increasing to $1.16/share in 2005 and $1.53/share in 2006. The company has been paying a dividend of $.08/share steadily since at least 2002. Nicely, even though there has been a slight increas in shares outstanding, this has been a modest increase from 72 million shares in 2002 to 79 million shares in 2006. This is less than a 10% increase in the shares while revenue doubled and earnings quintupled.
Free cash flow is also gorgeous. Global Payments had $68 million in free cash flow in 2004, increasing to $195 million in 2005 and $210 million in 2006.
The balance sheet is solid with $218.5 million in cash, enough to pay off the current liabilities of $149.7 million and most of the long-term liabilities of $98.8 million. Calculating the current ratio, the company has a total of $348.4 million in total current assets, which when divided by the $149.7 million in current liabilities yields a current ratio of 2.33. Current ratios over 2 are considered healthy.
5. How about some valuation numbers on this stock?
Using the Investopedia definition of market capitalization:
"Mega Cap: Market cap of $200 billion and greater
Big/Large Cap: $10 billion to $200 billion
Mid Cap: $2 billion to $10 billion
Small Cap: $300 million to $2 billion
Micro Cap: $50 million to $300 million
Nano Cap: Under $50 million"
Global payments would be considered a mid-cap stock with a market capitalization of $3.30 billion per Yahoo "Key Statistics". Elsewhere on this blog, I have described mid-cap stocks as companies with market capitalizations of $500 million to $3 billion, so this certainly varies from source to source.
The trailing p/e is a moderate 27, with a forward p/e (fye 31-May-08) of only 20.62. Analysts are apparently fairly bullish on growth prospects as the PEG ratio works out to a reasonable 1.35.
Examining the Price/Sales ratio on the Fidelity.com eresearch website, and using the Paul Sturm perspective, we find that Global Payments (GPN) is in the "Business Services" Industrial Group, and is fairly richly valued with a Price/Sales ratio of 3.5. This is exceeded only by Getty Images (GYI) with a ratio of 3.7, and is followed by Choicepoint (CPS) with a ratio of 3.1, Fidelity National Information Services (FIS) at 2.9, and Cintas (CTAS) at 1.9.
Looking at profitability, as measured by Return on Equity (ROE), finds Global Payments leading this group with a figure of 18.1%, this is followed by Cintas at 15.3%, Choicepoint at 12.9%, Getty Images at 11.6%, and Fidelity National Information Services at 9.6%.
Returning to Yahoo for some more numbers, we find that there are 79.91 million shares outstanding and 66.66 million of them that float. Currently, as of August 10, 2006, there were 2.47 million shares out short, representing 3.10% of the float or 2.5 trading days of volume (the short ratio). Using my own arbitrary 3 day rule on short ratios, I do not find this a very significant level of short interest.
As I noted earlier, the company does pay a small dividend of $.08/share yielding 0.2%. The last stock split was a 2:1 split on October 31, 2005.
6. What does the chart look like?
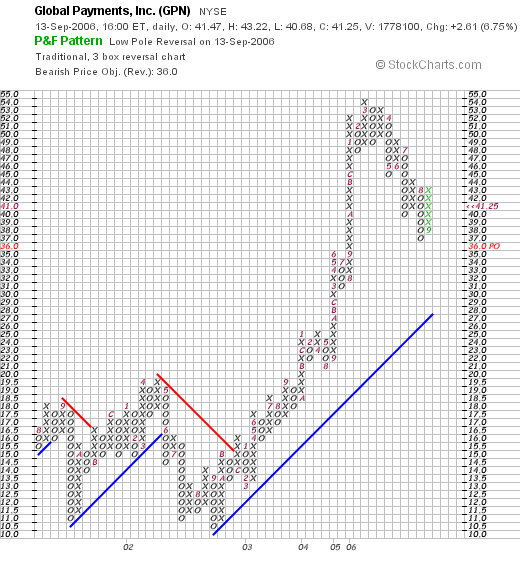
If we review the "Point & Figure" chart on Global Payments from StockCharts.com, we can see that this stock was going nowhere between August, 2001, and December, 2002, when it traded in a range between $10.50 and $20. The stock broke out in December, 2002, breaking through resistance at $15. The stock moved steadily higher until accelerating in January, 2006, and topping out at $54/share. Recently the stock has pulled back to the $37 level, but moved sharply higher today back up to the $41.25 range. The stock chart looks solid to me.
7. Summary: What do I think about this stock?
Let's review some of the things going on with this stock which moved nicely higher today. First of all the stock was upgraded by UBS and also announced a strategic acquisition. The latest quarter was very strong with a steady growth in revenue and earnings. Looking at the Morningstar report, we found that this revenue growth was remarkably steady the past five years with steady revenue and earnings growth with only a small increase in the shares outstanding. The company even pays a small dividend.
Free cash flow has been positive and growing solidly the past few years, the balance sheet is solid with ample cash and a current ratio over 2. Valuation-wise, the p/e isn't bad in the 20's, the PEG is only a big over 1.2, the Price/Sales is a bit rich, but GPN leads its group in terms of return on equity. There aren't many shares out short. And finally, the chart looks nice to me.
This "profile" of a company is the kind of stock I am looking for and this company has once again demonstrated it deserves a place in this blog! Of course, I am not buying any shares now. I am still waiting for a signal from my own portfolio--a sale of a portion of my holdings at a gain. Meanwhile, I continue to 'sit on my hands'.
Thanks so much for stopping by and visiting! If you have any comments or questions, please feel free to leave them on the blog or email me at bobsadviceforstocks@lycos.com. Please also be sure to come and visit my Stock Picks Podcast Site!
Bob
Tuesday, 12 September 2006
Psychiatric Solutions (PSYS) September 12, 2006
Hello Friends! Thanks so much for stopping by and visiting my blog, Stock Picks Bob's Advice! As always, please remember that I am an amateur investor, so please remember to consult with your professional investment advisors prior to making any investment decisions based on information on this website.
 It is a nice change to be looking at a stock market moving ahead strongly on the back of additional gains in the prior weeks. We have had so many days and months of corrections as the Fed relentlessly pushed interest rates higher. Perhaps most of that weakness is behind us. In any case, with the market indices moving ahead all day today, we have the opportunity of finding additional companies that are worth evaluation on this website.
My method of identifying candidates for consideration continues to start with the top % gainers list. Why? Well, if we wish to identify a timely stock that will move higher from this point in time, why not start with stocks moving higher today? In any case, using this list gives us a manageable group of names to evaluate.
In fact, looking through the top % gainers list from the NASDAQ today, I came across Psychiatric Solutions (PSYS), which is, as I write, trading at $35.78, up 10.91% on the day. I do not have any options or hold any shares in this company.
I have already examined this stock for myself, but let me share with you why I believe it deserves to be on the blog.
1. Is there any news to explain the company's move higher?
As reported, it was announced after the close of trading yesterday that PSYS will be replacing RSA Security in the S&P MidCap 400 Index. Since there are investment vehicles like the iShares MidCap 400 Index fund, this means that individuals or institutions that are trying to reflect the performance of this index will be more or less 'swapping' shares of RSA to buy shares of PSYS. In any case, this recognition by the S&P people, also is helpful in bringing this stock to the public's attention and the stock price responded nicely today.
2. What exactly does this company do?
Checking the Yahoo "Profile" on PSYS, we find that the company
"...and its subsidiaries provide inpatient behavioral health care services in the United States. The company operates in two divisions, Inpatient and Inpatient Management Contract."
3. How did they do in the latest quarter?
On July 26, 2006, Psychiatric Solutions reported their 2nd quarter results. For the quarter ended June 30, 2006, revenue came in at $248.4 million, up 78% from $139.5 million reported in the prior year same period. Net income increased 38% to $.29/share up from $.21/share last year. Just as in retail evaluations, we can talk about "same-store sales growth", since this company may have sales affected by opening new hospitals, or acquiring hospitals which has occurred, the "same facility growth" is important and PSYS noted that the 'same-facility revenue' increased by 8%.
An additional note in the earnings report was the raised guidance for the 2006 fiscal year from the previous $1.02-$1.05 to a new range of $1.08-$1.10. Since analysts had been expecting $.27/share on revenue of $248.4 million, this result also beat expectations by $.02. This is what I call my 'trifecta-plus' in earnings reports: increasing revenue, increasing earnings, beating expectations, and raising guidance--a nice combination that imho often tends to precede stock price appreciations.
4. What about longer-term results?
My favorite place to examine longer-term results if Morningstar.com, and the "5-Yr Restated" financials on PSYS look superb. What do I mean by that? What I am searching for in my quest to identify stocks worth of investment is quality. For me quality in an investment is defined by a consistent pattern of financial results including steadily increasing revenue, earnings, and positive and growing free cash flow. This should be done without diluting the equity by issuing an abundance of shares and without a perilous balance sheet.
Looking specifically at Psychiatric Solutions, we can see the rapid growth in revenue as represented by the series of increasing purple bars on the graph, from $44.0 million in 2001 to $727.8 million in 2005 and $944.7 million in the trailing twelve months (TTM).
Earnings have grown from $.22/share in 2003 to $.82/share in the TTM. Unfortunately, the company has been a bit liberal with issuing shares growing the shares outstanding from 17 million in 2003 to 53 million in the TTM. In spite of the tripling of shares with the tripling of revenue, the company has still been able to almost quadruple earnings pere share.
Free cash flow has been positive, increasing from $13 million in 2003 to $23 million in 2004, $58 million in 2005 and $80 million in the TTM.
The balance sheet is o.k. with $56.5 million in cash and $195.3 million in other current assets. This total of $251.8 million in current assets, when compared to the current liabilities of $101.6 million yields a current ratio of 2.48. I have generally followed the 'rule' that a current ratio of greater than 1.5 is considered 'healthy'. Clearly, the company does have a significant amount of long-term debt; apparently financing its rapid growth through both the issuance of stock and borrowing, but the presence of a solid and growing free cash flow with a healthy current ratio suggests that this debt will be handled satisfactorily in the immediate future.
5. How about some valuation numbers on this company?
Reviewing the Yahoo "Key Statistics" on PSYS, we find that indeed this stock is a mid-cap stock with a market capitalization of $1.91 billion. There are many definitions for market capitalization, but this one from the Investopedia states:
"Mega Cap: Market cap of $200 billion and greater
Big/Large Cap: $10 billion to $200 billion
Mid Cap: $2 billion to $10 billion
Small Cap: $300 million to $2 billion
Micro Cap: $50 million to $300 million
Nano Cap: Under $50 million"
The trailing p/e is a fairly rich 43.93, but the forward p/e (fye 31-Dec-07) is a more-reasonable 25.34. Thus, the PEG ratio (5 yr expected) is a very reasonable 1.19.
Reviewing the information from the Fidelity.com eresearch website, we can see that PSYS is in the "Specialized Health Services" industrial group. Looking at the Price/Sales ratio, as Paul Sturm explained in Smart Money, relative to other companies in this group, PSYS is reasonably priced with a Price/Sales ratio of 1.9. Leading this group is another favorite of mine, Healthways (HWAY) with a Price/Sales ratio of 4.6. This is followed by United Surgical Partners (USPI) with a ratio of 2.4, then PSYS at 1.9, then DaVita (DVA) at 1.9, VISTACARE (VSTA) at 1, and Caremark Rx (CMX) at 0.7.
Reviewing the Return on Equity (ROE), for a measure of profitability, PSYS also is low on the list with DaVita leading the list at 24.3%, Healthways at 13.6%, Caremark Rx at 12.7%, United Surgical Partners at 9%, Psychiatric Solutions at 7.9% and VISTACARE at the bottom of the list at -6.6%.
Thus from these two meaures, PSYS is average-priced in terms of Price/Sales for a relatively less profitable business. Apparently, in light of the rapid growth in both revenue and earnings, investors have been willing to pay a premium for these shares.
Finishing up with Yahoo, we can see that there are 53.13 million shares outstanding with 5.86 million shares out short. This is a hefty short ratio of 8.1 representing the 5.86 million shares or 11% of the float. It may well be, that in the light of relatively good news today, that the shorts were squeezed, pressuring the stock price higher. But that is of course just my speculation on today's move.
No cash dividend is paid and the last stock split was a 2:1 split earlier this year on January 10, 2006.
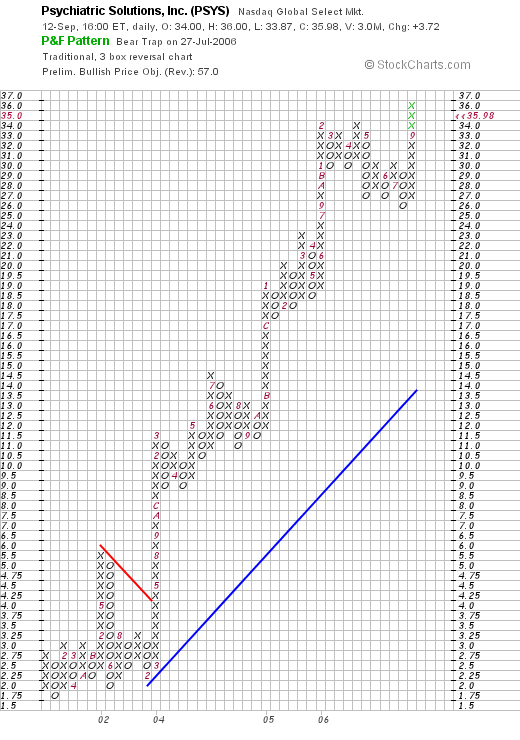
6. What does the chart look like?
Looking at a StockCharts "Point & Figure" chart on PSYS, we see an incredibly strong chart of a company that was consolidating from January, 2001, through February, 2004, when the stock broke through resistance at $4.00 and start an ascent into the $36 range where it is now trading. The stock was pulling back a bit since February of this year, but after its big move today is once again heading into new highs territory.
7. Summary: What do I think about this stock?
To summarize, the stock had a large move higher today on the back of good news about its inclusion in the S&P 400 MidCap index. On top of this, there are a large number of short-sellers who may well have been taken unawares and 'squeezed' with this price rise adding to the buying pressure. In any case, the last quarter's report was solid, the Morningstar.com report is good except for a bit of long-term debt and the habit of this company to issue new shares to fund its activities. Value-wise the company's p/e is rich in the 60's, the PEG however is reasonable under 1.2, suggesting that the prospects may well justify the premium. Both Price/Sales ratios and ROE are unimpressive, again suggesting fairly rich valuation. Finally the chart is strong and may in fact be a bit over-extended. However, with all of the other criteria met, this is the kind of stock I might be adding to my portfolio, if I had a signal to be buying in the market at all!
Thanks again for stopping by and spending some time here on the blog. If you have any comments or questions, please feel free to email me at bobsadviceforstocks@lycos.com and be sure to listen to my Stock Picks Podcast.
Bob
Posted by bobsadviceforstocks at 3:10 PM CDT
|
Post Comment |
Permalink
Updated: Tuesday, 12 September 2006 4:00 PM CDT
Saturday, 9 September 2006
"Weekend Trading Portfolio Analysis" ResMed (RMD)
CLICK HERE FOR MY PODCAST ON RESMED!

Hello Friends! Thanks so much for stopping by and visiting my blog, Stock Picks Bob's Advice! As always, please remember that I am an amateur investor, so please remember to consult with your professional investment advisors prior to making any investment decisions based on information on this website.
One of the things I like to do on this blog is to share with you both ideas about investments that I am reviewing (my "stock picks") as well as let you know about the actual transactions I make (my "trading transparency"). A year or so ago, I thought I would add a regular review of stocks that I actually own...what I call my "Trading Portfolio". With only 11 positions, out of my maximum of 25 positions possible, I have been reviewing positions, going alphabetically, about every other week. Two weeks ago I reviewed Quality Systems (QSII). My next holding is ResMed (RMD).
 I currently own 150 shares of ResMed in my Trading Portfolio. RMD closed at $40.80 on September 8, 2006. These shares were purchased on 2/4/05, with a cost basis of $29.87. Thus I have an unrealized gain of $10.93 or 36.6% on these shares.
I have sold shares of ResMed twice since the original purchase. One portion at a 30% appreciation, and another at a 60% appreciation level. Thus, on the upside, I shall be selling approximately 1/6th of my position if the stock should reach a 90% appreciation at a price of 1.90 x $29.87 = $56.75. On the downside, the sale of all of my remaining shares would be at 50% of the highest sale point (my personal strategy) or at a 30% gain level (since the highest sale was at a 60% sale). Or all shares would be sold at 1.30 x $29.87 = $38.83. With ResMed pulling back from the latest sale, I am closer to a sale at the 30% level than a sale at a 90% appreciation target.
Let's take another look at this firm and see if it still deserves a spot on this website.
1. What does this company actually do?
According to the Yahoo "Profile" on ResMed (RMD), the company
"... through its subsidiaries, engages in the design, manufacture, and marketing of equipment for the diagnosis and treatment of sleep-disordered breathing and other respiratory disorders, including obstructive sleep apnea. Its products include airflow generators; diagnostic products; mask systems; headgear; and other accessories, including humidifiers, cold passover humidifiers, carry bags, breathing circuits, Twister remote, the Aero-Click connection system, and the AeroFix headgear."
2. How did the company do in the latest quarter?
On August 17, 2006, ResMed reported their 4th quarter 2006 results. For the quarter ended June 30, 2006, revenue grew 36% to $171.2 million, up from $125.4 million the prior year same period. Diluted eps came in at $.30, up from $.22/share last year. Net income was $23.1 million, up sharply from $15.6 million in the same period the prior year.
3. How about longer-term results?
 Reviewing the Morningstar.com "5-Yr Restated" financials, we see a genuinely beautiful picture of steadily increasing revenue as represented by the increasing purple bars on the bar graph. Revenue has increased from $155.2 million in 2001 to $425.5 million in 2005 and $561.2 million in the trailing twelve months (TTM).
On a per-share basis, the company has reported earnings/share of $.18 in 2001, growing steadily and strongly to $.91/share in 2005 and $1.09/share in the TTM.
The company has not paid dividends and has increased the number of shares outstanding slightly from 63 million in 2001 to 69 million in 2005. 75 million shares were outstanding in the TTM. Thus, the float has grown about 16% from 2001 to currently, while revenue has almost gone up 400% and earnings are up more than 400% as well.
Free cash flow has been positive except for the latest twelve months. $34 million in free cash flow in 2003, $19 million in 2004, $31 million in 2005, and $(8) million in the TTM. The negative free cash flow reflects the large increase in capital spending in the latest twelve months.
ResMed's balance sheet looks solid as presented on Morningstar.com with $168.2 million in cash and $264.5 million in other current assets. Thus, the total current assets of $432.7 million when compared to the $110.5 million in current liabilities yields a current ratio of 3.92. (I generally conclude that ratios over 1.5 represent a healthy balance sheet from this particular perspective). The current assets can easily pay off the current assets and the $114.3 million in long-term liabilities combined....again supporting the healthy balance sheet of this company.
4. What about some valuation numbers on this stock?
Reviewing the data from Yahoo "Key Statistics" on RMD we find that this stock is a large mid-cap stock with a market capitalization of $3.08 billion. The trailing p/e is a fully-valued 35.02, with a foward p/e (fye 30-Jun-08) of 20.82. The (5-yr expected) PEG is a more reasonable 1.24.
Referring to the Fidelity.com eresearch website, we find that this stock is in the "Medical Appliances/Equipment" industrial group. Within this group, ResMed is the most 'expensive' relative to the Price/Sales ratio with a ratio of 5.6. Following RMD is Zimmer Holdings (ZMH) at 5, Medtronic (MDT) at 4.7, St. Jude (STJ) at 4.5, Biomet (BMET) at 4, and Edward Lifesciences (EW) at 3.
Examining the company for profitability, in terms of the Return on Equity (ROE), ResMed is actually one of the least profitable in its group with a ROE of 14.8%. Topping this group is Medtronic at 26.8%, followed by Biomet at 25%, Edwards Lifesciences at 16.6%, Zimmeer Holdings at 16.3%, St. Jude at 15.8% and then ResMed at the bottom of this group.
Yahoo reports that there are 75.41 million shares outstanding with 73.03 million shares that float. Currently 2.93 million shares are out short representing 4.10% of the float or 5.9 trading days of average volume. Using my own 3 day rule for the short ratio, this stock does appear to have a significant number of shares that have been already sold by short-sellers speculating that the stock will decline. In the event of good news we may see a bit of a squeeze of these short-sellers.
No dividend is paid and the last stock split was a 2:1 stock split on October 3, 2005.
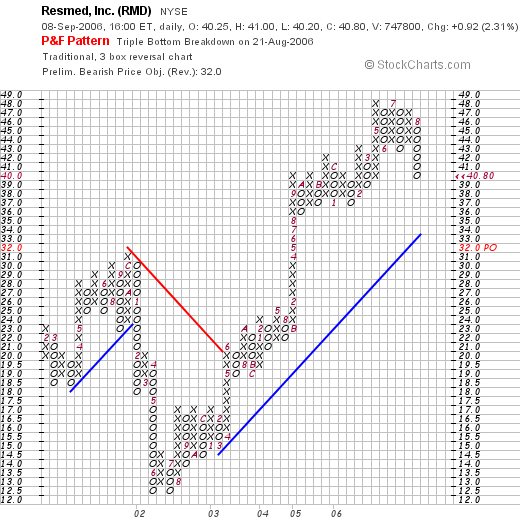
5. What does the chart look like?
Reviewing the "Point & Figure" chart on RMD from StockCharts.com, we can see that although the stock has pulled back recently from its highs near $48, the stock is still well above its support level which would be down in the mid $30's. The stock did retreat from $30 in October, 2001, to a low of $13 in June, 2002, but since that time, the stock appears to be moving strongly higher.
6. Summary: What do I think about this stock? Reviewing some of the things discussed earlier, the company is trading currently a little below its recent highs. The latest quarterly report was quite strong, with both steady revenue and earnings growth. The Morningstar numbers look nice with steady revenue and earnings growth over the past five years with just a slight increase in the stock shares outstanding. Free cash flow was negative in the TTM, but otherwise has been positive. The balance sheet is solid. Valuation is a bit rich, but with the rapid growth in revenue and earnings, the PEG works out to a bit over 1.2. Price/Sales is rather rich, and the profitability (ROE) is less than stellar. Supporting the stock price, ironically, may be the relative large number of short-sellers placing bets on the stock. On a Peter Lynch perspective, the market for CPAP machines may continue to grow as the number of overweight individuals grows worldwide and our understanding of sleep apnea improves. I shall be staying with the stock and shall be selling based on the price performance of the shares.
Thanks so much for stopping by and visiting! If you have any comments or questions, please feel free to email me at bobsadviceforstocks@lycos.com and also please be sure to stop by and visit my Stock Picks Podcast Site.
Bob
Posted by bobsadviceforstocks at 6:41 PM CDT
|
Post Comment |
Permalink
Updated: Saturday, 9 September 2006 11:31 PM CDT
"Looking Back One Year" A review of stock picks from the week of May 9, 2005
Hello Friends! Thanks so much for stopping by and visiting my blog, Stock Picks Bob's Advice! As always, please remember that I am an amateur investor, so please remember to consult with your professional investment advisors prior to making any investment decisions based on information on this website.
Once again it is the weekend! And one of the tasks I like to perform around this website is to check back on prior stock picks and see how they turned out! Last Week I reviewed the week of May 2, 2005. This afternoon, I would like to take a look at those stocks selected for inclusion from the week of May 9, 2005.
Please note that this review assumes a buy and hold strategy of investing. My analysis assumes an equal dollar purchase of each of the stocks selected that week. Currently I employ an active portfolio management system that sells declining stocks quickly at small losses and sells portions of appreciating stocks at targeted appreciation points. This difference in strategy would certainly affect a portfolio performance in practice. Also please recall that past performance is never a guarantee of future performance whether you are looking at a mutual fund or an individual equity or any investment actually!
 On May 9, 2005, I posted Part Technology (PTC) on Stock Picks Bob's Advice when the stock was trading at $22.17. PTC had a 3:2 stock split on January 9, 2006 making my effective stock pick price $14.78. PTC closed at $8.88 on September 8, 2006, for a loss of $(5.90) or (40)% since the stock pick.
 On July 26, 2006, PAR announced 2nd quarter 2006 results. Revenues came in at $53.3 million, a 4% increase over the $51.2 million reported in the same period the prior year. Net income, however, dipped to $2.34 million this quarter from $2.35 million in the prior year. On a per share basis, this was flat at $.16/share, unchanged from $.16/share last year.
 On May 11, 2005, I posted Varian Medical Systems on Stock Picks Bob's Advice when the stock was trading at $35.10. Varian closed at $52.63 on September 8, 2006, for a gain of $17.53 or 50%.
On July 26, 2006, Varian reported 3rd quarter 2006 results. Revenues grew 14% to $396 million from $347 million in the same period last year. Net earnings climbed to $65.7 million, up from $51.1 million last year. On a diluted share basis this worked out to $.49/share this year vs. $.37/share in the same period last year.
 Finally, on May 12, 2005, I posted Pall Corporation (PLL) on Stock Picks Bob's Advice when the stock was trading at $28.58. Pall closed at $27.20 on September 8, 2006, for a loss of $(1.38) or (4.8)% since posting.
On June 1, 2006, Pall announced 3rd quarter 2006 results. While revenue came in at $510 million, up from $493.5 million, this was actually shy of expected revenue of $515 million. Earnings, however, came in at $.20/share, down from $.35/share last year in the same period. This was also far short of analysts expectations of $.38/share.
So how did I do with these three stock picks from that week in May, 2005? In a word, mediocre. I had one terrific stock pick, Varian, one awful pick, Part Technology, and a mediocre pick in Pall. The average performance for the three stocks worked out to a gain of 1.7%. Nothing really to write home about I guess.
Thanks again for visiting! If you have any comments or questions, please feel free to leave them on the blog or email me at bobsadviceforstocks@lycos.com. Also, please remember to stop by and visit my Stock Picks Podcast Site where I occasionally make time to talk about and not merely write about these stocks!
Bob
Tuesday, 5 September 2006
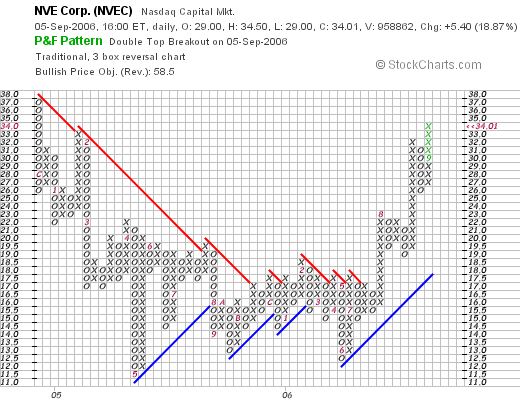
"Revisiting a Stock Pick" NVE Corporation (NVEC)
Hello Friends! Thanks so much for stopping by and visiting my blog, Stock Picks Bob's Advice! As always, please remember that I am an amateur investor, so please remember to consult with your professional investment advisors prior to making any investment decisions based on information on this website.
I didn't manage to make any stock 'picks' last week and am anxious to find some stocks that are provocative enough to find a place on this website. Looking through the list of top % gainers on the NASDAQ this afternoon, I came across an old favorite of mine, NVE Corporation (NVEC) which had a nice day in the market.
 I first posted NVEC on Stock Picks Bob's Advice on June 23, 2004, when the stock was trading at $36.61. NVEC closed today at $34.01, up $5.40 or 18.87% on the day. The stock is actually lower than it was when I first posted it by $(2.60) or (7.1)%. After the initial posting of this stock, the price of the stock actually took a nosedive (!) and is only now reaching the previous price levels.
Let's take a closer look at this company and I will explain why I still like this stock after it failed to cooperate at my first post over two years ago:
1. What exactly does this company do?
According to the Yahoo "Profile" on NVEC, the company
"... engages in the development and sale of devices using spintronics, a nanotechnology, which utilizes electron spin rather than electron charge to acquire, store, and transmit information. Its products include magnetic sensors to acquire precise data, such as the position of a robot arm, and couplers to transmit data between electronic systems at a high speed. The company provides standard sensors that detect the presence of a magnet or metal to determine position or speed; custom sensors primarily for medical devices; and couplers that use semiconductor input stages, primarily for factory and industrial networks."
Please don't ask me to explain the above hi-tech explanation :). I am not really a Peter Lynch investor! I pick stocks not on the basis of what I know about their product but what I know and can glean about their corporate performance.
2. How did they do in the latest quarter?
On July 19, 2006, NVE Corporation reported 1st quarter 2007 results. Product sales climbed 71% to $3.05 million from the prior year first quarter results of revenue of $1.78 million. Total sales increased 20% to $3.64 million from $3.03 million. Net income was up over 100% at $891,806 or $.19/share up from net income of $412,649 or $.09/diluted share the prior year same period.
3. How about longer-term results?
If we review the Morningstar.com "5-Yr Restated" financials on NVEC, we can see that revenue has grown nicely from $7 million in 2002 to $12.2 million in 2006 and $12.8 million in the trailing twelve months (TTM).
Except for a dip in earnings between 2004 and 2005, earnings per share have grown steadily from a loss of $(.62)/share in 2002 to $.39/share in 2006 and $.49/share in the trailing twelve months (TTM). This is a small company with 4 million shares outstanding in 2004 increasing to 5 million in the TTM.
Free cash flow which was $-0- in 2004, increased to $3 million in 2006. The balance sheet appears solid on Morningstar, with $2.5 milliion in cash, enough to pay off the $700,000 in current liabilities. No long-term liabilities are even reported on the Morningstar report.
Calculating the 'current ratio', adding the $2.5 million in cash to the $5.9 million in other current assets gives us total current assets of $8.4 million, which when compared to the current liabilities of $.7 million yields a current ratio of 12. Generally ratios of 1.5 or higher are considered financially 'healthy'.
4. What about some 'valuation' numbers?
Reviewing the Yahoo "Key Statistics" on NVE Corporation, we can see that this is a really small small-cap stock with a market capitalization of only $156.99 million. (At $100 million in market cap or less, I like to refer to these tiny companis as 'micro'-cap stocks).
The trailing p/e is rich at 69.69. There is no forward p/e and no PEG to assess valuation. I suspect this company is below the radar of most analysts.
Review the Fidelity.com eresearch website for more valuation comparisons on NVEC, we find that this company is in the "Semiconductor-Specialized" industrial group. Within this group, NVEC is the richest in valuation relative to the Price/Sales ratio with a ratio of 10.5. This is followed by Linear Technology (LLTC) at 10.1, Altera (ALTR) at 6.6, Xilinx (XLNX) at 4.4, Nvidia (NVDA) at 4.4, and ATI Technologies (ATYT) at 2.4.
NVEC is in the middle of the group in terms of profitability when measured by the Return on Equity (ROE). Topping the group is Nvidia at 23.1%, Altera at 20.9%, Linear Technology at 20.2%, then NVE Corp at 14.2%, Xilinx at 13.2% and ATI Technologies at the bottom of the pack at a negative (3.3)%.
Returning to Yahoo for a few additional valuation numbers, we find that there are 4.62 million shares outstanding and 4.25 million that float. Of these shares, 1.02 million shares or 22.70% of the float were out short as of 8/10/06. The sharp upward rise in the stock price today might well represent a short squeeze in which the large number of short sellers might be in a buying panic as the stock rises and paradoxically increases their losses. No dividend is paid and the last stock split was actually a reverse stock split of 1:5 on 11/22/02.
5. What does the chart look like?
Reviewing the "Point & Figure" chart from StockCharts.com on NVEC, we can see that the stock has mad a "u-shaped" chart with the stock declining from $37 level in late 2004 and bottoming at around $11.50 in May, 2005. The stock recently came out of this trough after breaking through resistance at $17 in July, 2006, and appears to be moving strongly higher now.
6. Summary: So what do I think about this stock?
In summary, this stock had a strong recent quarter. I cannot completely explain today's move except that a move higher may well have resulted in a panic among the short-sellers trying to cover their positions. The Morningstar.com financials look nice. Valuation, however, is a bit rich with a p/e in the 60's and a Price/Sales ratio at the top of its group. Technically, the stock looks strong with the stock price moving higher into near new-high territory. I don't have any shares of this stock, but if I were in a position to be buying stock, this is the kind of stock I would be adding to my portfolio.
Thanks so much for stopping by and visiting my blog! If you have any comments or questions, please feel free to email me at bobsadviceforstocks@lycos.com and be sure to listen to my Stock Picks Podcast!
Bob
Newer | Latest | Older


