Hello Friends! Thanks so much for stopping by and visiting my blog, Stock Picks Bob's Advice. Please always remember that I am an amateur investor so please, as I always suggest, consult with your professional investment advisors prior to making any investment decisions based on information on this website!
 Looking through the lists of top % gainers today, I didn't see any new stocks that really fit my strategy and came across one that after checking, I realized I wrote up last year! Amedisys (AMED) had a great day today, closing at $33.84, up $3.21 or 10.48% on the day! I first posted Amedisys on Stock Picks on 6/21/04 when it was trading at $30.74. Thus, the stock really hasn't gotten away from us!
 I do not own any shares of AMED or have any options, nor does any member of my family!
 According to the Yahoo "Profile" on Amedisys, AMED "...is a multi-state provider of home healthcare nursing services."
As is so often the case, what drove the stock higher today was a 1st quarter 2005 earnings report which was reported just prior to the market opening today. For the quarter ended March 31, 2005, net service revenue increased by 49% to $70.4 million from $47.3 million last year. Net income came in at $7.1 million or $.45/diluted share, up from $4.2 million or $.34/diluted share last year. The company also increased guidance for 2005. This was a great stock report and the market liked what it saw!
How about longer-term? I strongly believe that it is the persistence of revenue and earnings growth that propels a stock higher....and that an extended period of prior growth is as good an indication as any of future persistence of the same results.
For this longer-term result I like to turn to Morningstar. In particular, I find the "5-Yr Restated" financials on Morningstar the most helpful. Here we can see that except for a dip in revenue from $97.4 million in 1999, to $88.2 million in 2000, revenue has grown strongly from that level to $204.8 million in the trailing twelve months (TTM).
 Earnings, however, have been a bit erratic dropping from $.87 in 2000 to a low of $.08/share in 2002, but since then have been improving strongly to a level of $1.43 in the TTM.
Free cash flow has also been steadily growing from $(2) million in 2001, $12 million in 2002, $20 million in 2003 and $27 million in the trailing twelve months.
The balance sheet is very pretty with $93.2 million in cash, enough to pay both the $40 million in current liabilities and the smallish $6.9 million in long-term liabilities, approximately two times over. In addition, AMED has another $22.0 million in other current assets.
What about some "valuation" statistics and other measurements on AMED? Looking at Yahoo "Key Statistics" on Amedisys, we can see that this is a 'small' mid-cap stock with a market capitalization of $519.78 million. The trailing p/e is reasonable at 22.40 and the forward p/e (fye 31-Dec-06) is even nicer at 15.74 (based on estimates), and thus the 5-yr estimated PEG is 1.13.
Price/sales is 2.07. Although seemingly reasonable, compared to other stocks in the "Home Health Care" group, this is a bit steep. Matria Healthcare (MATR) has a price/sales ratio of 1.5, Option Care (OPTN) is at 1.1, American Healthcare Group (AHG) is at 1.0, and Hooper Holmes (HH) is at 0.7.
Yahoo shows that AMED has only 15.36 million shares outstanding with 10 million of them that float. Of these, there were 2.01 million shares out short as of 4/8/05, down from 2.06 million the prior month. However, this represents 20.10% of the float or 6.301 trading days of volume. As the stock moves higher, this relatively large short interest may well help propel the stock to even higher levels as the "short" sellers return to cover!
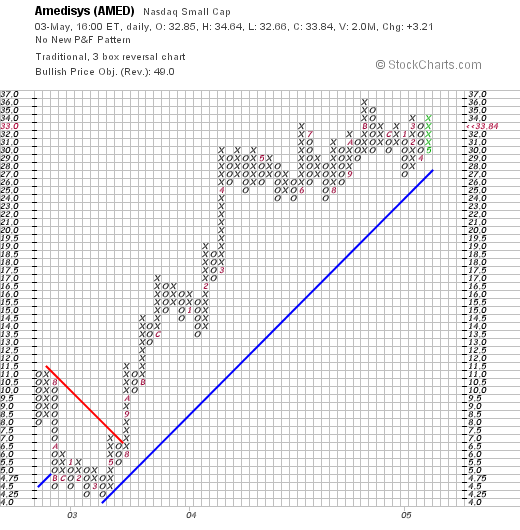
Finally what does the chart look like? Taking a look at the the chart,

it actually looks quite strong since February, 2003, when the stock price was bottoming at around $4.25. Since then, the price has climbed steadily to the $33.84 level.
So what do I think? Well, in summary, the stock made a nice move higher today on a strong quarterly report. As a plus, the company guided higher yet. The revenue record is solid, the earnings are more erratic, the free cash flow is attractive, and the balance sheet is solid. Valuation-wise, the p/e and PEG are reasonable. Turns out the Price/Sales ratio makes AMED appear a bit pricey. The graph looks great!
Now, if I were in the market to buy some stock I might just be picking up some shares of this one! However, since I am just sitting on my hands, waiting for a partial sale at a gain as a 'signal' to purchase another position, well, I just won't be buying anything anyhow! Thanks again for stopping by! If you have any comments or questions, please feel free to elave them right here on the blog or email me at bobsadviceforstocks@lycos.com.
Bob
Updated: Tuesday, 3 May 2005 10:55 PM CDT


