Hello Friends! Thanks so much for stopping by and visiting my blog, Stock Picks Bob's Advice. As always please remember that I am an amateur investor, so please remember to consult with your professional investment advisors prior to making any investment decisions based on information on this website.
 I was scanning the list of top % gainers on the NYSE today, and came across an old favorite of mine, Aviall (AVL) which as I write is trading at $35.28, up $1.28 or 3.76% on the day. I do not own any shares of this stock nor do I own any options.
 I first posted Aviall (AVL) on Stock Picks Bob's Advice on September 7, 2004, when the stock was trading at $21.30. With the stock currently trading at $35.28, this represents a gain of $13.95 or 65.5% since posting the stock here.
Let's take a closer look at this company. First of all, according to the Yahoo "Profile" on Aviall, the company
"...through its subsidiaries, Aviall Services, Inc. (ASI), and Inventory Locator Service, LLC, (ILS) provides aftermarket supply-chain management services for the aerospace, defense, and marine industries worldwide. ASI purchases various new aviation parts, components, and supplies from original equipment manufacturers and resells them to government, military, general aviation, corporate, and commercial airline customers. It offers aviation batteries, hoses, wheels and brakes, oxygen, and paint services. ASI also provides services, such as repair and assembly, supply-chain management, and information-gathering and delivery."
 And how about the latest quarterly report? On January 31, 2006, Aviall (AVL) reported 4th quarter 2005 results. Sales climbed 28% to $347.9 million from $271.7 million in the same quarter last year. Net income grow to $13.9 million or $.40/share, up from $9.7 million or $.30/share in the same quarter last year.
And longer-term? Looking at the Morningstar.com "5-Yr Restated" financials, we can see a steady growth in revenue from $486 million in 2000 to $1.16 billion in 2004 and $1.21 billion in the trailing twelve months (TTM). Earnings have been a bit erratic with $.14/share in 2001, dropping to a loss of $(.29)/share in 2003, then increasing to $1.28 in 2004 and $1.50 in the TTM. Shares outstanding have grown significantly from 19 million in 2001 to 34 million in the TTM.
Free cash flow has 'bounced around' a little with $(44) million in 2002, increasing to $70 million in 2004 and $22 million in the TTM.
The balance sheet as presented by Morningstar.com looks solid with $6.0 million in cash and $555.8 million in other current assets, enough to cover the $243 million in current liabilities more than 2x over. The current assets can cover the current liabilities and the $207.2 million in long-term liabilities combined.
 And what about some valuation numbers on this stock? Looking at Yahoo "Key Statistics" on Aviall (AVL), we find that the stock is a mid-cap stock with a market capitalization of $1.2 billion. The trailing p/e is moderate at 23.38. The forward p/e (fye 31-Dec-06) is even nicer at 18.75. The PEG (5 yr expected) works out to 1.57. PEG's 1.5 or lower are attractive for investment.
Aviall is part of the "Aerospace/Defense-Products/Services" industrial group according to the Fidelity.com eResearch website. Within this group, AVL is reasonably priced in terms of the Price/Sales ratio. Topping this group is Rockwell Collins with a Price/Sales ratio of 2.4. Aviall, DRS Technologies, and EDO all come in with a ratio of 1.0. This is followed by Alliant Techsystems at 0.9, and Orbital Sciences at 0.8.
Going back to Yahoo, we find that there are 34.08 million shares outstanding ant as of January 10, 2005, there were 2.99 million shares out short representing 7.3 trading days of volume. With the great earnings and upward move to the stock, I wouldn't be surprised to learn that some of the buying pressure is from shorts who are scrambline to limit their losses as the stock climbs in price. No cash dividend and no stock dividends are recorded on Yahoo.
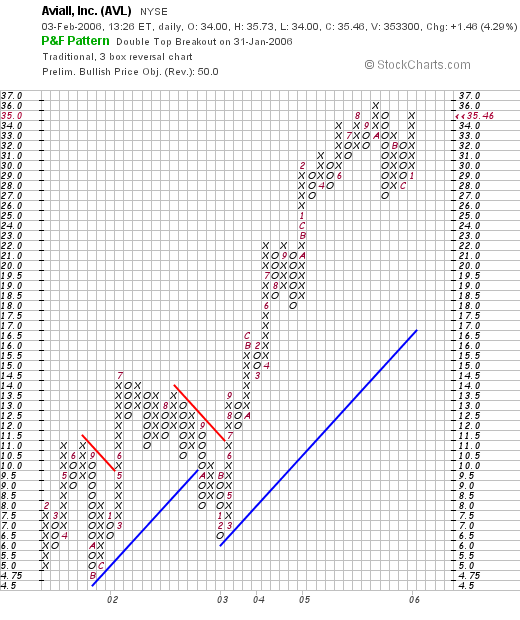
What about the chart? Looking at the "Point & Figure" chart on Aviall from Stockcharts.com:

We can see a very pretty picture with the stock climbing strongly from February, 2001, when the stock was trading at $8.000 down to a level of $4.75 in August, 2001. The stock later climbed higher but broke down once again in September, 2002. By June, 2003, the stock had broken through resistance at $11 and has not looked back yet.
So what do I think? Well the stock is moving higher nicely today in an otherwise weak market, the latest quarterly report was quite strong, the history of revenue growth has been solid, with earnings a little less consistent but increasing nicely the past few years. Free cash is positive and the balance sheet looks strong. Valuation is reasonable and the chart looks strong.
Anyhow, I don't have any money to be buying any stock today, but if I were, this is the kind of company that I have looked at in the past and desereves your attention today. If you have any comments or questions, please feel free to leave them on the blog or email me at bobsadviceforstocks@lycos.com.
Bob


