Stock Picks Bob's Advice
Wednesday, 17 September 2008
Greif (GEF) "Trading Transparency"
Hello Friends! Thanks so much for stopping by and visiting my blog, Stock Picks Bob's Advice! As always, please remember that I am an amateur investor, so please remember to consult with your professional investment advisers prior to making any investment decisions based on information on this website.
 I wanted to update all of you readers with a trade that I did yesterday. And yet, even though it conforms to my own strategy of maintaining my 5 position minimum, I am starting to have some buyer's remorse.
The market is really ugly this week. As I write, the Dow is trading at 10,724.22, down (334.80), the Nasdaq is at 2,128.48, down (79.42) and the S&P is declining by (44.27) at 1,169.18. Yikes.
My good friend Bob S. has been stopping by my blog. He is one of a group of us who frequent Grounded Specialty Coffee in the morning and shoot the bull about the economy, the stock market, politics, and whoever happens to drop by to get a cup of java. And he has been after me about WHY I don't talk about the terrible correction in the market. What is an investor to do?
I have little words of advice for my friends. I do believe that as we build portfolios, we should prepare for the worst of world and hope for the best of investments. We should have built into our holdings known exit points, both on 'good' and 'bad' news. I do that.
But as evidenced by my own purchase yesterday of shares of Greif (GEF) to get me back to the 5 position minimum, even I am fallible. I like Greif and will discuss it further below, but with the market meltdown continuing, the best I can do is:
GREIF (GEF) IS RATED A HOLD
Greif has been an old favorite of mine. I have even owned shares of this stock on and off. Let me very briefly touch on some of the things I do like about this stock.
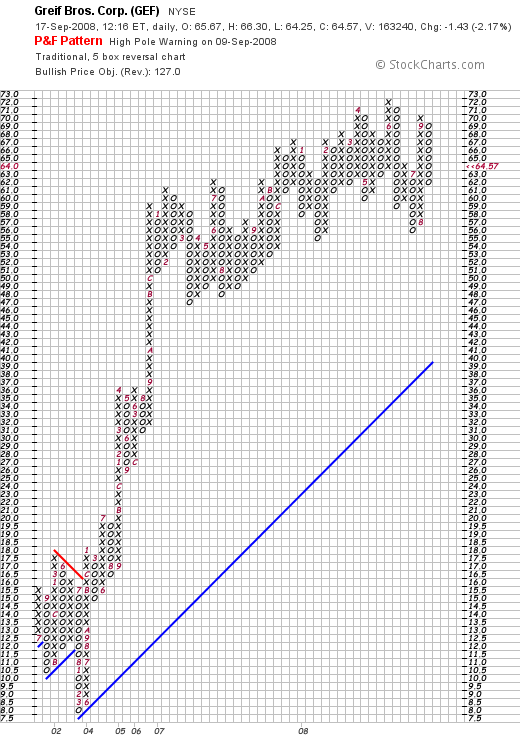
But before I do, let me review my own purchase. Yesterday I purchased 140 shares of Greif (GEF) at $66.104. As I write, I am already, as you might expect, losing money on Greif (GEF) which is trading at $64.27, down $(1.73) or (2.62)% on the day.
On a day like this, there are very few places to find a bull market in stocks.
Some things I like about Greif (GEF), (even while I do not like the current tone in this plunging market), include the latest quarter announced August 27, 2008, which beat expectations and they raised guidance.
Their '5-Yr Restated' financials from Morningstar.com look terrific.
Finally, their 'point & figure' chart from StockCharts.com still looks solid:
So much for Greif.
But what about the ENTIRE market. What about the "M" in CAN SLIM?
I have been an investor for 41 years now. Seriously. I can remember 1987 without much difficulty. This seems much worse.
We really need to go back to 1929 to get to something like this.
No kidding.
I might just even sell all of my holdings and take a 'time out'. Seriously.
I shall keep you posted.
Yours in investing,
Bob
Monday, 15 September 2008
Robbins & Myers (RBN) "Trading Transparency"
Hello Friends! Thanks so much for stopping by and visiting my blog, Stock Picks Bob's Advice! As always, please remember that I am an amateur investor, so please remember to consult with your professional investment advisers prior to making any investment decisions based on information on this website.
I really HATE buying a stock one day and then selling it a few days later. It really stinks. No kidding.
 On September 11, 2008, just 4 days ago (!) I purchased 210 shares of Robbins & Myers (RBN) at a cost basis of $38.21/share. Today, I sold my 210 shares at $35.0832. That represented a loss of $(3.13)/share or (8.2)% since purchase.
As you probably know (!) it was a pretty awful day in the market. The Dow closed down (503.99) to 10,917.51, and oil dropped $(5.47) to $95.71/barrel.
With the stock declining tied to something fundamental like the price of oil, I sold my shares and am downgrading my "buy":
ROBBINS AND MYERS (RBN) IS RATED A SELL
I don't like selling my own shares and leaving the rating at a "buy" either. Just doesn't seem right. But I do this if there is nothing what I would call "fundamentally" wrong with the stock. In this case, the stock is trading as an oil-related holding (again like Graham (GHM)), and with the price of oil continuing to break down, there is little reason for me to even leave RBN at a 'hold'. Anyhow, that's my rationale. Above all, remember that I am an amateur!
Since I was down at 5 positions, and this puts me at 4, paradoxically this sale actually gives me a "buy signal" since I was at my 'minimum' holding level of 5 positions.
I shall wait for something positive in the market and start scanning the lists of top % gainers when that happens. I am not in a hurry.
Thanks so much for stopping by and visiting my blog! If you have any comments or questions, please feel free to leave them right here or email me at bobsadviceforstocks@lycos.com.
Yours in investing,
Bob
Thursday, 11 September 2008
Quality Systems (QSII) and Robbins & Myers (RBN) "Trading Transparency"
Hello Friends! Thanks so much for stopping by and visiting my blog, Stock Picks Bob's Advice! As always, please remember that I am an amateur investor, so please remember to consult with your professional investment advisers prior to making any investment decisions based on information on this website.
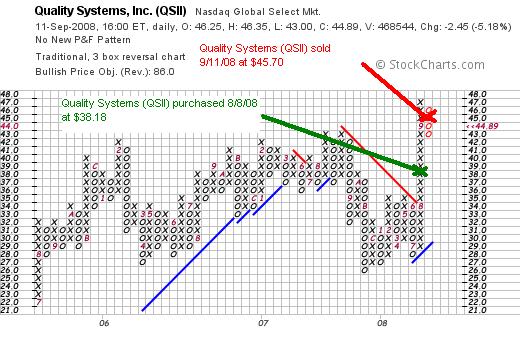
 One of the strongest stocks in my portfolio the past two months has been Quality Systems (QSII). After purchasing this at a cost basis of approximately $38.18 just last month on August 8, 2008, the stock has moved sharply higher. QSII closed today at $44.89, well above my purchase price, but down $(2.15) or (4.57)% on the day.
Earlier today, with the market turning higher after a sell-off, I found myself seeing QSII moving sharply lower, lagging the rest of the portfolio.
Although the fundamentals remain sound, I am quite aware of my overall performance and my 'followers' over at the Covestor Website, and my desire to continue to tightly monitor my holdings.
I went ahead and sold my 182 shares of Quality Systems (QSII) at $45.70/share. As I have just written, these shares were purchased 8/8/08 at an average cost of approximately $38.18. Thus, the sale today represented a gain of $7.52 or 19.7% on these shares in just over a month.
I can live with that I guess.
Since I have sold my shares and there are no underlying fundamental change that I can detect to the company itself, I am still reducing my rating but not to a "sell":
QUALITY SYSTEMS (QSII) IS RATED A HOLD
But what to do with the proceeds? I really wasn't entitled to 'sit on my hands' and move it to cash. So needing a new position, I checked the list of top % gainers on the NYSE to see what was moving higher today.
Checking the list of top % gainers on the NYSE, I came across Robbins & Myers (RBN) which appeared to fit the bill. I purchased 210 shares of RBN at $38.169 earlier today. The stock actually sold off a bit after my purchase and dropped off the list of top % gainers. Robbins & Myers (RBN) closed at $37.63, up $2.05 or 5.76% on the day. This was about $.50 below my purchase price.
ROBBINS & MYERS (RBN) IS RATED A BUY
Let me briefly try to share with you my thinking behind this purchase.
First of all what exactly does this company do?
According to the Yahoo "Profile" on RBN, the company
 "...and its subsidiaries supply engineered equipment and systems for various applications in energy, industrial, chemical, and pharmaceutical markets worldwide."
Perhaps coincidentally, the company sounds a bit familiar with another company that I recently sold--Graham (GHM).
Was there any news to explain today's move higher?
As reported yesterday:
"BB&T’s investment upgrade helped the stock jump up $4.09 per share to $35.72 during Wednesday afternoon trading.
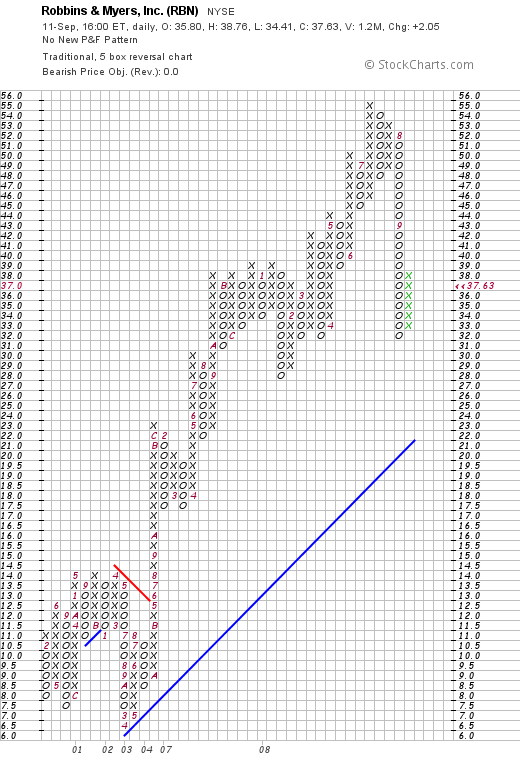
Robbins & Myers (NYSE: RBN) is an industrial equipment maker that had seen its stock raise throughout the summer, to a high of $54.20 per share on July 22, but then plummet to $31.63 as of yesterday."
Apparently, the analysts at BB&T Capital Markets felt that the selling had been 'overdone' so they upgraded the stock on valuation and the stock moved higher yesterday and followed through again today.
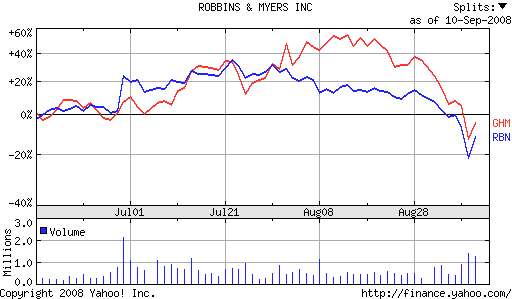
(It is interesting that we can see these two stocks (GHM and RBN) trading similarly the past month!)
Anyhow, hoping that this bounce would be a bit longer-lasting than 48 hours, I purchased shares. Wish me luck! I certainly also looked at some of the fundamentals that I like to check before purchasing any shares!
For example,
How did they do in the latest quarter?
On June 30, 2008, Robbins & Myers (RBN) reported 3rd quarter 2008 results. Sales for the quarter grew 17% to $201 million compared to $171.4 million in the same period the prior year. Third quarter earnings before one time benefit from product line sales, came in at $40 million, up 47% over the prior year. This worked out to $.76/diluted share, up from $.39/share last year.
The company also beat expectations for the quarter and also raised guidance for the fiscal-year profit outlook.
What about longer-term results?
Checking the Morningstar.com '5-Yr Restated' financials, we can see that revenue has steadily increased from 2003 when the company reported $561 million in sales to 2007 at $695 million and $766 million for the trailing twelve months.
Earnings have been much more erratic dipping from $.51/share in 2003 down to a low of a loss of $(.66)/share in 2006, reverting to a profit at $1.48/share in 2007 and $2.19/share in the TTM.
The company paid $.11/share in dividends in 2003, increased it to $.13/share in 2007 and now has paid $.14/share in the TTM.
Outstanding shares show mild dilution with 28 million reported in 2003, increasing to 34 million in 2006 where they remain. Free cash flow has been increasing recently from $6 million in 2005 to $49 million in 2007 and $87 million in the TTM.
The balance sheet appears adequate with $92 million in cash and $294 million in other current assets. This total of $386 million in current assets, when compared to the $196.5 million in current liabilities yields a current ratio of 1.96. The company has an additional $155.5 million in long-term liabilities according to Morningstar.
What about some valuation numbers on this stock?
According to the Yahoo "Key Statistics" on RBN, this stock is a mid cap stock with a market capitalization of $1.3 billion. The trailing p/e is a moderate 17.15 with a forward p/e (fye 31-Aug-09) even nicer at 14.93. With rapid growth in earnings, the PEG (5 yr expected) works out to an even nicer level of 0.62.
Examining the Fidelity.com eresearch website for some valuation numbers, we find that the Price/Sales (TTM) is a bit rich relative to its peers, coming in at 1.60 with an industry average currently indicated at 1.07. Also, when measured by the Return on Equity (TTM), the company is valued a bit steeply relative to its peers with a ROE of 16.97% compared to the industry average of 20.79%.
Finishing up with Yahoo, we can see that there are only 34.62 million shares outstanding with 33.71 million that float. Currently (8/12/08) there are 2.23 million shares out short representing 3.8 trading days of volume. This is just slightly higher than my own '3 day rule' for short interest.
Yahoo indicates that the stock is paying a 12 month $.15/share dividend yielding 0.5%. The company last split its stock February 29, 2008, when they split 2:1.
What does the chart look like?
Looking at the 'point & figure' chart on RBN from StockCharts.com, we can see the steady appreciation from a low of $6.50 in April, 2003, to a recent high of $55 in July, 2008, only to see the stock dip as low as $32 this month. The stock is currenly rebounding from the recent low. The overall upward move of this stock appears intact.
Summary: What do I think?
First of all, I exercised impatience with Quality Systems (QSII) which has already moved nicely higher this past month. I still like that stock, but wanted to see if I could avoid the apparent sell-off and instead hop onto a stock moving higher.
Time will tell if this particular strategy will be successful. It is not exactly part of my usual portfolio strategy, but is something I have been incorporating into my approach the past few months.
Regarding Robbins & Myers, it has suffered the same fate as Graham (GHM) which is the decline that is related most likely to the sharp correction in the oil market. If those prices continue to decline further, I may find myself with another declining stock like Graham. That probably is the biggest risk to this particular move.
Otherwise, I like the stock upgrade, the recent quarterly report that beat expectations and found the company raising guidance. Furthermore, I like the 5-Yr Restated financials showing the steady revenue growth, the recent return to profitability, the fact that the company pays a dividend and has been increasing it recently and the nice results for free cash flow growth. The balance sheet appears solid and valuation is reasonable if not terrific. The PEG is well under 1.0. And the chart shows that the sharp recent correction may well be overdone.
Beyond that, I shall certainly limit any downside on this stock or any of my purchases to (8)%. Hopefully, I shall be able to miss that decline and instead particiapate in the rebound in price.
Thanks again for visiting. I apologize for not blogging more, but I shall do my best to continue to post on a timely basis. If you have any comments or questions, please feel free to leave them on the blog or email me at bobsadviceforstocks@lycos.com.
If you get a chance, be sure and visit my Covestor Page, my SocialPicks page, and my Podcast Page. Hopefully I shall be able to get another podcast up soon. Life as an amateur can be hectic :).
Yours in investing,
Bob
Thursday, 4 September 2008
Johnson Controls (JCI) "Trading Transparency"
Hello Friends! Thanks so much for stopping by and visiting my blog, Stock Picks Bob's Advice! As always, please remember that I am an amateur investor, so please remember to consult with your professional investment advisors prior to making any investment decisions based on information on this website.
 One of the hardest things about being a blogger, and now a Seeking Alpha contributor, is the necessity of doing everything so publicly! I just got around to posting about my 'brilliant' decision to switch my Graham (GHM) holdings into Johnson Controls (JCI) and now my entire plan is hitting headwinds. Perhaps a bit of turbulence from Gustav?
It is my strategy to sell a holding should it hit an 8% loss. I don't really care whether that holding has been held for a year or 15 minutes. After an initial purchase, if that stock drops the required 8% out it goes.
And Johnson Controls (JCI) hit that (8)% loss for me this morning. And I sold my shares.
In fact, I sold my 210 shares of JCI at $29.5223. These shares were just purchased two days ago (yikes!) at a price of $32.0477. Thus, they had declined by $(2.5254) or (7.88)%. JCI as I write is trading at $29.47, down $(1.05) or (3.44)% on the day.
While Johnson Controls has indeed been talking about steps it will take to deal with the slowdown in the auto industry and the slowdown in construction---including taking a $450 to $500 million charge to account for the cutting of jobs and closing of plants---probably the biggest thing driving this stock down today is the overall market, which as I write, the Dow is down (281.30) points at 11,251.58, and the Nasdaq is down (58.91) points at 2,274.82. The market is down even with oil showing continued weakness, trading at $107.20 down $(2.15) on the day.
I still am long-term a fan of Johnson Controls (JCI), so even though my trading system requires me to be a seller of shares, my rating is being reduced:
JOHNSON CONTROLS (JCI) IS RATED A HOLD
And with my sale on 'bad news', I shall be 'sitting on my hands' with the proceeds, waiting for one of my other holdings to hit a sale on an appreciation target, what I call 'good news' prior to looking for a new position in which to place the proceeds.
Thanks again for visiting my blog! If you have any comments or questions, please feel free to leave them on the website or email me at bobsadviceforstocks@lycos.com.
Yous in investing,
Bob
Tuesday, 2 September 2008
Graham (GHM) and Johnson Controls (JCI) "Trading Transparency"
Hello Friends! Thanks so much for stopping by and visiting my blog, Stock Picks Bob's Advice! As always, please remember that I am an amateur investor, so please remember to consult with your professional investment advisers prior to making any investment decisions based on information on this website.
 Earlier this afternoon I decided that I could no longer 'take the heat' from Graham (GHM), which fundamentally is a terrific company, but which is trading in a very volatile fashion along with the price of oil.
As this story explains:
"NEW YORK (CNNMoney.com) -- Oil futures on Tuesday tumbled to levels not seen since early April on a strengthening dollar and concerns that an economic slowdown has crippled demand for energy.
U.S. crude futures for October delivery dropped $5.75 a barrel to settle $109.71. It was the lowest oil has settled since April 8, according to the U.S. Energy Information Administration."
Responding to this decline in oil prices, Graham closed today at $85.31, down $(8.09) or (8.66)% on the day.
Frankly, I believe the selling is now overdone. But not anxious to continue to have my stock fortune dependent on the swings in the price of a commodity, I chose to step aside, and sold my 78 shares of Graham at $87.02. These shares had been purchased at a cost basis of $64.48 just a few months ago on 5/30/08, so I had a nice gain on these shares amounting to $22.54 or 35% since purchase. Since my sale was based on what I would refer to a 'fundamental' problem, that is the volatility in the price of oil, and not on an absolute decline (although I would have had a sale triggered if the stock had hit a 30% appreciation level), I reserved the right to substitute this holding with another stock.
And I did.
But since I have sold my shares in Graham (GHM), without any fundamental problem with the company itself, I shall be reducing my rating:
GRAHAM (GHM) IS RATED A HOLD
Since I was selling a stock due to the decline in oil prices, I thought it might be wise to purchase shares in an 'old favorite' of mine, a stock that might benefit from such a decline, Johnson Controls (JCI).
I purchased 210 shares of Johnson Controls (JCI) for $32.0477. JCI closed at $31.39, up $.47 or 1.52% on the day. So I am a bit underwater on this stock already :(.
But I would like to briefly comment on this stock and why
JOHNSON CONTROLS (JCI) IS RATED A BUY
First of all, JCI is an 'old favorite' of mine. I first wrote up JCI on this blog more than four years ago (!) on July 9, 2004, when the stock was trading at $53.24, up $1.97 or 3.84% that day. The stock subsequently (October 3, 2007) had a 3:1 stock split making that pick price actually $17.75/share.
On July 17, 2008, JCI reported 3rd quarter results. Earnings came in at $.73/share up from $.66 and revenue increased 11% to $9.87 billion from $8.91 billion the prior year. The company met expectations on earnings and beat expectations on revenue.
However the company did reduce guidance on the 4th quarter in the same announcement and reduced expectations for the fiscal year.
Recently Matthew Moscardi wrote a positive piece on JCI that was covered by Seeking Alpha.
Matthew wrote about Johnson Controls:
- Provided efficiency controls for energy delivery for cars, climate, security, lighting, and building automation for corporate real estate.
- History of increasing dividends since 1985.
- Currently deflated P/E ratio at 13, undervalued due to general economic concerns despite strong fundamentals.
- Avoids sector risk by offering fundamental supplies for many alternative energy and sustainable business solutions.
- Favorite of alternative energy mutual fund managers, including stalwarts New Alternatives Fund [NALFX] and Winslow Green Solutions [WGGFX].
But what I love about JCI is the beautiful Morningstar.com "5-Yr restated" financials. The steady revenue and earnings growth. The growing dividend. The stable outstanding shares. The growing free cash flow, and the solid balance sheet.
I like that Johnson Controls is about environmental controls in our office buildings; an important part of future conservation efforts. I am excited about their potential in developing hybrid batteries. And I don't believe that the downturn in automobiles is 'forever'.
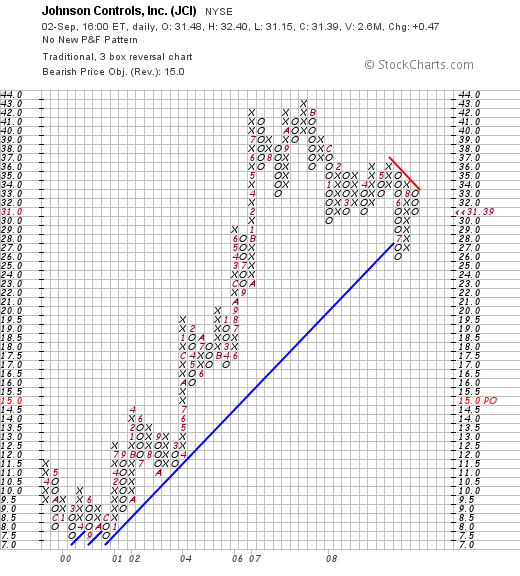
Certainly, the 'point & figure' chart on JCI is struggling to hold support. Many stocks are in this 'condition'.
Will my arbitrary trade work? Time will tell. I do believe that JCI is the kind of stock I like to write about and believe that this is a reasonable entry. I may have been premature. I may have exited GHM at exactly the WRONG time. After all I am an amateur!
But I feel better about JCI than GHM.
Thanks again for visiting! If you have any comments or questions, please feel free to leave them on the blog or email me at bobsadviceforstocks@lycos.com.
Yours in investing,
Bob
Posted by bobsadviceforstocks at 5:51 PM CDT
|
Post Comment |
Permalink
Updated: Tuesday, 2 September 2008 5:53 PM CDT
Friday, 22 August 2008
Estee Lauder (EL) "Trading Transparency"
Hello Friends! Thanks so much for stopping by and visiting my blog, Stock Picks Bob's Advice! As always, please remember that I am an amateur investor so please remember to consult with your professional investment advisers prior to making any investment decisions based on information on this website.
As I wrote in the prior entry, I am still trying to catch up with my trading activity from last week. This entry should bring the blog up to date with all of my recent trades accounted for. I apologize once again for letting my blogging lag behind my trading. It is all a part of being an amateur I guess :).
 As I reported previously, I sold my 161 shares of Genoptix (GXDX) on the same day I purchased them--August 14, 2008. On that same day as well, I checked the list of top % gainers on the NYSE and noted that Estee Lauder (EL) had made the list. After a quick review of some of the data I use to screen stocks, I felt that Estee Lauder was an appropriate, and probably a less volatile, investment for me.
I purchased 140 shares of Estee Lauder (EL) on 8/14/08 at a price of $49.87. EL closed at $50.44 on 8/22/08. With this entry, I would like to share with you why I feel that
ESTEE LAUDER (EL) IS RATED A BUY
First of all, what does this company actually do?
According to the Yahoo "Profile" on Estee Lauder, the company
"...engages in the manufacture, marketing, and sale of skin care, makeup,  fragrance, and hair care products. Its products include moisturizers, creams, lotions, cleansers, sun screens, and self-tanning products; lipsticks, lip glosses, mascaras, foundations, eyeshadows, nail polishes, and powders; fragrance products for women and men; and hair color and styling products, shampoos, conditioners, and finishing sprays. The company offers its products under the Estee Lauder, Aramis, Clinique, Prescriptives, Lab Series, Origins, MzAzC, Bobbi Brown, La Mer, Aveda, Jo Malone, Bumble and bumble, Darphin, American Beauty, Flirt!, Good Skin, and Grassroots brand names. It also manufactures and sells Kiton and Toni Gard products as a licensee."
In my family, I can tell you that it is Clinique that is the most popular of the Estee Lauder brands.
How did they do in the latest quarter?
It was actually, as is often the case, the announcement of fourth quarter earnings on Thursday, August 14, 2008, prior to the opening of trading, that drove the stock higher in trading and led to it being on the 'top % gainers list' where it caught my own attention and landed it in my portfolio.
For the quarter ended June 30, 2008, the company reported net sales of $2.01 billion, up 14% from $1.76 billion the prior year. Even without the effect of currency exchange rates, the company reported an adjusted sales increase of 9% year-over-year. Net earnings for the quarter climbed 36% to $120.2 million, up from $88.6 million the prior year. On a diluted earnings per share basis, this worked out to $.61/share this year, a 38% increase over the $.45/share reported last year.
These results were strong even more than just because they were solid results; that is, they also beat expectations. Analysts polled by Thomson Reuters had expected a profit of $.56/share (the company came in at $.61) on revenue of $1.93 billion (they came in at $2.01 billion).
The company appeared to have reassured skittish investors regarding 2009 results guiding to a sales growth of 6 to 8% (adjusted for exchange rates) to $8.39 to $8.54 billion in 2009. They expect profits between $2.57 and $2.72/share. Earnings guidance was within expectations but revenue guidance was above expectations according to analysts polled by Thomson Reuters.
With these strong results exceeding expectations and guidance for 2009 with earnings at expectations and revenue above expectations, the stock moved ahead in price enough to make the top % gainers list where it caught my own attention and interest.
How about longer-term results?
What caught my attention with this stock was the strong earnings report. What 'clinched the deal' was the superb longer-term record as reported on the Morningstar.com '5-Yr Restated' financials page for Estee Lauder (EL).
Revenue growth has been steady since at least 2003 when the company reported $5.05 billion in revenue, increasing each year to $7.04 billion in 2007 and $7.66 billion in the trailing twelve months (TTM).
Earnings, except for a dip between 205 and 2006, have also shown steady growth with $1.26/share reported in 2003, increasing to $1.78 in 2005, dipping to $1.12/share in 2006, only to rebound to $2.16/share in 2007 and $2.25/share in the TTM.
The company does pay a dividend and has been increasing it almost yearly from $.20/share in 2003 to $.50/share in 2007 and $.55/share in the TTM. Outstanding shares were 235 million in 2003 and the company has been retiring shares to 208 million in 2007 and 205 million in the TTM.
Free cash flow has been positive if a bit erratic with $249 million in 2005, $449 million in 2006, $350 million in 2007 and $379 million in the TTM.
The balance sheet appears solid with $410 million in cash and $2.4 billion in other current assets. This total of $2.81 billion, when compared to the $1.77 billion in current liabilities yields a current ratio of 1.59. The company has an additional $1.729 billion in long-term liabilities.
What about some valuation numbers?
Reviewing the Yahoo "Key Statistics" on Estee Lauder (EL), we can see that this is a large cap stock with a market capitalization of $9.81 billion. The trailing p/e is a very reasonable 20.98 with a forward p/e even nicer at 16.81 (fye 30-Jun-2010). However, the PEG ratio is a bit rich (I like to see ratios of 1.0 to 1.5 or less) with a result of 1.70.
As reported by the Fidelity.com eresearch website, EL is a good value as measured by the Price/Sales (TTM) ratio with Estee Lauder coming in at 1.23 with an industry average of 1.58. In terms of profitability, as measured by the Return on Equity (TTM), EL doesn't do quite as well with a figure of 32.63% compared to the industry average of 50.12%.
Returning to Yahoo, we find that there are 194.4 million shares outstanding. As of 7/28/08, there were 10.14 million shares out short representing a 5 day short interest ratio. With the outstanding earnings report, we may have been witnessing a bit of a 'squeeze' as short-sellers scrambled to cover their 'pessimistic'wagers and instead rushed to cover their short sales by purchasing stock.
As noted above, the company pays a forward dividend of $.55/share, yielding 1.10%. The last stock split was a 2:1 split back on June 3, 1999.
What does the chart look like?
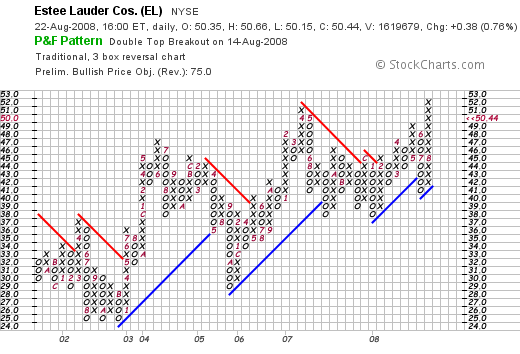
Examining the 'point & figure' chart on Estee Lauder (EL) from StockCharts.com, we can see the dip in price in 2005/2006 coinciding with the dip in earnings per share. Otherwise the chart appears quite strong with the price staying above the support lines and breaking through resistance earlier this year when it passed through $45/share. This chart looks nice to me!
Summary: What do I think about this stock?
I really like this stock pick a lot. In fact, I liked it enough that I bought shares :).
This isn't about the Peter Lynch aspect of this investment---you know with my wife and daughters supporting the Clinique brand of EL--but more about all of the usual factors I use to 'pick' a stock.
The company moved strongly higher on the 14th of August after announcing a strong earnings report that beat expectations. Longer-term, this company has been reporting steady revenue and earnings growth (even after adjusted for currency effects). They pay a dividend and they are increasing it. They have a decreasing number of outstanding shares, the free cash flow is strongly positive and the balance sheet looks solid.
What is there not to like about this stock?
Valuation-wise, the P/E is just over 20, the PEG is a bit rich, the Price/Sales ratio compares favorably with its peers, and the Return on Equity is solidly positive if a bit under where its peers are trading.
Thanks again for stopping by and visiting! If you have any comments or questions, please feel free to leave them on the blog or email me at bobsadviceforstocks@lycos.com. If you can, be sure and visit my Covestor Page where my actual trading portfoli is monitored and evaluated, my SocialPicks page where my stock picks from early 2007 on are monitored, and my Podcast Page where you can download an mp3 or two of me discussing some of my favorite investments from the blog.
Wishing you all a wonderful weekend!
Yours in investing,
Bob
Genoptix (GXDX) "Trading Transparency"
Hello Friends! Thanks so much for stopping by and visiting my blog, Stock Picks Bob's Advice! As always, please remember that I am an amateur investor, so please remember to consult with your professional investment advisers prior to making any investment decisions based on information on this website.

First of all I would like to apologize for the paucity of posts on the blog the last week or two. I would encourage you all to utilize my Covestor Page to find out how my actual holdings are doing when I am not blogging. And I shall try to get back 'in the saddle' once again, and catch all of you up on my latest thoughts and observations.
I have been making some adjustments to my trading strategy without really changing the mechanics underlying my approach. What I am trying to say is that I have chosen to sell some positions that appear to be in the wrong 'groups' or 'industries' and switch to other companies that appear to be acting 'healthier'.
Concerned that my Morningstar (MORN) stock was acting 'sickly', I chose to switch out of this pseudo-financial stock and try something else for my holding. Looking through the list of top percentage gainers on the NASDAQ, I came across Genoptix (GXDX) that appeared to fit the bill.
I went ahead and purchased 161 shares of GXDX on August 14, 2008, (a peculiar number but divisible by 7--my first partial sale amount) at $38.328/share. However, GXDX immediately started to trade weakly, and not wanting to move from one weak stock to another, I went ahead and sold my 161 shares the same day (!) at $37.028. Looking at the list of top % gainers on the NYSE that afternoon, I found Estee Lauder (EL) and purchased 140 shares at $49.87---but that is the subject of another blog entry.
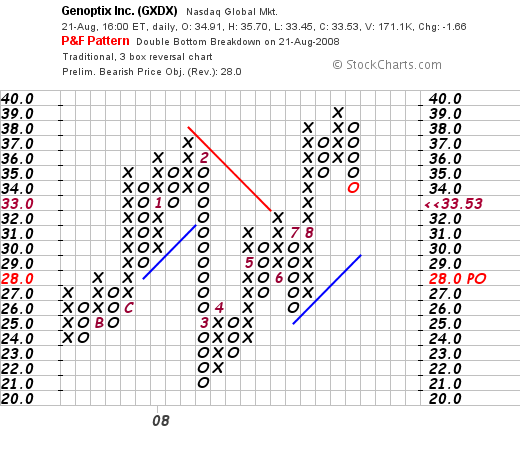
Genoptix (GXDX) continued to trade poorly and actually closed at $33.53, down $1.66 or (4.72)% on the day yesterday (8/21/08). However, I like the numbers on this stock, I do believe it deserves a place on the blog for continued monitoring. With my own sale of the stock, and the technical weakness, the best I can do is
GENOPTIX (GXDX) IS RATED A HOLD
But let's take a closer look at this stock. First of all,
What exactly does the company do?
According to the Yahoo "Profile" on Genoptix, the company
"...provides specialized laboratory service that focus on delivering customized and collaborative diagnostic services. Its services include COMPASS service offering, in which the company's hematopathologists determine the appropriate diagnostic tests to be performed, and then integrates patient history and all previous and current test results into a comprehensive diagnostic report; and CHART service offering, in which the hematologists and oncologists receives a detailed assessment of a patient's disease progression over time. The company also offers multiple diagnostic services, such as professional interpretation by its hematopathologists."
How did they do in the latest quarter?
On July 31, 2008, Genoptix (GXDX) reported 2nd quarter 2008 results. Revenues for the quarter came in at $27.8 million, up from $13.9 million the prior year. GAAP net income for the quarter was $5.6 million, compared to $3.8 million the prior year. This worked out to $.32/share vs. the $.03/share reported the prior year.
The company also raised guidance with Medicare reimbursement rates confirmed, to $105 to $108 million in revenue for the year, up from prior guidance of $90 to $95 million in revenue. Net income figures were also raised from $15 to $17 million to approximately $20 million for the year.
Seeking Alpha has the Conference Call Transcript on this quarterly result for your further review.
What about Longer-Term Results?
Reviewing the Morningstar.com "5-Yr Restated" financials, we can see that this company has grown rapidly from its $200,000 in revenue in 2003 to $59.3 million in 2007 and $84.9 million in the trailing twelve months (TTM).
Earnings have improved from a $(184.35)/share loss (!) in 2003 to a loss of $(33.74)/share in 2006, turning to a profit of $.78/share in 2007 and $1.35/share in the TTM.
Morningstar shows 4 million shares in 2007. According to Yahoo, there are currently 16.5 million shares outstanding--and also according to the latest quarterly report, there are 17.5 million shares when the full "dilution" is considered.
Free cash flow has improved recently from $(10) million in 2005, to $(4) million in 2006, $12 million in 2007 and $18 million in the TTM.
The Balance Sheet on Morningstar.com appears solid with $51.0 million in cash and $60 million in other current assets. Compared to the $10.9 million in current liabilities, this yields a current ratio of 10.2. The company has virtually no long-term debt with $300,000 in long-term liabilities reported.
What about some Valuation Numbers?
Reviewing the numbers from Yahoo "Key Statistics" on Genoptix (GXDX), we can see that this is a small cap stock with a market capitalization of only $554.28 million. The trailing p/e is a moderately rich 30.18, with a forward p/e (fye 31-Dec-09) of 30.21. However, the '5 yr expected' growth is substantial enough that the PEG is estimated at 0.64.
Reviewing the Fidelity.com eresearch website, we can see that the stock is still rather richly valued with a Price/Sales (TTM) of 6.38, compared to the industry average of 0.89. Fidelity does suggest that the company is quite profitable, however, with a Return on Equity (TTM) of 24.76% compared to the industry average of 18.77%.
Returning to Yahoo, we can see that there are 16.53 million shares outstanding and currently there are 994,320 shares out short (as of July 28, 2008), representing 7.2 days of average volume (the short ratio). This exceeds my own '3 day rule' making the short interest significant from my perspective. No dividends are paid, and no stock splits are reported on Yahoo.
What does the chart look like?
When we examine the 'point & figure' chart on Genoptix (GXDX) from StockCharts.com, we see that the chart is relatively optimistic yet showing some signs of fairly significant volatility. Since coming public in October 2007, the stock has traded from $24 to $37 in January, 2008, only to dip to $21 and start its move higher once again. The stock recently peaked at $39 in August, 2008, but has now dipped back to $33. Overall, the chart appears to be intact with the stock trading through resistance and above support levels.
Summary: What do I think?
Overall, I still like this stock. It is a bit small and very volatile trader, but the prospects appear to be good with the company reporting solid earnings and revenue results and raising guidance on both.
My own short-term ownership of this stock was limited likely to my own poor timing of my purchase in a stock that was a bit 'over-extended' technically. Valuation is a bit rich but the stock is just currently turning profitable and this is to be expected.
Thanks so much for stopping by and visiting my blog. If you have any comments or questions, please feel to leave them on the blog or email me at bobsadviceforstocks@lycos.com. If you get a chance, be sure and visit my Covestor Page, where you can review my continuously updated trading portfolio results and performance, my SocialPicks page which monitors my stock picks from early 2007 through current posts, and my Podcast Page where you can listen to me discuss some of my picks from this blog.
Wishing you all a wonderful Friday and weekend!
Yours in investing,
Bob
Sunday, 17 August 2008
Morningstar (MORN), Genoptix (GXDX), and Estee Lauder (EL) "Trading Transparency"
Hello Friends! Thanks so much for stopping by and visiting my blog, Stock Picks Bob's Advice! As always, please remember that I am an amateur investor, so please remember to consult with your professional investment advisers prior to making any investment decisions based on information on this website.
Last week, on August 14, 2008, I chose to replace what I felt was a relatively weakly performing stock with something acting healthier. This is certainly outside of my "rules" for trading, but I am trying to enhance the performance of my portfolio by trying to identify similar stocks that do meet my criteria as well but are technically, from my perspective, appear to be trading better in the market. I am not sure if this will be a successful intervention but as I have always done on this blog, I wanted to share with you my thoughts and observations.
It is possible that I acted merely by 'chasing performance' and shall actually underperform the market in the days ahead instead of accomplishing my own goal of outperformance. In so many ways, after these many years of trading, I remain an amateur. So bear with me and I shall explain the 'lateral' move I made.
First of all, I sold my 103 shares of Morningstar (MORN) from my trading account at a price of $64.794. These shares were initially purchased 11/22/05 at a cost basis of $32.57, so I had a realized gain of $32.22 or 98.9% since purchase--so it isn't like I had a loss on this stock or anything!
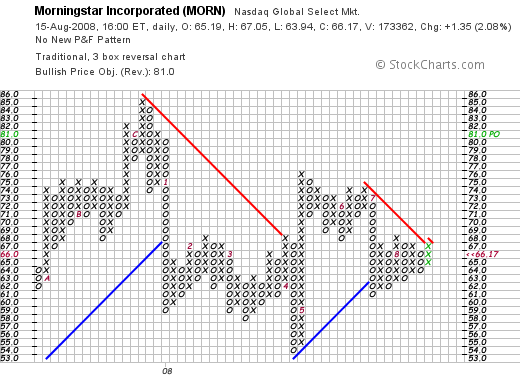
But if we take a look at the Morningstar "point & figure" chart from StockCharts.com, we can see the relatively anemic performance of this stock after hitting $86 in December, 2007.
Since I do not have any problem at all with Morningstar as a company. They reported an outstanding earnings report just a couple of weeks ago, their 5-Yr Restated Financials page is solid, and I only have some concerns about the relative weakness of the stock, which I believe is because it is being lumped into the 'financials' group. Thus my sale. So, with my own sale, I cannot leave Morningstar (MORN) at "BUY" and am reducing my rating:
MORNINGSTAR (MORN) IS RATED A HOLD
Initially, I purchased shares of Genoptix (GXDX), but with the same-day weakness in THAT stock, I sold shares and settled on Estee Lauder (EL). More details to follow.
Yours in investing.
Bob
Friday, 8 August 2008
Lufkin (LUFK) and Quality Systems (QSII) "Trading Transparency'
Hello Friends! Thanks so much for stopping by and visiting my blog, Stock Picks Bob's Advice! As always, please remember that I am an amateur investor, so please remember to consult with your professional investment advisers prior to making any investment decisions based on information on this website.
 I have been doing a little bit of "micro-managing" of my portfolio. I swapped out my VIVO for RMD hoping to catch a bit more momentum, and now, noting that my Lufkin (LUFK) stock, which I just recently purchased 7/16/08 at a cost basis of $91.10 has been struggling while the rest of the market has been rallying, I chose to sell my shares.
They really hadn't hit a sale point, and we shall need to see if this is a reasonable decision or whether by ignoring my own 'trading rules' I was a bit hasty, lost patience with a great company, and instead jumped on a stock that was heading towards a correction.
However, in light of my own sale of Lufkin (LUFK), I am reducing my rating.
LUFKIN (LUFK) IS RATED A HOLD
What has been driving this market higher recently has been the relative collapse in the price of oil. However, what is good for the market, may not be good for Lufkin (LUFK), which otherwise has superb fundamentals. The market paints stocks with a very broad stroke, so that the "baby is frequently thrown out with the bathwater". My approach to investing is strongly related to earnings growth and fundamental performance reflected in a higher stock price. When a stock starts trading in a fashion tied to a commodity, whether that commodity be oil, gold, or pork bellies, then all bets are off.
I decided to move on.
As reported:
"A strengthening dollar helped lower the price of a barrel of oil. Light, sweet crude fell $4.91 a barrel to $115.11 on the New York Mercantile Exchange, bringing its decline over the past four weeks to more than $30."
That's right. $30 drop in four weeks. Virtually a collapse.
Will oil move higher next week or next month? Will it trade instead closer to $80/barrel than $140 or is it going to trade at the same price? Frankly, I don't know. And I am not sure anyone knows for sure anyhow. But I want to be investing in some sort of rational fashion. I am not interested in speculating on stocks based on the movement of commodities.
I suppose it is also just sour grapes. After all, I wouldn't be complaining if Lufkin was moving higher today instead of being slightly lower while most of the rest of the market powered ahead.
So earlier today, I sold my 70 shares of Lufkin (LUFK) at $89.76. These shares, as I have noted, were purchased 7/16/08 at a cost basis of $91.10/share. Thus I had a loss of $(1.34) or (1.5)% on this purchase.
Generally I wait for a loss to build to (8)% before initiating a sale after a purchase of a new position. However, as I have said many times, I reserve the right to sell a stock based on any 'fundamental' issues. With the oil market correcting, I wanted to step aside. To make sure that my own holdings would not be overly impacted by a correction in a commodity as significant as oil.
With the sale completed, I turned to the list of top % gainers on the NASDAQ where I found an 'old favorite' of mine, Quality Systems (QSII) on the list.
 I reviewed the information on QSII and went ahead and purchased 182 shares at $38.1324/share. I would like to share with you my thoughts on QSII, why I made this purchase, and why
QUALITY SYSTEMS (QSII) IS RATED A BUY
After purchasing shares at $38.13, the stock did decline slightly and closed at $37.80, up $4.51 or 13.55% on the day.
Quality Systems is involved in assisting healthcare facilities implement electronic medical records. As explained by the Yahoo Finance "Profile" on QSII, the company
"...engages in the development and marketing of healthcare information systems in the United States. Its system automates various aspects of medical and dental practices, and networks of practices, such as physician hospital organizations and management service organizations, ambulatory care centers, community health centers, and medical and dental schools. The company offers proprietary electronic medical records software and practice management systems under the NextGen3 product name."
If you are not familiar with the market potential to electronic medical records, note what this article had to say:
"The cost for the packaged electronic medical record (EMR) systems for a large teaching hospital is $1.95 million. The number sold at 126 in 2006 is anticipated to grow to 177 in 2013. The replacement cycle is generally six years for these electronic medical record (EMR) systems packages. Rather than rip and replace, systems tend to be upgraded to new versions.
Electronic medical record markets are very significant. All facilities and all medical practices need to move to automated process that replaces manual handling of written patient records. The top 800 facilities worldwide are anticipated to spend hundreds of millions of dollars each to implement electronic patient records. While a lot of that spending will be on proprietary software, a lot of it will be for packaged software solutions."
There is a very large potential market for electronic medical records (EMR):
"Enterprise electronic medical record (EMR) market forecast analysis indicates that the future of care delivery depends on automation of process. The ability to quickly get a picture of patient condition depends on dashboards prepared by the primary care physician that quickly illustrate any noteworthy conditions that a patient may present.
Markets at $1.8 billion in 2006 are anticipated to reach $3.2 billion by 2013.
Worldwide enterprise electronic medical record (EMR) software markets will grow substantially as vendors are able to leverage the EMR expertise to provide competitive advantage from automation of process using IT infrastructure."
But back to Quality Systems (QSII).
It was the announcement of 1st Quarter 2009 earnings after the close of trading yesterday that drove the stock higher in trading today. Revenue for the quarter ended June 30, 2008, came in at $55.2 million, up 31% from the $42.0 million in the same quarter the prior year. Net income worked out to $11.1 million, up 40% over the $7.9 million last year. Fully diluted earnings per share were $.40, up 38% from the $.29/share last year.
As 'icing on the cake' the company announced a 20% increase in the cash dividend to $.30/share from the prior $.25/share payment.
QSII beat expectations--analysts had been expecting earnings of $.37/share (they came in at $.40), on revenue of $51.9 million (they came in at $55.2 million).
Regarding longer-term results, we can review the Morningstar.com "5-Yr Restated" financials on QSII and see that we had a reason why we have liked this stock in the past!
Revenue growth has been steady from $71 million in 2004 to $187 million in 2008.
Earnings have grown without interruption from $.40/share in 2004 to $1.40/share in 2008. The company initiated a dividend in 2008 at $1.00/share and now have increased it to a $1.20/share rate.
Outstanding shares are quite stable with 26 million in 2004 increasing less than 10% to 28 million in 2008. (During this same period sales increased by over 100%, earnings by over 200%---so this share dilution is quite modest in comparison.)
Free cash flow is positive and overall growing from $28 million in 2006 to $41 million in 2008.
The balance sheet is solid. As reported by Morningstar.com, the company has $59 million in cash and $91 million in other current assets. This total of $150 million in current assets yields a current ratio over just over 2 when compared to the $70.2 million in current liabilities. Long-term liabilities are quite modest at only $4 million.
Looking at a few valuation numbers, we can see on the Yahoo "Key Statistics" page on QSII, that the company is a small cap stock with a market capitalization of only $1.04 billion. The trailing p/e is a modest 26.20 with a forward p/e (fye 31-Mar-10) of 18.90. With the rapid growth in earnings expected, valuation works out to be quite reasonable in terms of the PEG Ratio of .99 (5 yr expected).
Yahoo reports 27.45 million shares outstanding with 17.70 million that float. As of 7/10/08, there were 5.77 million shares out short. Compared to the average trading volume of only 246,872 shares (3 month average), this works out to a short ratio of 31 days! I personally utilize a '3 day rule' for significance, so this 31 day figure is quite convincing! With the great results out today, and the stock climbing sharply, this could well represent a short-squeeze for investors.
In addition to the great financial results, the company now pays over a 3% dividend, and last split its stock 2:1 March 27, 2006.
And a chart?
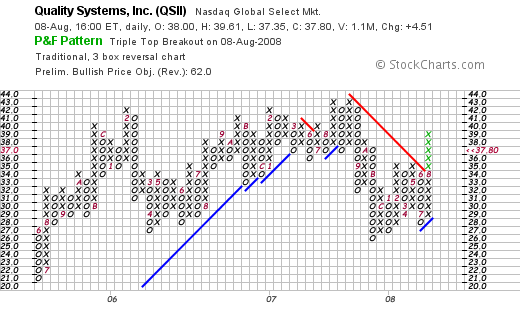
Looking at the "point & figure" chart on Quality Systems (QSII), we can see that the stock has been trading 'sideways' since February, 2006, when the stock peaked at $42. The stock has hit that level several times only to pull back to lower levels. The stock with the current move has broken through resistance once again. It would be nice seeing this stock trade above $44 to confirm this rally has staying power.
To summarize, I chose to step out of my Lufkin (LUFK) even though I still respect the underlying fundamentals in that stock. I am concerned about the pressures of a continuing decline in the price of oil. If oil turns around tomorrow, I shall be demonstrating a public lack of any sense of timing. In any case, I hate to have any of my holdings to be as tied to a commodity price as I suspect, or fear that this stock has been.
Quality Systems (QSII) beat expectations yesterday and came in with strong revenue growth, earnings growth, and also raised their dividend. The sharp price appreciation was probably driven in part by the oversized short interest outstanding on this stock. Meanwhile, QSII demonstrates real quality with steady revenue growth, earnings growth, stable outstanding shares, an increasing dividend, growing free cash flow, and a solid balance sheet.
So this stock isn't a fluke either.
Thanks again for visiting! If you have any comments or questions, please feel free to leave them on this website or email me at bobsadviceforstocks@lycos.com. If you get a chance, be sure and visit my Covestor Page where you can monitor my trading portfolio performance, my SocialPicks page where my stock picks are also followed, and my Podcast Page where you can listen to an mp3 or two about some of the stocks written up on this blog.
Have a wonderful weekend everyone and wish me luck!
Yours in investing,
Bob
Wednesday, 6 August 2008
Meridian Bioscience (VIVO), ResMed (RMD) "Trading Transparency"
Hello Friends! Thanks so much for stopping by and visiting my blog, Stock Picks Bob's Advice! As always, please remember that I am an amateur investor, so please remember to consult with your professional investment advisers prior to making any investment decisions based on information on this website.
 I am absolutely in love with Meridian Bioscience (VIVO) but with the latest quarter mildly disappointing, and the stock lagging while the rest of the market moves higher, I grew impatient today. and started looking for another vehicle for my investment purposes.
O.K. it isn't exactly consistent with my trading 'rules'. But you might recall, did basically a similar thing with my IHS stock, that I chose to sell when it appeared to be acting sickly and took the proceeds and jumped into Graham (GHM) which was probably the smartest move of mine this year (except for my short-term trades in Meridian recently...which were WAY outside my usual trading actions!)
With all of that in mind, and thinking maybe I could 'fine-tune' my portfolio a little, I sold my 171 shares of Meridian (VIVO) shares today at $25.4844 and went to the list of top % gainers today to find out if there was a better place to park the proceeds.
In light of my own sale of Meridian (VIVO), I am reducing my rating on the stock:
MERIDIAN BIOSCIENCE (VIVO) IS RATED A HOLD

Reviewing the 'top % gainers', I noted that ResMed (RMD) was on the list! This stock has been an 'old favorite' of mine and I have owned it in the past as well. After a review of the news which consisted of a strong earnings report, I thought it might be wise to switch from one medical technology firm to another that was acting a bit healthier.
I went ahead and purchased 140 shares of ResMed (RMD) at $43.269. ResMed (RMD) actually closed at $43.09, up $4.84 or 12.65% on the day.
RESMED (RMD) IS RATED A BUY
Let me review with you some of the facts that led to my decision to buy shares in this company which, as I have written, is an 'old favorite' of mine.
First of all, that earnings report.
Yesterday, after the close of trading, ResMed (RMD) reported 4th quarter 2008 results. Revenue for the quarter increased 23% to $235.2 million from the prior year same period. Net income was $29.6 million, up from $27.7 million last year. Diluted earnings per share came in at $.38/share, up from $.35/share last year. Excluding some one-time expenses, this would have been $.40/share.
Sometimes just as important as the actual result and comparisons to prior quarters, is the question of expectations. In other words, the result was impressive because the 'street' had been expecting earnings of $.39/share. And ResMed beat expectations with its $.40/share result. In addition, with its revenue of $235.2 million, it beat expectations of revenue of $220.3 million according to analysts polled by Thomson Financial.
Sleep apnea is big business.
As this same Reuters article reports:
"ResMed and bigger rival Respironics Inc control about 80 percent of the $2 billion U.S. market for sleep breathing devices, a rapidly growing market as people become more aware of the links between sleep disorders and heart disease and diabetes."
In America alone, it is estimated that 18 million American may suffer from obstructive sleep apnea. And of these, 10 million are undiagnosed.
Other 'facts' from that same article:
- "The condition affects about 4 percent of middle-aged men and 2 percent of middle-aged women.
- Men in general suffer from sleep apnea more often than women.
- Children can also have sleep apnea.
- Sleep apnea in children has been linked to attention deficit/hyperactivity disorder, or ADHD.
- Some studies suggest sleep apnea runs in families.
- Studies have linked sleep apnea to high blood pressure, heart attack, and stroke.
- Up to 50 percent of people with sleep apnea also suffer from high blood pressure.
- People with sleep apnea are three times more likely to be involved in motor vehicle accidents.
- People with sleep apnea sometimes fall asleep unexpectedly during the day, such as while talking on the phone or driving.
- Risk factors for sleep apnea include being overweight and having a large neck.
- Losing even 10 percent of body weight can help reduce the number of times a person with sleep apnea stops breathing during sleep.
- African-Americans, Pacific Islanders, and Mexican-Americans may be at increased risk for sleep apnea.
- Smoking and alcohol use increase the risk of sleep apnea.
- Continuous positive airway pressure, or CPAP, is the most common, noninvasive treatment for moderate to severe sleep apnea."
I share these fact with you both as an investor as well as a patient who also hooks himself up to his own CPAP machine for the last several years! If you or someone you know snores at night, has a large neck size, is a bit overweight....now we are talking about most of us lol....and if your significant other notes that you sometimes stop breathing when you are snoring....well get yourself down to a sleep lab...it could mean the difference between life and death!
But looking at the fundamentals, besides that little health plug, we can check with Morningstar.com "5-Yr Restated" results. Here we can see the steady pattern of revenue growth, the slight dip in earnings last year and the subsequent rebound, the modest increase in outstanding shares, the recently improved record of free cash flow, and the very strong balance sheet.
Like many stocks recently, the stock price has been under pressure. Let's take a look at the "point & figure" chart on ResMed from StockCharts.com:
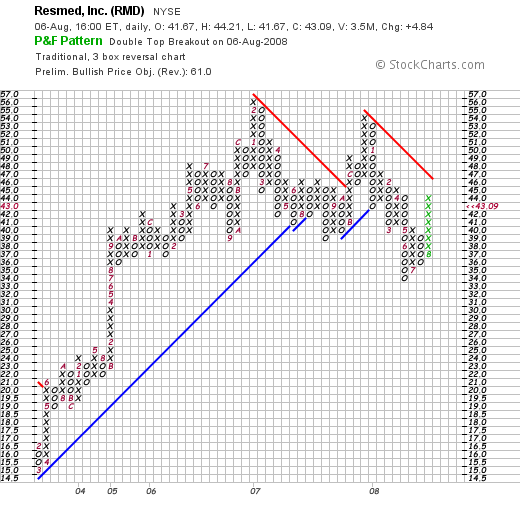
You can see how after June, 2007, the stock broke through support levels at the $40 level. Even with today's strong rise, the stock hardly looks over-extended. In fact, it has some upward price appreciation to do before it even confirms this bullish move. I hope I haven't moved in prematurely, but I believe that the financial results are once again on track and that usually, the stock price follows along. At least that is my strategy.
Sometimes you got to just jump from one wave and pick up another. Of course, I don't surf. But in my mind, that's what investing in this fashion is all about.
I will keep you posted. Meanwhile, wish me luck with this new purchase.
If you have any comments or questions, please feel free to leave them on the blog or email me at bobsadviceforstocks@lycos.com. If you get a chance, be sure and visit my Covestor Page where my actual trading portfolio is monitored and evaluated, my SocialPicks Page where my stock picks from the last almost two years are reviewed, and my Podcast Page where you can download an mp3 or two of me discussing some of the many stocks I write about here on this website.
I hope the rest of the week goes well and finds you in good health, sleeping well at night without any 'apnea', and finds your portfolio rebounding from the recent correction with profits exceeding losses!
Yours in investing,
Bob
Newer | Latest | Older


