Stock Picks Bob's Advice
Wednesday, 17 May 2006
Maintaining Trading Discipline in a Declining Market
One of my greatest challenges as an investor is knowing how to deal with market declines and investment losses. One would like to have something automatic like this
Rube Goldberg machine.
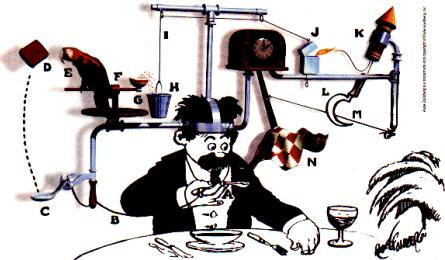
In other words, to have a trading system that will diminish your losses in a bear market and maximize your gains in a bull market.
Too often we find our emotions working against our own best interests. When investments decline we rationalize the losses and defer the realization implicit in a sale of holdings at a price below their cost. This exposes our investments to greater losses and delays the eventual 'day of reckoning'.
In the same fashion, as stocks move higher, our greed overcomes our rational thoughts and we delay realizing some of the gains by selling a portion of the holding, and instead allow our dreams of larger and greater profits override our need to 'lock-in' some gains with a sale.
Within every successful trading system there should be a method of avoiding the problem of compounding one's losses while at the same time encouraging the compounding of gains. In other words, when investments within a portfolio develop losses, they should be sold at a predetermined price point and the proceeds from such sales should not be re-invested; instead, the proceeds should be kept in cash to be re-invested when an appropriate buy signal occurs.
In the same fashion, when stocks are sold on 'good news' events, such as price appreciation, this should also be considered a bullish indicator and the proceeds from such good news sales should be re-invested in a new stock position.
I have expressed this strategy as being hardest on declining stocks that are sold completely and quickly on developing losses, and easiest on gaining stocks which are on the other hand sold slowly and partially as they appreciate in price. This bias will also select for the strongest stocks within your portfolio.
A strategy with pre-determined sale points both on the upside and downside reduces trading stress as one simply needs to review the stock price to determine one's action. It is the requirement for arbitrary decisions that may lead to over-trading as well as under-trading of one's holdings.
No system can respond quickly enough to avoid all losses and lock in all gains. However, having a system that can move one's holdings back and forth from equities to cash and back again, should be helpful in the long-run in building one's assets by maximizing gains and minimizing losses.
Wishing my readers the very best of luck in dealing with the difficult investing environment we are all facing!
Bob
Tuesday, 16 May 2006
FactSet Research Systems (FDS) Revisiting a Stock Pick
Click HERE FOR MY PODCAST ON FACTSET RESEARCH (FDS)Hello Friends! Thanks so much for stopping by and visiting my blog,
Stock Picks Bob's Advice. As always, please remember that I am an amateur investor, so please remember to consult with your professional investment advisors prior to making any investment decisions based on information on this website.

I was looking through the list of
top % gainers on the NYSE today and saw that an 'old favorite' of mine from this blog, FactSet Research Systems, Inc. (FDS) was on the list. In fact, FDS closed at $46.23, up $3.64 or 8.55% on the day. I do not have any shares or options on this stock.
I first
posted FDS on Stock Picks Bob's Advice on June 17, 2003, when it was one of the first selections on this blog, trading at $40.39/share. Adjusted for a 3:2 stock split on February 7, 2005, this pick was actually selected at a price of $26.93/share. Thus, with the stock closing at $46.23, this represents an appreciation of $19.30 or 71.7% since I first 'picked' the stock here on the blog.
Almost exactly a year ago, on May 18, 2005, I
again posted FactSet (FDS) on Stock Picks Bob's Advice, when it was trading at $31.53. With today's close at $46.23, the stock has appreciated $14.70 or 46.6% since posting in the past year.
And today, with the stock once again on the move, I have posted FDS on Stock Picks for the third time! Let's take a closer look at this company and let me show you why I believe it deserves another review!
1. What exactly does this company do?According to the
Yahoo "Profile" on FactSet Research, the company
"...supplies economic and financial data and analytics to the investment community worldwide. The company’s applications provide users access to company analysis, multicompany comparisons, industry analysis, company screening, portfolio analysis, predictive risk measurements, alpha and backtesting, portfolio optimization, and real-time news and quotes."
2. What about the latest quarterly results?On March 21, 2006, FactSet
reported 2nd quarter 2006 results. Revenue for the quarter came in at $93.7 million, up 23% from the prior year's $76.5 million and also
beating consensus of $92.3 million expected. Net income grew to $19.2 million or $.38/share, up from $17.2 million or $.34/share the prior year. This also beat expectations of $.37/share as reported. In addition, the company raised guidance on the upcoming quarter for revenue, with $95-$97 million now expected, up from analysts' expectations of $94.9 million.
Thus from my perspective this quarterly report did everything right: reporting increased revenue, increased earnings, exceeding expectations and raising guidance. Something I call the "trifecta plus"!
3. How about longer-term results?Reviewing the
"5-Yr Restated" financials on FDS from Morningstar.com, we find first of all that revenue growth has been uninterrupted with $167.6 million in 2001 growing to $312.6 million in 2005 and $345.4 million in the trailing twelve months (TTM).
Earnings during this period have also steadily grown from $.64/share in 2001 to $1.43/share in 2005 and $1.52/share in the TTM.
An added bonus is the fact that the company pays a dividend which has also been steadily increased from $.09/share in 2001 to $.20/share in 2005. Interestingly, the company has been retiring shares with 51 million in 2002, dropping to 48 million in 2005 (although rebounding slightly to 49 million in the TTM).
Free cash flow has been positive with $66 million reported in 2003, $45 million in 2004, $72 million in 2005 and $99 million in the TTM.
The balance sheet also looks solid with $90.2 million in cash which by itself can pay off both the $66.4 million in current liabilities and the $18.0 million in long-term liabilities comgined. Calculating the 'current ratio' gives us a total of cash and other current assets at $157.4 million, which when compared to the $66.4 million of current liabilities results in a current ratio of 2.37.
4. What about some valuation numbers on this stock?Reviewing
Yahoo "Key Statistics" on FactSet Research, we find that this is a mid-cap stock with a market capitalization of $2.25 billion. The trailing p/e is a bit rich at 30.29, with a forward (fye 31-Aug-07) p/e of 25.97. The PEG is also a bit rich with a ratio of 1.62.
The
Fidelity.com eresearch website demonstrates that in terms of the Price/Sales ratio, FDS is also richly priced with a ratio of 6.3 leading the "Information/Delivery Services" industrial group. Following FactSet is Wright Express (WXS) at 4.9, Jupitermedia (JUPM) at 4.4, Alliance Data Systems (ADS) at 2.6 and DST Systems at 1.8. By this measure as well, FDS is priced richly.
Returning to Yahoo, we find that there are 48.68 million shares outstanding with 37.61 million that float. As of 4/10/06, there were 2.32 million shares out short representing 5.6% of the float or 8.2 trading days of volume. I believe any short interest over 3 days is significant and may contribute to a "squeeze" of the short sellers.
As noted earlier, the company pays $.20/share in dividends yielding 0.5%. Also as noted above, the company last split its stock in a 3:2 fashion.
5. What about a chart?Looking at the
"Point & Figure" chart on FDS from StockCharts.com:
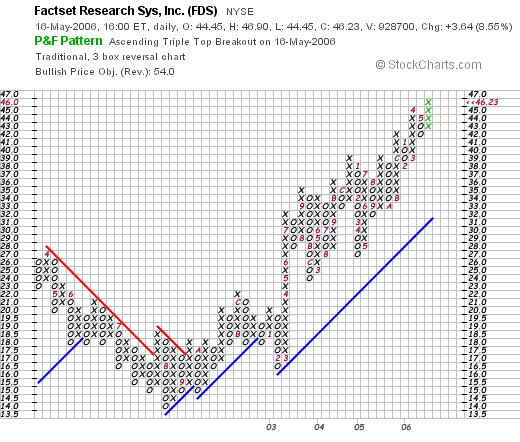
We can see that this stock actually was trading lower from $28/share in April, 2002, to a low of $14/share in August, 2002. Since bottoming at that time, the stock has actually been trading stronger, first breaking resistance at $17, and now moving sharply higher to close at $46.23, which appears to be a new high for the stock.
6. Summary: What do I think?
Let's review some of the things that I have discussed above on this stock. First of all, the stock moved nicely higher today on an upgrade from Piper Jaffray. The latest quarter showed everything I like to see in a quarterly report: revenue growth, earnings growth, beating expectations and raising guidance.
The Morningstar.com report is also quite nice with steady revneue and earnings growth the past few years. The company even pays a small dividend and has been increasing it each year. In addition, the company has reduced the number of shares outstanding which is also an important detail of this analysis.
The company is generating an increasing level of free cash flow and has a strong balance sheet.
Valuation wise, the p/e is above 30, the PEG is just over 1.5, and the price/sales is just a little over 6, making it the priciest stock in its industrial group. On a postiive note the relatively large amount of short interest may be supportive and may even be driving the stock higher in the face of solid earnings. And finally, the stock chart looks strong and does not appear overextended.
I like FDS but it is not a 'bargain'. Any blemish could find this stock correcting. However, there are few other stocks with as consistent a growth bias as FactSet and this has been an excellent pick for me as demonstrated by the price appreciation from 2003 and 2005. Unfortunately I don't own any of these shares!
Thanks so much for stopping by and visiting. If you have any comments or questions, please leave them on the blog or email me at bobsadviceforstocks@lycos.com. If you get a chance, please do come and visit my Stock Picks Bob's Advice Podcast Site.
Bob
Posted by bobsadviceforstocks at 10:55 PM CDT
|
Post Comment |
Permalink
Updated: Tuesday, 16 May 2006 11:49 PM CDT
Monday, 15 May 2006
"Trading Transparency" JLG
Hello Friends! Thanks so much for stopping by and visiting my blog,
Stock Picks Bob's Advice. As always, please remember that I am an amateur investor, so please remember to consult with your professional investment advisors prior to making any investment decisions based on information on this website.
As part of my trading strategy, I am selling stocks that hit 8% losses. After a sale, I 'sit on my hands' and leave the proceeds in cash (or as more accurately is the case, I pay down my margin.) I don't second guess what the market is telling me through my portfolio.
This afternoon, with the market turning down once again, my JLG stock hit a sale point. I had purchased 320 shares on 1/12/06 (note that my latest purchases are being sold first), at a cost basis of $25.81. A few moments ago, I sold all 320 shares at $23.67 for a loss of $(2.14) or (8.3)%. No matter how much I
like JLG or CNXS or ANGO, these stocks were sold because my trading strategy dictated their sale. And out they went.
I shall be applying the proceeds to my shrinking margin level, and waiting for a stock to hit an appreciation target instead of a sale point, to add a new position to the portfolio. Meanwhile, I am battening the hatches.
Thanks so much for visiting! If you have any comments or questions, please feel free to leave them on the blog or email me at bobsadviceforstocks@lycos.com. Please also come and visit my
Stock Picks Bob's Advice Podcast Site.
Bob
"Trading Transparency" CNS Inc. (CNXS)
Hello Friends! Thanks so much for stopping by and visiting my blog,
Stock Picks Bob's Advice. As always, please remember that I am an amateur investor, so please remember to consult with your professional investment advisors prior to making any investment decisions based on information on this website.
One of the things I try very hard to do is to 'practice what I preach' :). As much as I 'like' my holdings, I am pretty cold-hearted and will part with them as they hit sale points on the downside. Case in point is CNS, (CNXS), which a few moments ago, hit my 8% loss limit on the downside and was sold. You can see that in the face of a market correction, the first stocks to go are the most recent purchases that are most vulnerable for a sale.
I just purchased these 240 shares on 5/5/06, at a cost basis of $24.44/share. A few moments ago I sold my 240 shares at $22.37, for a loss of $(2.07) or (8.5)% since purchase.
Again, as part of my strategy, I shall refrain from reinvesting the proceeds until such time as I have a sale of a portion of a stock at a gain, on what I call good news. You can see that my portfolio, which if I didn't have any margin, would currently be moving into cash as the market declined. It will be interesting to see how this works out as things proceed.
In any case, thanks so much for stopping by! If you have any comments or questions, please feel free to leave them on the blog or email me at bobsadviceforstocks@lycos.com. Also, remember to stop by and visit my
Stock Picks Bob's Advice Podcast Site.
Bob
Sunday, 14 May 2006
"Looking Back One Year" A review of stock picks from the week of February 21, 2005

Hello Friends! Thanks so much for stopping by and visiting my blog,
Stock Picks Bob's Advice. As always, please remember that I am an amateur investor, so please remember to consult with your professional investment advisors prior to making any investment decisions based on information on this website.
One of the weekend tasks I like to address on this website, is to look at past stock picks and find out how they 'turned out'. For the purposes of this review, I assume a 'buy and hold' strategy of stock purchases. However, in real life, I actually recommend and practice a disciplined portfolio management system that requires me to sell stocks if they hit an 8% loss after an initial purchase, and to sell 1/6th of my holdings of stocks as they hit targeted appreciation points. This will definitely change actual investment performances however, for the sake of this review, a 'buy and hold' strategy is an easier approach to get a feel for the performance of these stock picks.

During the week of February 21, 2005, I only made one stock 'pick' which in itself was a revisit of an earlier post. On February 26, 2005, I
picked Synaptics (SYNA) for Stock Picks Bob's Advice when it was trading at $24.33. Synaptics closed on May 12, 2006, at $24.42, up $.09 from the initial pick, virtually unchanged, with a calculated gain of .4% since being 'picked'.

On April 20, 2006, Synaptics
reported 3rd quarter 2006 results. For the quarter ended March 31, 2006, net revenue came in at $40.4 million, down from $56.7 million for the same quarter the prior year. Net income for the quarter was $1.6 million or $.06/diluted share, compared with $11.7 million or $.38/diluted share in the third quarter of the 2005 fiscal year.
So how did I do that week? Well, there was only one stock 'picked'; ironically, I had a very slow week in picking stocks this week as well. And that stock, Synaptics, had a 0.4% gain. Nothing to write home about I guess.
Thanks so much for stopping by and visiting! If you have any comments or questions, please feel free to leave them on the blog or email me at bobsadviceforstocks@lycos.com. Also, please remember to stop by and visit my
Stock Picks Bob's Advice Podcast Site where you can listen to me discuss many of the same stocks on my blog and also answer some readers questions regarding my trading strategy and individual stocks.
Bob
Posted by bobsadviceforstocks at 10:58 PM CDT
|
Post Comment |
Permalink
Updated: Sunday, 14 May 2006 10:59 PM CDT
Friday, 12 May 2006
"Trading Transparency" Dynamic Materials (BOOM)
Hello Friends! Thanks so much for stopping by and visiting my blog,
Stock Picks Bob's Advice. As always, please remember that I am an amateur investor, so please remember to consult with your professional investment advisors prior to making any investment decisions based on information on this website.
A few moments ago I sold my 200 shares of Dynamic Materials (BOOM) at $33.12. Due to my "day-trade" in BOOM last month, the basis for these shares is considered $36.89 and the purchase date of 4/27/06. Thus, with this basis, my shares have incurred a loss of $(3.77) or (10.2)%. Thus, regardless of how much I like this particular company, my trading discipline demands that the shares be sold. Further, with the sale of shares at a loss, I shall be 'sitting on my hands' with the proceeds, moving from equities into cash. (or less margin as the case is actually). Again, I am waiting for a sale at a gain, what I call "good news" to add another position to my portfolio.
Thanks so much for stopping by! If you have any comments or questions, please feel free to leave them on the blog or email me at bobsadviceforstocks@lycos.com. Also, please be sure to visit my
Stock Picks Bob's Advice Podcast Site where I talk about many of my picks as well as my investing strategy.
Bob
Thursday, 11 May 2006
"Trading Transparency" AngioDynamics (ANGO)
Hello Friends! Thanks so much for stopping by and visiting my blog,
Stock Picks Bob's Advice. As always please remember that I am an amateur investor, so please remember to consult with your professional investment advisors prior to making any investment decisions based on information on this website.
A few moments ago, I sold my 200 shares of AngioDynamics at $27.85. This was one of my latest purchases, having purchased these shares 4/28/06 at a cost basis of $30.30. Thus, I had a loss of $(2.45) or (8.1)% on this purchasse. Having hit my 8% loss limit, all of my 200 shares were sold. With my system of avoiding 'compounding' my losses, I shall be sitting on my hands with these proceeds, waiting for a sale on 'good news' or a sale that is at a gain in one of my other positions.
Thanks so much for stopping by and visiting my blog! If you have any comments or questions, please feel free to drop me a line at bobsadviceforstocks@lycos.com or just leave them on the blog. Also, be sure to stop by and visit my
Stock Picks Bob's Advice Podcast Site.
Bob
Wednesday, 10 May 2006
Readers Write: Feedback to Lots of Questions and Comments!
Click
HERE FOR MY PODCAST ON READER FEEDBACKI touch on Hansen (HANS) first and then answer a few questions and comments about my blog and stock picking.
Bob
Sunday, 7 May 2006
JLG Industries (JLG) Weekend Trading Portfolio Analysis

Hello Friends! Thanks so much for stopping by and visiting my blog,
Stock Picks Bob's Advice. As always, please remember that I am an amateur investor, so please remember to consult with your professional investment advisors prior to making any investment decisions based on information on this website.
Another of the tasks that I like to accomplish on weekends is to take a closer look at the actual stocks that I hold in my trading portfolio. I am currently up to 23 positions, and reviewing one every other week, going alphabetically, should take me almost one year.

Two weeks ago I
reviewed Healthways on Stock Picks Bob's Advice. Going alphabetically, I am now up to JLG Industries (JLG). I currently own 320 shares of JLG which were purchased 1/12/06 with a cost basis of $25.81. I have yet to sell any of these shares. JLG closed at $29.54 on 5/5/06, for an unrealized gain of $3.73 or 14.5% since my purchase. Currently, planned sales would be to sell all of my shares if the stock hit an 8% loss or dropped to .92 x $25.81 = $23.75. On the upside, if the stock should appreciate 30%, I plan on selling 1/6th of my shares or 53 shares. The first targeted sale is at 1.3 x $25.81 = $33.55.
I last
reviewed JLG on Stock Picks Bob's Advice when the stock was trading at $51.55/share. JLG split its stock 2:1 on March 28, 2006, giving this pick an effective price of $25.78. Let's take another look at this holding of mine and see if the numbers are still promising!
1. What does the company do?According to the
Yahoo "Profile" on JLG, this company
"...provides access equipment and highway-speed telescopic hydraulic excavators. The company operates through three segments: Machinery, Equipment Services, and Access Financial Solutions."
2. How about the latest quarterly result?On February 22, 2006, JLG
reported 2nd quarter 2006 results. Revenue in the quarter ended January 29, 2006, grew 40% to $494 million, from the prior year same period. Net income was up 265% to $27.4 million from $7.5 million, and per share this year the company reported $.52/share, up over 200% from last year's $.17/share.
3. How about longer-term results?The
Morningstar.com "5-Yr Restated" financials on JLG shows that revenue actually declined from $1.0 billion in 2001 to a low of $751 million in 2003. Since 2003, however, revenue has resumed its steep climb to $1.2 billion in 2004, $1.7 billion in 2005 and $2.0 billion in the trailing twelve months (TTM).
Earnings also have been a bit erratic dropping from $.40/share in 2001 to a loss of $(1.18)/share in 2002. However, the company turned profitable at $.15/share in 2003 and has been steadily improving this number with $.60/share reported in 2005 and $1.14/share in the TTM.
The company does pay a small dividend which was $.02/share in 2001, $.01/share in 2002 and the same since then. The company has been expanding its float somewhat with 84 million shares outstanding in 2001, growing to 93 million in 2005 and 106 million in the TTM.
Free cash flow, which was a negative $(121) million in 2003, improved to $(24) million in 2004, turned positive at $96 million in 2005 and grew to $99 million in the TTM.
The balance sheet looks solid with $183.3 million in cash and $700.4 million in other current assets, which, when balanced against the $360.4 million in current liabilities, gives us a 'current ratio' of 2.45. In addition, JLG has $325.3 million in long-term liabilities. Thus the current assets are sufficient to easily cover the current liabilities and are enough to also pay off all of the long-term liabilities as well.
 4. How about some valuation numbers on this stock?
Reviewing
Yahoo "Key Statistics" on JLG, we find that the company is a large cap stock with a market capitalization of $3.12 billion. The trailing p/e is a moderate 27.20, with a forward p/e even nicer at 16.50 (fye 31-Jul-07 estimated). Thus, with the steady growth, the PEG ratio (5 yr expected) comes in at 1.27.
According to the
fidelity.com eresearch website, JLG is in the "Farm/Construction Machinery" industrial group. Within this group, JLG is moderately priced with a Price/Sales ratio of 1.5. Topping this group is Joy Global (JOYG) with a ratio of 3.9, next are JLG and Caterpillar (CAT) both with ratios of 1.5, Deere (DE) at 1.0, Terex (TEX) at 1.0 and AGCO (AG) at 0.5.
Returning to Yahoo, we find there are 105.51 million shares outstanding and 103.60 million that float. Currently 6.99 million shares (4/10/06) are out short representing 6.9% of the float or 5.3 trading days of volume. Using my own 3 day rule on short interest, I think this level of short sellers
is significant and may add to a move higher in the stock especially if the upcoming earnings are good.
Yahoo reports the estimated forward dividend is $.02/share yielding 0.2%. The last stock split was a 2:1 split on March 28, 2006.
5. And what does the chart look like?If we look at the
"Point & Figure" chart on JLG from StockCharts.com:
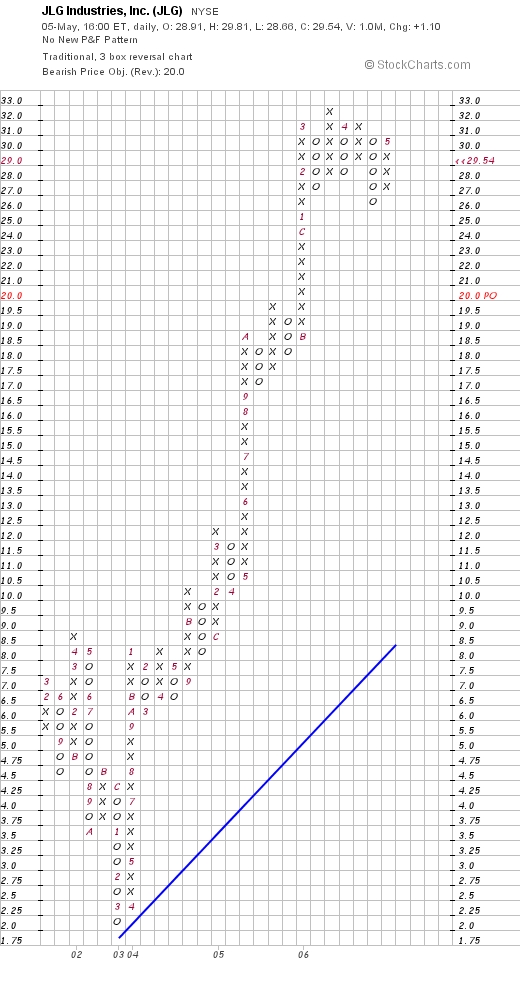
We can see that the price dropped from $8.50 in April, 2002, to a low of $2.00/share in March, 2003. However, starting with a sharp rise in April, 2003, from $2.25 to $8.00 in January, 2004, the stock has been moving strongly higher to its current level of $29.54. If anything, with the stock flying high above its "blue support line" the stock looks a bit over-extended in price.
6. Summary: What do I think?
First of all, I am terribly biased about this stock as I own shares! But reviewing this analysis, the company had a terrific earnings report and has another one coming in a couple of weeks. Hopefully that report will be well-received. The Morningstar.com page looks nice for the past few years, after a couple of years of week results between 2001 and 2003. Earnings have been growing, the company pays a small dividend, and free cash flow is positive and improving. On a negative not, the company has been issuing shares, with a small amount of dilution effects. Finally, the balance sheet is solid and the chart looks strong. On a valuation basis, the forward p/e is under 20, the PEG is about 1.25, and the Price/Sales ratio looks reasonable within its group.
I still like JLG.
Thanks so much for stopping by and visiting! If you have any comments or questions, please feel free to email me at bobsadviceforstocks@lycos.com or just go ahead and leave your messages right on the blog. Please also remember to stop by and visit my Stock Picks Bob's Advice Podcast Website!
Bob
"Looking Back One Year" A review of stock picks from the week of February 14, 2005
Hello Friends! Thanks so much for stopping by and visiting my blog,
Stock Picks Bob's Advice. As always, please remember that I am an amateur investor, so please remember to consult with your professional investment advisors prior to making any investment decisions based on information on this website.
The weekend is drawing to a close and I still haven't done all of my homework :(. So hear goes!
First of all, one of the tasks I give myself each weekend is a review of past stock picks from a period about a year earlier. I am actually up to about 60 weeks out. In this review I assess what would have happened if I had purchased the stocks I mention in equal dollar amounts from that period of time and if I had held them to the present. What is called a "buy and hold" approach.
In fact, I do not follow or advocate this strategy. I have implemented a strategy in my own trading account that includes selling stocks quickly after a purchase if they drop 8%, and selling portions of my stocks at targeted appreciation levels. This strategy would definitely affect the performance of any portfolio using these stock picks. But for the sake of ease of measurement, I like to assume this "buy and hold" strategy to determine performance.

On February 15, 2005, I
picked Ansys (ANSS) for Stock Picks Bob's Advice at $37.03/share. ANSS closed at $56.88 on May 5, 2006, for a gain of $19.85 or 53.6% since posting.

On April 27, 2006, Ansys
reported 1st quarter 2006 results. Revenue grew nicely to $46 million from $37.6 million in the same quarter last year. Net income was up to $12.9 million or $.38/diluted share, up from $9.7 million or $.29/diluted share in the same quarter last year.

On February 18, 2005, I
posted Allscripts Healthcare Solutions (MDRX) on Stock Picks Bob's Advice when it was trading at $13.16. MDRX closed at $18.35 on May 5, 2006, for a gain of $5.19 or 39.4%.
On May 2, 2006, MDRX
announced quarterly results. Total revenue for the quarter ended March 31, 2006, was $42.2 million, up strongly from revenue of $26.2 million in the same period the prior year. Net Income, however, was flat at $1.3 million or $.03/diluted share, unchanged from $1.3 million or $.03/diluted share the prior year same period. Without growth in earnings, the stock gets an automatic thumbs down.
So how did these two picks do? In a word, terrific. In fact, averaging the performance of these two picks results in an average gain of 46.5%. Please remember that past performance is no guarantee for future stock appreciation. But that was pretty nice!
Thanks so much for stopping by and visiting! If you have any comments or questions, please feel free to leave them on the blog or email me at bobsadviceforstocks@lycos.com. Also, be sure to visit my
Stock Picks Bob's Advice Podcast Website.
Bob
Newer | Latest | Older


