Stock Picks Bob's Advice
Saturday, 14 April 2007
Genentech (DNA) "Long-Term Review #6"

Hello Friends! Thanks so much for stopping by and visiting my blog, Stock Picks Bob's Advice! As always, please remember that I am an amateur investor, so please remember to consult with your professional investment advisers prior to making any investment decisions based on information on this website.
One of the problems about blogging for a long time and writing many entries is that the early entries more or less get buried under the later discussions. A few months ago I started digging back to the first entries on this website to find out how they turned out. I already do the one year retrospective. The early entries are going on four years out. I want to know what has happened to all of them and if these stocks still deserve to have a spot on my blog in a favorable light.
On February 24, 2007, I wrote up my "Long-term review #5" Agree Realty. ADC was posted on May 16, 2003. The next entry on the blog is dated May 19, 2003, and is about Genentech (DNA). I wrote:
"May 19, 2003 Genentech (DNA)
Overall a lousy day in the market. Genentech (DNA) tops the largest percentage gainers today with news about a new possible treatment for Colon and Rectal Cancer. Advanced colon and rectal cancer has a rather dismal prognosis and we all know people who have succumbed to the disease. Anyhow Genentech has a new drug called AVASTIN which along with traditional chemotherapy has successfully extended the lifespan of individuals in their study who have this life-threatening illness.
A nice coincidence for us is that Genentech FITS our protocol...last quarter (ending 3/3103), per our cnn.money site, revenues rose 29% (!) to $768.6 Million, net income rose 59% to $151.5 Million.(!)...
Looking at the past 5 years, as we like to do around here, we find that the revenue has increased from $1.2 billion in 1998, 1.4 billion in 1999, 1.7 billion in 2000, 2.2 billion in 2001, and 2.7 billion in 2002. Extrapolating this latest quarter (x4) gives us over 3.0 billion for 2003. The consistency of the revenue growth is impressive.
The last four quarters as reported in Morningstar (prior to the CURRENT quarter noted above), we find that revenues increased by 13.59%, 26.45%, 21.40%, and 29.69%....and the latest quarter up by 29% as well. Cash flow has improved...from 81 million positive in 2000, to 267 million in 2001, and 265 million in 2002 the latest year reported.
So at the moment (12:05 pm CST), stock is at $53.04 up $15.14 (WOW), p/e is a bit steep (to say the least) at 212.40....yikes....but otherwise this stock fits the bill....would add a position in my own portfolio (I do not own any shares nor does anyone in my family)...but I do not have a stock that needs to be sold due to a gain....but this is one for the list. Good luck investing. Bob"
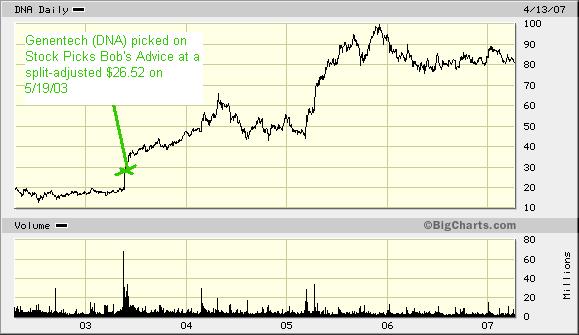
Genentech was "picked" for Stock Picks Bob's Advice when it was trading at $53.04 on May 19, 2003. DNA split 2:1 on May 13, 2004, making my effective "pick price" actually $53.04 x 1/2 = $26.52. DNA closed at $81.33 on April 13, 2007, for a gain of $54.81 or 206.7% since posting. I do not own any shares nor do I have any options or contracts on Genentech (DNA).

Let's take a closer look at this stock and see if it still deserves a spot here!
What exactly does this company do?
 According to the Yahoo "Profile" on Genentech (DNA), the company
"...engages in the discovery, development, manufacture, and commercialization of biotherapeutics in the United States."
How did the company do in the latest quarter?
On April 11, 2007, Genentech announced 1st quarter 2007 results. For the quarter ended March 31, 2007, operating revenue came in at $2.84 billion, up 43% from the $1.986 billion in the same period last year. GAAP net income increased 68% to $706 million from $421 million in the prior year first period. GAAP earnings per share jumped 69% to $.66/share vs  $.39/share reported in the 1st quarter of 2006. Continuing earnings per share were $.74/share in the quarter.
The company beat expectations on both revenue, which according to Thomson Financial, analysts had been expecting $2.74 billion, as well as earnings, which were expected to come in at $.67/share.
How have they been doing longer-term?
Reviewing the Morningstar.com "5-Yr Restated" financials on Genentech, we can see the steady increase in revenue from $2.6 billion in 2002 to $9.3 billion in 2006. Earnings have climbed from $.06/share in 2002 to $1.97 in 2006. Shares have been stable and actually have dipped from 2002 with 1.067 billion shares in 2002 and 1.051 billion in 2006 and 1.053 billion in the trailing twelve months (TTM).
Free cash flow has been strongly positive and growing with $545 million in 2004 increasing to $924 million in 2006. The balance sheet looks solid with $2.49 billion in cash and $3.21 billion in other current assets. This total of $5.70 billion can easily cover the $2.16 billion in current liabilities and yields a healthy current ratio of 2.64. DNA also has $3.21 billion in long-term liabilities on the books per Morningstar.
What about some valuation numbers?
Looking at Yahoo "Key Statistics" on DNA, we can see that this is a large cap stock with a market capitalization of $86.66 billion. The trailing p/e is a bit rich (but not as rich as back in 2003!) at 41.31, but the forward p/e (fye 31-Dec-08) is estimated at a much more reasonable 23.44. In fact, with the rapid growth in earnings (5 yr expected) estimated, the PEG works out to a very nice 0.99. Generally PEG ratios between 1.0 and 1.5 are reasonable from my perspective.
According to the Fidelity.com eresearch website, Genentech (DNA) has a very reasonable Price/Sales (TTM) of 9.23, well below the industry average of 94.68. The company is also far more profitable than its peers with a Return on Equity (TTM) of 24.47% compared to the industry average of (2.69)%.
Finishing up with Yahoo we can see that there are 1.05 billion shares outstanding with 1.05 billion of them that float. As of 3/12/07, there were 8.71 million shares out short representing 3.2 trading days of volume or 0.8% of the float. This does not appear to be a big factor in this heavily traded stock.
No dividend is paid per Yahoo and as I noted above, the last stock split was a 2:1 stock split on May 13, 2004.
What does the chart look like?
If we look at a price chart from BigCharts.com on Genentech (DNA) , we can see that the selection of Genentech back in mid-2003 was really very fortunate as it came just as DNA was making a very large move higher. (My regular "point & figure" charts from StockCharts.com are currently unavailable.)
Summary: What do I think about this stock?
In a word, this was one great stock that got away :). In any case,
GENENTECH (DNA) IS RATED A BUY
The latest quarter was solid as the company beat estimates. The company has continued to demonstrate solid performance in both revenue and earnings growth the past several years. Free cash flow is growing, the balance sheet is solid, and the number of shares outstanding is absolutely stable. Valuation is becoming more reasonable with a forward p/e in the 20's, a PEG under 1.0, a Price/Sales below its peers, with a ROE showing stronger profitability than similar companies in its industry. Finally, the chart appears to be strong. I would like to see a "point & figure" chart on this one....In any case, this company I "picked" back in 2003 still deserves a spot here on the blog!
Thanks again for visiting! If you have any comments or questions, please feel free to leave them on the blog or email me at bobsadviceforstocks@lycos.com. If you get a chance, be sure and visit my Stock Picks Podcast Website, where I discuss some of the stocks I write about here on the blog.
Have a great weekend everyone!
Bob
Posted by bobsadviceforstocks at 11:24 PM CDT
|
Post Comment |
Permalink
Updated: Saturday, 14 April 2007 11:31 PM CDT
A Reader Writes "Here are a few more questions for you:"
CLICK HERE FOR MY PODCAST ON INVESTING PHILOSOPHY
Hello Friends! Thanks so much for stopping by and visiting my blog, Stock Picks Bob's Advice! As always, please remember that I am an amateur investor, so please consult with your professional investment advisers before acting on any information on this website. Even as I answer your occasional emailed question, please always keep this in mind.
 I have been having an interesting conversation with Eric N. who followed up his last letter with some more questions. I would like to share with you his questions as well as my responses. Eric, if you or any other reader has additional questions or comments, please feel free to leave them on the blog or email me at bobsadviceforstocks@lycos.com. I enjoy receiving correspondence from readers and I hope that my my amateur yet experienced perspective is helpful to all of you. I do not claim to have all of the answers, or even that my answers are necessarily "right". I can only respond to your inquiries from my own perspective.
Eric wrote:
"Hi Bob,
Thank you so much for answering my questions! You have been VERY helpful! I really appreciate the way you take the time to answer each question so thoroughly. I look forward to keeping you posted as I try my hand at trading.
Here are a few more questions for you:
Do you also have other investments in mutual funds, CD's, bonds, etc.? Or, do you stick to the stock market?
You have mentioned that you like to invest about $5000 in a new position. If I was to hold to this as well I would only be able to invest in 5 positions or so. Would you recommend having fewer positions and relatively more invested in each one, or more positions and relatively less invested in each one?
When charting the gain/loss of each position, do you use some sort of spreadsheet to do this (i.e. Excel) or does Fidelity.com provide the tools you need to track each position's information?
To avoid possibly losing more than 8% on a particular stock or the stock falling below half of its highest appreication target, do you watch your stock constitently throughout the day? Or, do you check everything out at the end of the day and make your moves then? ...or, do you do something completely different?
You talked about 'signals' from your portfolio. Are these the rules that you laid out yourself to determine when you should sell/buy, etc.? Or, am I missing the point?
As you explained your approach to buying and selling you said, "On sales on "bad news", I do not replace these stocks unless I am at my minimum level or 6 position portfolio."
Could you please expand on this comment? When do you replace the stocks? Is it only when you sell on 'good news' that you replace the stock and otherwise you just sit on the money?
Also, I really like the way you analyze various stocks, rate them, and give your take on the situation. It is great stuff! Keep it up!
Thanks for your help and sharing your wisdom with us.
Best wishes,
Eric N."
Eric, thanks so much for writing. I do not claim that what I write is wisdom. You flatter me with those words. But perhaps it would be correct to say that I have been following the market and reading about stocks for many years and maybe from that experience I can share with you my best guess on your questions. As always, please consult with your professional investment advisers as you make decisions. I shall try to answer your questions from my own perspective.
First of all, insofar as other investments are concerned, I do have a retirement account at work that is chock-full of mutual fund investments. I am mostly invested in T Rowe Price funds, which is the fund family that I chose for my 403B. I recently was notified that my employer will be switching to Fidelity, where there are Price funds available, but I shall have to review those options at that time. I also have a small account with a broker-friend that is invested in some Unit Trusts as well as a few American Funds investments as well as a tax-free Muni bond fund.
I also have some retirement funds that are managed by professional managers who invest directly in individual stocks. I do not always know what is in those accounts, but when I write up a stock and suspect I own some shares, I try to doublecheck and post on my entry.
I do not own any Bonds directly. So to answer your question, I do have mutual funds and other managed accounts. But I have chosen to manage my "Trading Account" along the lines of my blog. I believe it will be successful, but this is an ongoing experiment for me.
You had a question about what to do if you put $5,000 in each position and could only own 5 positions. I do believe that is a perfectly satisfactory way to start an account. What I would suggest, is that you determine how much you can add to that account each month. For instance, you might be able to add $250 or $500 each month to the account automatically. Assuming you want to have $5,000 per position, instead of buying a new position when you sell a portion of a stock at a gain, I would instead keep adding that money to the cash side until you reach your new $5,000 level, and then add a new position. Figure out ahead of time how many positions you would like to have.
If you like the idea of 25 positions as a long-term goal, I would keep adding new positions regardless of how the existing positions do if there is enough cash until I got to neutral or 12 positions. If instead you wanted to have a maximum, for example, of 16 positions, then I would keep adding positions until I reached "neutral" in my investing posture, or 1/2 of the maximum positions which in that case would be 8. After that, I would only add a new position if I both had enough $'s, and I had a signal to add a position.
I have not been using any spreadsheet to follow my investments. Although it might indeed be a great idea! Instead, I use the information available on my Fidelity.com account (I am starting to sound like an advertisement...I suspect the same information would be available with other brokerage houses as well....just check before opening an account). I can see the current % change from investment, the account lists the closed trades so I can tell how many times I have sold a stock. For an investment like Starbucks where there have been several sales, I literally find myself counting on my fingers :) to determine how many sales and the next sale point. I am sure there are automatic ways which would be easier---I just don't employ them.
Again, on a sale on the downside, which as you point out would either be at an 8% loss after a first sale, at break-even if I had already sold a portion at a 30% gain, or at 1/2 of my highest % appreciation level if I have sold more than once at gains...I do this manually. I just check the account when I have time during the day. Sometimes I miss a buy or miss a sale. In which case, I usually check pretty close to opening on the next day.
On the "signals"....these are what I call the sales in my existing portfolio. I have divided these sales up into what I would label "good news" sales or "bad news" sales. The cases of good news sales are those times when a holding of mine hits a sale point on an appreciation move. For instance, reaching a 30%, 60%, 90%, or 120% appreciation target. At that time, my system dictates that I should sell a portion (as long as this is the first time the stock has hit that appreciation point), and this is what I call a "signal" to add a new position.
Sales on the downside are what I call "bad news". This "signal" is just a directive to sit on my hands and not, in fact, do anything.
So these are the "signals" I talk about. I also refer to this as my "Zen" approach. The ability to listen to my own portfolio which is 'talking ot me!'. This thought was derived from the William O'Neil CANSLIM approach where Mr. O'Neil, who I greatly admire, comments about the "M" in CANSLIM which for one thing means "Market". O'Neil suggested that one should try to get a feel for the market itself when buying. I don't have the exact quote, but I recall that O'Neil pointed out that when selling stocks at a loss, the market is essentially telling you that it is not a good time to be buying. About the worst thing you can do is to limit your losses and then buy another position in a 'bad' market that is declining. You will manage to literally compound your losses.
It really seemed to me that there should be a corollary with this, that is, if the market was telling you to 'sit on your hands' as the stocks declined and hit sale points, shouldn't there be a different signal within your own portfolio to tell you that the 'coast is clear' that it is a good time to be buying? It is from this that I thought it wise to use my own portfolio as stocks hit appreciation targets to be a "signal" to buy another position.
You asked about 'replacing stocks'. The only time I replace a stock on 'bad news' sales is when I am at a minimum position level. For me, I have set that up as 6 positions. Since my trading strategy depends on some sort of stock portfolio barometer, I need to be owning stocks at all times. Just not fully invested. Think of my investing posture as shifting between minimally invested in stocks (6 positions) and maximally invested (25 positions). I like to say that half way between these two 'postures' I am in a "neutral" position.
When I buy a new position on a sale on good news I am never 'replacing' a stock. That is, I have only sold a portion of my holding, so it is a new position. (I do reserve the right to 'change my mind' as I did recently, switching from my AZZ investment to my BLUD investment which appeared to be more in line with my own philosophy). At 25 positions, if I sell a portion on good news, that is appreciation, then I shall be using that cash (finally) to pay down the margin in my account. I do NOT suggest you use margin. My goal is to be reducing that margin amount. Margin does help on the upside as leverage but it also makes the swings more violent in a correction as your losses are magnified relative to your equity. Not a good thing for your blood pressure :).
On the downside, I "sit on my hands" with the funds or proceeds generated from a sale. That is, except if I am at my minimum number of positions which I have set at 6. Thus, with sales on bad news, as might happen overall in a severe bear market, I would expect my stock holdings to diminish in number and my cash to increase.
Years ago I read a book by Robert Lichello called "How to make $1,000,000 in the Stock Market--Automatically". You probably can find a used copy of this on Amazon for a buck. Might be worth your look. The take-home from Lichello was his search for some sort of automatic shifting between equity and cash in response to market action. His system was probably better than mine. Seriously. I suspect there is a big delay to my own system as my trades will lag the market. But there should be some effect in a prolonged bear or a prolonged bull market to change my own exposure to equities automatically. At least that is my goal.
I hope that my comments have not been too long, too tiresome, or too difficult to grasp. I don't think they are very complicated, I try to keep things simple.
I always say I don't think I necessarily have the best approach to investing at all. I am not even sure what I do will work long-term. But with the blog, I have been able to publicly set up a strategy for investing, set up rules for myself, and all of you can follow along with me as I learn what works and what doesn't. Thus far, things have been going very well!
Thanks again for writing and visiting! If you have any other comments or questions, please feel free to leave them on the blog or email me at bobsadviceforstocks@lycos.com.
Wishing you a nice weekend!
Bob
"Looking Back One Year" A review of stock picks from the week of November 28, 2005

Hello Friends! Thanks so much for stopping by and visiting my blog, Stock Picks Bob's Advice! As always, please remember that I am an amateur investor, so please remember to consult with your professional investment advisers prior to making any investment decisions based on information on this website.
It is the weekend and while it is a time for kicking back and unwinding, for me it is also a time to reflect on past stock selections from this blog and find out what happened to them. If you are a regular reader here, you will realize that I try to accomplish three basic tasks on this blog. First of all I like to look at different stocks that I believe may well turn out to be good investments, second I review my actual trading portfolio sharing with all of you my actual purchases and sales in that account, and finally, I am working on my own strategy of portfolio management and responding to the market sentiment changing my own exposure to equities in the market.
In order to assess what works in picking stocks, I have been reviewing past stock selections a week at a time. Initially it really was a year ago, but with one missed weekend here and a missed weekend there, it has stretched out and really is almost a year-and-a-half out. But in any case, I am trying to go sytematically through all of the selections.
This review assumes a "buy and hold" strategy of investing. In practice, I employ and advocate a very different approach involving a disciplined buying and selling strategy of stocks that I actually own. This difference in strategy would certainly affect overall performance, but for the ease of evaluation, I shall continue with my assumed 'buy and hold' approach for this review.
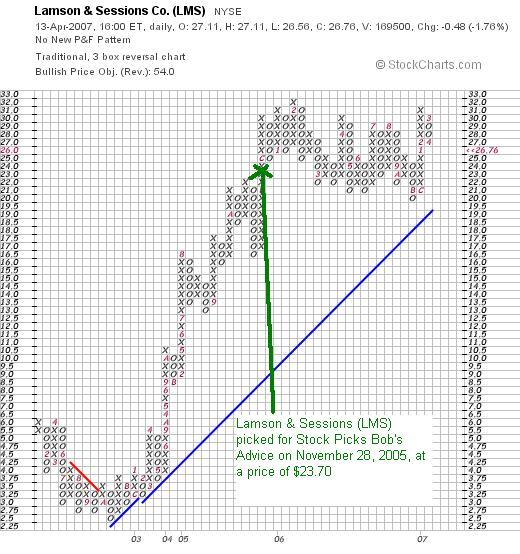
 On November 28, 2005, I posted Lamson and Sessions (LMS) on Stock Picks Bob's Advice when the stock was trading at $23.70. LMS closed at $26.76 on April 13, 2007, for a gain of 12.9%.
 On February 16, 2007, LMS announced fourth quarter 2006 results. Net sales for the quarter came in at $115.3 million, down from $143.3 million in the same quarter in 2005. Net income worked out to $4.0 million or $.25/share down from $14.6 million or $.93/diluted share in the same period the prior year.
LAMSON & SESSIONS (LMS) IS RATED A SELL
This is the "Point & Figure" Chart on Lamson & Sessions from StockCharts.com:
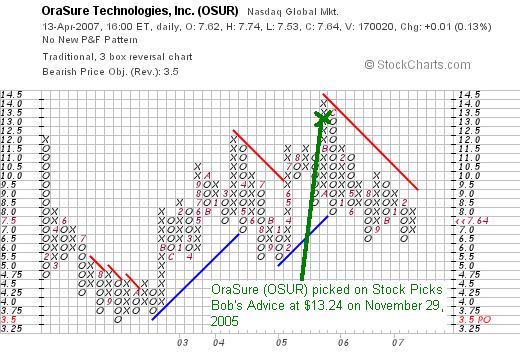
 On November 29, 2005, I posted Orasure Technologies (OSUR) on Stock Picks Bob's Advice when the stock was trading at $13.24. OSUR closed at $7.64 on April 13, 2007, for a loss of $(5.60) or (42.3)%.
On February 13, 2007, Orasure (OSUR) announced 4th quarter 2006 results. Revenue for the quarter ended December 31, 2006, came in at $17.7 million, down from $18.0 million in the same quarter the prior year. Net income came in at $1.0 million or $.02/diluted share, but excluding some stock option expenses, earnings would have been $2.5 million or $.05/share, but this is still down from $20.6 million or $.44/share. The company explains that the 2005 4th quarter included a favorable tax benefit of $17.7 million or $.38/share. But even without this, the prior year came in at $2.9 million or $.06/share. Any way you figure it, this quarter had less revenue and less earnings than the year ago period. Thus,
ORASURE (OSUR) IS RATED A SELL
This is the "Point & Figure" chart on Orasure (OSUR) from StockCharts.com:
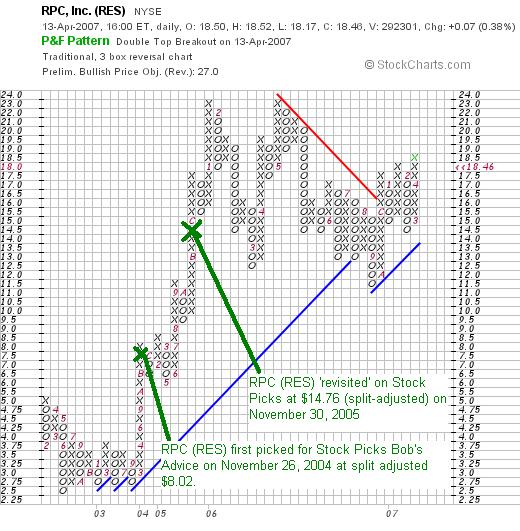
 Finally, on November 30, 2005, I posted a "revisit"of RPC (RES) on Stock Picks Bob's Advice when the stock was trading at $33.20. RES had a 3:2 stock split on December 13, 2005, and another stock split on December 12, 2006, making my effective stock pick price actually $33.20 x 2/3 x 2/3 = $14.76. (The stock also split 3:2 on March 11, 2005, making the original 'pick' on November 26, 2004, which was selected at a price of $27.07, effectively picked at $27.07 x 2/3 x 2/3 x 2/3 = $8.02. RPC (RES) closed at $18.46, thus showing a gain of $3.70 or 25.1% since being selected on November 30, 2005.
On February 7, 2007, RPC (RES) reported 4th quarter 2006 results. Revenue for the quarter ended December 31, 2006, increased 36.4% to $160.3 million from $117.6 million in the prior year same period. Net income was $29.5 million or $.30/diluted share, up from $21.5 million or $.22/diluted share last year.
RPC (RES) IS RATED A BUY
Let's take a look at the "Point & Figure" chart on RES from StockCharts.com:
So how did we do during that week of November 28, 2005? I picked two stocks with moderate gains and one stock with a big loss. The average performance of the three was a loss of (1.4)%. This again points out the importance of limiting losses in a portfolio!
Thanks again for stopping by! If you have any comments or questions, please feel free to leave them on the blog or email me at bobsadviceforstocks@lycos.com. Have a great weekend everyone!
Bob
Satyam Computer Services (SAY) "Revisiting a Stock Pick"
Hello Friends! Thanks so much for stopping by and visiting my blog, Stock Picks Bob's Advice! As always, please remember that I am an amateur investor so please remember to consult with your professional investment advisers prior to making any decisions based on information on this website.
I hope you are all having a nice weekend! It is a beautiful day here in Wisconsin. We had a late snow storm but that has all melted now and looks like we will have a partly cloudy day in the 50's. Pretty normal Spring weather for these parts.
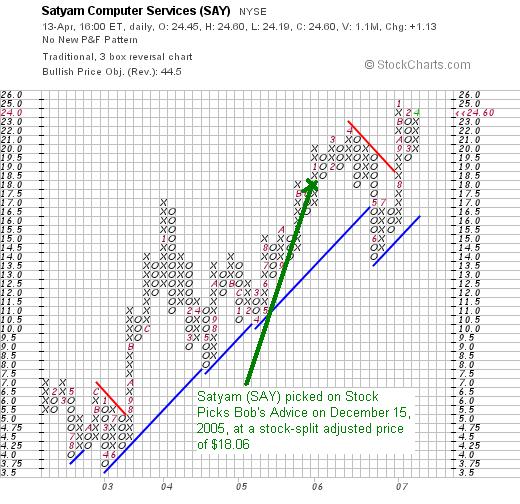
 Yesterday afternoon I was going through the list of top % gainers and came across an 'old favorite' of mine on the page. (I loosely use the term 'old favorite' when I see the name of a stock that I have previously reviewed on this blog!) Satyam Computer Services (SAY) made the list closing at $24.60, up $1.13 or 4.81% on the day. I first reviewed Satyam a little over a year ago on December 15, 2005, when the stock was trading at $36.11. On October 18, 2006, Satyam declared a 2:1 stock split making my effective pick price actually $18.06. With yesterday's close at $24.60, this represents a gain of $6.54 or 36.2% since posting.
I do not own any shares nor do I have any options on this stock.
Let's take a closer look at this stock, and I will show you why I believe Satyam still deserves a spot on this blog and why
SATYAM (SAY) IS RATED A BUY
What exactly does this company do?
According to the Yahoo "Profile" on Satyam (SAY), the company
 "...together with its subsidiaries, operates as a consulting and information technology (IT) services company. The company provides various IT services, including, application development and maintenance services, consulting and enterprise business solutions, extended engineering solutions, and infrastructure management services. It offers consulting and enterprise business solutions services in the areas of enterprise resource planning, customer relationship management and supply chain management, data warehousing and business intelligence, knowledge management, document management, and enterprise application integration."
How did the company do in the latest quarter?
On January 19, 2007, Satyam announced 3rd quarter 2007 results. Revenue for the quarter came in at "Rs. 1661.12 crore" up 31.3% year over year and up 3.7% sequentially. Net profit came in at "Rs. 337.23 crore" representing a year-over-year growth of 25.02%. Earnings came in at "Rs. 5.14" representing a 23% increase over last year's results. In addition, the company revised guidance upwards to "Rs 20.90" from previous estimate of "Rs. 20.73 to Rs. 20.81". (With Satyam based in India, results are posted in Rupees (Rs).)
How has the company done longer-term?
Reviewing the Morningstar.com "5-Yr Restated" Financials on Satyam (SAY), we can see the steady revenue growth from $415 million in 2002 to $1.1 billion in 2006. During this time, earnings have steadily increased from $.26/share in 2003 to $.75/share in 2006. The company initiated dividends in 2005 at $.10/share and increased this payout to $.11/share in 2006. Shares outstanding have been very stable with 317 million shares reported in 2003, increasing only to 320 million in 2006 and 324 million in the trailing twelve months (TTM). This is less than a 2% increase in the float while revenue was up over 100% and earnings 200%.
Free cash flow has been positive and improving with $73 million reported in 2004 and $109 million in free cash flow in 2006.
The balance sheet is pristine with $696.5 million in cash, which alone could cover both the $139.1 million in current liabilities and the $47.7 million in long-term liabilities more than 3x over! Calculating the current ratio, the combined $1.02 billion in total current assets, when compared to the $139.1 million in current liabilities yields a Current Ratio of 7.32. Generally a ratio of 1.25 or higher is considered 'healthy'! This is one of the highest current ratios of any stock on the blog!
What about some valuation numbers?
Taking a look at Yahoo "Key Statistics" on this company, we can see that Satyam (SAY) is a large cap stock with a market capitalization of $8.08 billion. The trailing p/e is a reasonable 27.64 with a forward p/e (fye 31-Mar-08) estimated at 24.12. With the steady growth, the PEG (5 yr expected) comes in at a reasonable 1.09. (reasonable for me is 1.0 to 1.5).
According to the Fidelity.com eresearch website, the Price/Sales (TTM) for SAY is a bit rich at 5.93, with an industry average reported to be at 4.17.
Profitability, as measured by the Return on Equity (ROE) is a little better than the average company in its industry, coming in at 25.31% with an average reported to be 22.18%.
Back to Yahoo: there are 328.55 million shares outstanding with 299.6 million that float. As of 3/12/07, there were 2.1 million shares out short representing 2.1 trading days of volume (the short interest). This does not appear very significant to me.
As noted above, the company pays a dividend with a forward dividend now at $.15/share, yielding .6%. The last stock split, as I already noted, was on October 18, 2006, when the company issued a 100% stock dividend, splitting its shares 2:1.
What does the chart look like?
Looking at the "Point & Figure" Chart on Satyam (SAY) from StockCharts.com, we can see that the upward move on this price chart is essentially undisturbed. Recently, the stock had a small correction betwen $22/share in April, 2006, to a low of $14/share in June, 2006, before resuming its upward move to its current level of $24.60, near its all-time high of $25. The chart looks strong to me.
Summary: What do I think about this stock?
Well, I like the numbers and the financial performance. I have some personal concerns about the effects of outsourcing, but I do believe this is a trend that we shall all need to be dealing with in the future. The latest quarter was strong, the company has been performing nicely the past four years with steady revenue, earnings and free cash flow growth. The number of outstanding shares is stable. They have initiated a dividend and are already increasing it. The balance sheet is solid. Valuation is reasonable with a PEG under 1.5. The Price/Sales is a bit rich, but the Return on Equity is ahead of its peers. Finally the chart looks nice.
There is little not to like quite frankly. It is a foreign stock and there is a bit of a leap of faith in dealing with companies based outside the United States but the world is getting smaller all the time and portfolios deserve to include the best companies and wherever I can find reasonably reliable numbers (and my Morningstar reports!), I feel comfortable adding companies like this to my 'vocabulary' of investing!
Thanks again for stopping by and visiting! If you have any comments or questions, please feel free to leave them on the blog or drop me a line at bobsadviceforstocks@lycos.com. I would appreciate if you could at least give me your first name and a location for reference in possible blog posts. If you get a chance, be sure and drop by and listen to my Stock Picks Podcast Website.
Have a wonderful Spring weekend everyone!
Bob
Friday, 13 April 2007
A Reader Writes "Do you mind sending a copy of your portfolio to me?"
Hello Friends! Thanks so much for stopping by and visiting my blog, Stock Picks Bob's Advice! As always, please remember that I am an amateur investor, so please remember to consult with your professional investment advisers prior to making any investment decisions based on information on this website.
I had a follow-up letter from Eric N. who had some more questions for me about my own particular trading portfolio. I really enjoy receiving letters from readers. It helps me know that people are interested in what I write, and also lets me know about what they are interested in reading. If you have any comments or questions, please feel free to drop me a line at bobsadviceforstocks@lycos.com.
Eric N. wrote:
"Hi Bob,
I realize I wrote you before asking some questions that may have some very long and complex answers, and let's face it, I am sure you have better things to do with your time than to answer every question that comes at you from a newbie seeking advice. If you were not to answer I would not be offended by any means, and I understand the questions asked weren't as simple as 'yes' or 'no.' Since it probably is unreasonable to expect answers to the questions I previously emailed you, do you mind simply sending a copy of your portfolio to me? I am curious to know which stock make up each percentage of your total investment.
Thanks again for your time. I do look forward to hearing back from you.
Cheers,
Eric N.
P.S. If you do not have the energy or time (or desire) to answer my emails please let me know so I can know to stop bothering you."
First of all, thank you so much for writing Eric! I am always delighted to hear from a "newbie" with investing questions. As I wrote you, I tried to reassure you that I also am an amateur investor, but I have likely been 'around the block' a few more times than you!
Also, I wrote up your last letter and tried to answer all of your questions the best that I could. And I am always happy to share with readers my actual portfolio. I have done so previously, and if you go through the entries, I believe I reviewed all of my holding withing the past month or two. But let me give you an updated rundown on the stocks in my portfolio.
The important thing about this blog, is not to copy or emulate the stocks that I own, although you are welcome to do so. Rather, like the parable about teaching a man to fish, it is more important to understand not the fish that I have caught, but how I was able to catch the fish. O.K. the whole thing is starting to sound 'fishey' but I think you understand what I mean.
Currently, I own 19 stocks in my own real trading account. The following is the list of the stocks I own, the number of shares held, current value of the holding, the % of the entire portfolio, the cost basis, date of purchase, the closing price (4/13/07), and the percentage gain (loss) on the holding.
1. Immucor (BLUD), 180 shares, $6,130.80, 5.2%, $33.86, 4/5/07, $34.06, .59%.
2. Bolt Technology (BTJ), 150 shares, $5,587.50, 4.7%, $17.44, 1/12/07, $37.25, 113.63%.
3. Cerner (CERN), 120 shares, $6,651.60, 5.6%, $49.76, 2/2/07, $55.43, 11.39%.
4. Coach (COH), 71 shares, $3,691.29, 3.1%, $8.33, 2/25/03, $51.99, 524.03%.
5. Covance (CVD), 119 shares, $7,292.32, 6.2%, $62.61, 4/9/07, $61.28, (2.13)%.
6. Cytyc (CYTC), 188 shares, $6,480.36, 5.5%, $14.86, 1/29/04, $34.47, 132.03%.
7. Hologic (HOLX), 120 shares, $7,143.60, 6.1%, $55.58, 1/31/07, $59.53, 7.1%.
8. Harris (HRS), 120 shares, $6,072.00, 5.2%, $50.05, 1/31/07, $50.60, 1.1%.
9. Jones Soda (JSDA), 250 shares, $7,055.00, 6.0%, $18.22, 3/12/07, $28.22, 54.91%.
10. Kyphon (KYPH), 125 shares, $6,012.50, 5.1%, $29.21, 5/20/05, $48.10, 64.64%.
11. Morningstar (MORN), 140 shares, $7,352.80, 6.2%, $32.57, 11/22/05, $52.52, 61.23%.
12. Precision Castparts (PCP), 100 shares, $10,269.00, 9.0%, $69.05, 10/24/06, $102.69, 48.72%.
13. Quality Systems (QSII), 88 shares, $3,459.28, 2.9%, $7.75, 7/28/03, $39.31, 407.3%.
14. ResMed (RMD), 150 shares, $7,455.00, 6.3%, $29.87, 2/4/05, $49.70, 66.4%.
15. Starbucks (SBUX), 50 shares, $1,538.00, 1.3%, $11.40, 1/24/03, $30.76, 169.71%.
16. Universal Electronics (UEIC), 180 shares, $4,964.40, 4.2%, $25.24, 2/23/07, $27.58, 9.27%.
17. Meridian Bioscience (VIVO), 210 shares, $6,260.10, 5.3%, $11.13, 4/21/05, $29.81, 167.87%.
18. Ventana Medical Systems (VMSI), 188 shares, $8,576.56, 7.3%, $23.47, 4/16/04, $45.62, 94.38%.
19. Wolverine World Wide (WWW), 200 shares, $5,840.00, 5.0%, $23.55, 4/19/06, $29.20, 24.01%.
Eric, that's my portfolio as of today's close! These are the actual stocks that I own. The total value of the account is $117,832.11; I have a margin balance of $(66,134.20), leaving me with a net value of $51,997.91 on these 19 stocks.
I do not encourage or suggest the use of margin as I have done. This adds far too much risk and volatility to the mix, and I plan on paying down the margin balance as soon as I hit my 25 position maximum, with the portions of stocks sold at that time used to pay down the loan.
Thanks again for your letter! If you have any other comments or questions, please feel free to leave them on the blog or email me at bobsadviceforstocks@lycos.com.
Please remember that my stocks are just a mix of companies from my "vocabulary" of investable stocks. There are many other stocks that you can own; it is the management of what you pick that will determine your success. Good-luck and keep me posted!
Bob
Thursday, 12 April 2007
Fastenal (FAST)
Hello Friends! Thanks so much for stopping by and visiting my blog, Stock Picks Bob's Advice! As always, please remember that I am an amateur investor, so please remember to consult with your professional investment advisors prior to making any investment decisions based on information on this website.
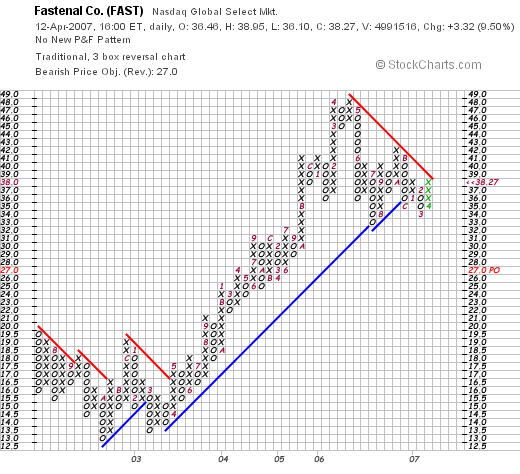
 It is getting a little late but I really wanted to get around to posting one of my favorite stocks that finally made it to the blog. Fastenal (FAST) closed at $38.27, up $3.32 or 9.5% on the day, enough to make the list of top % gainers on the NASDAQ today. I do not own any Fastenal shares directly, but my stock club does have a position in this stock.
FASTENAL (FAST) IS RATED A BUY
Let's take a closer look at this company and I will try to share with you why I believe it deserves a place in this blog, to be part of my 'vocabulary' of investable stocks!
What exactly does this company do?
According to the Yahoo "Profile" on Fastenal, the company
 "...together with its subsidiaries, engages in the sale of industrial and construction supplies. The company offers threaded fasteners, such as bolts, nuts, screws, studs, and related washers, as well as miscellaneous supplies, such as paints, various pins and machinery keys, concrete anchors, batteries, sealants, metal framing systems, wire ropes, struts, private-label stud anchors, rivets, and related accessories."
How did the company do in the latest quarter?
In fact, it was the announcement of 1st quarter 2007 results this morning that drove the stock higher today. Net sales for the quarter ended March 31, 2007, came in at $489.2 million, up 13.3% over $431.7 million in the same period last year. Net earnings increased from $47.9 million in the first quarter of 2006 to $54.0 million in the same quarter in 2007. Basic and diluted earnings per share increased from $.32/share in 2006 to $.36/share in the 2007 quarter.
The company continues to show strong sales growth as demonstrated by same store sales growth at all locations of 12.6% in January, 2007, 11.8% in February, 2007, and 15.5% in March, 2007.
The company beat analysts' expectations of $.35/share in earnings but missed revenue expectations of $493 million.
Even though this doesn't appear to be a fabulous report, apparently the street was expecting Fastenal to miss expectations. These "whisper numbers" were less than what was reported. As related:
The results surprised the market, Morgan Keegan analyst Brent Rakers said.
"The Street was overly pessimistic ... there was a whisper sent out there that the numbers were actually short of expectations," he said by phone.
As this story demonstrates, actual results are not as important as what people are actually expecting and how the resuts differ from expectations!
How about longer-term results?
Reviewing the Morningstar.com "5-Yr Restated" financials on Fastenal, we can see that the revenue of this company has been steadily increasing with $905 million in 2002 increasing to $1.8 billion in 2006.
Earnings have increased steadily from $.50/share in 2002 to $1.32/share in 2006. As an added 'plus' the company has been paying a dividend that has been regularly increased with $.03/share paid in 2002, increasing to $.31/share in 2005 and $.40/share in 2006. Meanwhile, as revenue was doubling, earnings were almost tripling, and dividends were up 13x, the outstanding shares barely budged with 150 million shares reported in 2003, increasing by 2006 to 151 million, less than a 1% increase in shares outstanding!
Free cash flow has been positive, increasing from $5 million in 2004 to $56 million in 2005 and $20 million in 2006.
The balance sheet is solid with $30.2 million in cash and $737.6 million in other current assets. This total of $767.8 million, when compared to the $103.9 million in current liabilities, yields a 'current ratio' of 7.39. In general, current ratios of 1.25 or higher are considered 'healthy'. FAST has an additional, relatively insignificant, $13 million in long-term liabilities on the balance sheet reported.
What about some valuation numbers?
Looking at the Yahoo "Key Statistics" on FAST, we see that this is a mid-cap stock with a market capitalization of $5.79 billion. The trailing p/e is moderate at 29.06, with a forward (fye 31-Dec-08) p/e estimated at 21.50. With the solid growth in earnings predicted, the PEG comes in under 1.5 at 1.44 which is reasonable in my view.
Checking the Fidelity.com eresearch website, we can see that Fastenal has a bit of a rich Price/Sales (TTM) reported at 2.92, with an industry average of 1.46. In terms of profitability, at least as measured by the Return on Equity (ROE) (TTM), Fastenal is a bit more profitable than other companies in the same industry. FAST has a ROE (TTM) of 23.10%, vs. the industry average of 17.42%.
Returning back to the Yahoo "Key Statistics" we find that there are 151.21 million shares outstanding with 125.73 million that float. As of 3/12/07, there were 11.16 million shares out short representing 8.9 trading days of volume. This is greater than my 3 day rule for short interest. Today, on the back of the better than "whispered" earnings results, the volume expanded to 4.99 million shares, almost quadruple the average volume of 1.3 million. I cannot help but wonder whether the sharp increase in share price in the face of relatively unremarkable earnings essentially in line with the analysts isn't the result of a squeeze of these many short-sellers. In any case, there well be millions of shares out short remaining to be covered if the stock continues to move higher.
As noted, the company pays a forward dividend of $.42/share yielding 1.2%. The last stock split was a 2:1 split on November 14, 2005.
What does the chart look like?
If we examine a "Point & Figure" chart on Fastenal from StockCharts.com, we can see how short-sellers might interpret the chart as showing that the stock rise from a low of $13 in October, 2002, to a high of $48 in April, 2006, had 'rolled-over' breaking through the support lines on the chart. In fact, I would like to see the stock rally past the $39 level to break past the "resistance line" as illustrated by the downward red line on the chart. I am not much of a technician, but the chart certainly does offer some concerns.
Summary: What do I think?
Well I like this stock. Enough to support it being in my own stock club although I do not personally own any shares. The company reported a solid earnings report today with growth in both revenue and earnings. They beat the 'whisper numbers' although it was a mixed bag in terms of the analysts published expectations. The Morningstar.com report is solid with steady revenue and earnings growth as well as dividend growth with a very stable outstanding number of shares. Free cash flow is positive and the balance sheet is very strong.
Valuation-wise the p/e is in the high 20's but the PEG is under 1.5, the Price/Sales is a bit rich compared to companies in the same industry, but profitability-wise, Fastenal has stronger Return on Equity (ROE) numbers than similar companies in the same industry. Finally there are lots of shares out short which likely led to a 'squeeze' of the short-sellers today. This buying demand waiting to be implemented may well provide additional support to the stock price going forward.
Fastenal is regarded in mythologic proportions in this portion of Wisconsin as Winona is just a hop-skip-and-a-jump from here. Many local investors have done very well with this stock over the years. But they have done well not because the nuts and bolts the company sellls are particularly unusual. Rather, because of the powerful management that has been able to consistently report outstanding results like they did today. The stock price has followed this fundamental progress of the company!
Thanks so much for stopping by and visiting my blog! If you have any comments or questions, please feel free to leave them on the blog or email me at bobsadviceforstocks@lycos.com. If you get a chance, be sure and visit my Stock Picks Podcast Website where I talk about many of the same stocks I write about here on the blog!
Bob
Wednesday, 11 April 2007
A Reader Writes: "I have some questions...."
Hello Friends! Thanks so much for stopping by and visiting my blog, Stock Picks Bob's Advice! As always, please remember that I am an amateur investor, so please remember to consult with your professional investment advisers prior to making any investment decisions based on information on this website.
I had the pleasure today of receiving a very nice email from Eric N., a 25 year old graduate student, who wrote:
"Hi Bob,
I really appreciate your website and the information you
provide. I a 25 year old, married, graduate student and I am new to the online
trading game, but not to the investment scene altogether. I have decided to
give the stock market a try and begin by investing $2,000 and possibly more as
time goes on.
I have some questions that I was hoping you would be able
help me with when it comes to understanding trading.
1) What are your general criteria for you to buy, hold or
sell stock?
2) How many stocks do you have? And is this collection of
stocks considered your ‘portfolio’?
3) Do you do online trading? And if so, what platform do you
use?
4) Do you use a particular kind of software?
5) How much did you initially invest?
6) How often do you buy more stock? From what I read on your
blog it sounds like it is once a week or so that you evaluate what is going on
with your stocks and make judgments then. Do you ever do ‘day trading’?
7) You mentioned in your blog on April 10th that
you rated CVD as a ‘buy,’ at about $63 a share. But, when I went to go buy it I
saw that the asking price was around $100 a share. Does that mean in order for me to make a profit the stock would have to go up 60%?
Isn’t it uncommon for a stock to increase by that much? How
did you determine that in that situation it would be a good stock to ‘buy’?
8) Do you have a limit that you do not go over when the
asking price is significantly different than the actual value of the stock?
Going back to CVD, it seems like a $37 difference is quite a
bit to me.
I have more questions, but I will leave you with these. I
really appreciate your time and help. It is very inspiring to read your blog,
but also wonderful to be able to relate with someone who is in the trenches
putting his money where his mouth is.
Thanks for what you are doing and thank you for time and
advice.
Best wishes,
Eric N."
Eric,
Thanks so much for writing! Let me try to respond to your questions in order. Please let me know if you have any further questions or comments, and if anyone else has comments, please feel free to leave them on the blog or email me at bobsadviceforstocks@lycos.com. Of course, please remember that I am an amateur investor as well! I can share with you my perspective, but I would encourage you to visit with a professional investment adviser.
1. "What are your general criteria for you to buy, hold or
sell stock?"
My first goal in this blog is to identify a pool of acceptable candidates for investment. I sometimes refer to these stocks as my "vocabulary" for investing. That does not mean in any fashion that I plan to buy any or all of these stocks. Just that they are acceptable to me at the time I review them.
There really is nothing magical about what I am looking for. I find them on the list of top % gainers where they are moving higher faster than other stocks in the market on that particular day. I insist that on the latest quarterly report that they have increasing earnings and increasing revenues. It is even better if they have beaten expectations of the analysts who follow these companies.
I am looking for consistency of results. I am hopeful if a company has had consistently good results for several years, then maybe that company will continue to have good results. I review the Morningstar.com "5-Yr Restated" financials to determine this. I am looking at the past few years in revenue, earnings, number of shares outstanding, free cash flow, and even dividend growth. At the same time, I check the balance sheet looking for an acceptable current ratio; the ratio of current assets over current liabilities with a ratio of 1.25 or greater preferred.
I spend some time looking at valuation of the stock, looking at the p/e, PEG, Price/Sales, and return on equity. If the stock has lots of short-sellers, I consider this a potentially good sign, especially if the stock just moved higher on the back of good news.
Finally, I look at a "point & figure" chart, just hoping that the graph looks like the stock is moving higher. I do not consider myself a technician, but simply look at a chart to see if the general direction is higher.
In determining when to buy a stock, I use signals from my own portfolio to indicate to me whether it is a good time to be adding equities or moving from equities into cash. I do this by first of all establishing a pre-determined size to my eventual 'trading portfolio'. I have chosen to use 25 positions as my eventual goal. I have a "neutral" exposure to stocks of 1/2 of the maximum or 12 positions. My minimum number of positions is 6 (1/2 of the neutral exposure to equities), and my maximum of 25 positions (slightly more than twice the neutral level). My portfolio size is planned to drift between the minimum of 6 positions and my maximum of 25.
My "signal" to buy a stock is a sale of a portion of an existing position on "good news" as long as I am under my 25 position maximum. On sales on "bad news", I do not replace these stocks unless I am at my minimum level or 6 position portfolio.
The strategy of selling losing stocks quickly and completely and selling gaining stocks slowly and partially is responsible for my bias towards gaining stocks within my own portfolio. Currently, I am planning to sell 1/7th of my existing holdings (instead of the 1/6th previously employed) as a stock hits appreciation targets. I have been using targets, that are at 30, 60, 90, and 120% levels, then increasing the intervals by 30% to 60% intervals: 180, 240, 300, and 360%, then again increasing the intervals by 30% to 90%: 450, 540, 630, and 720% intervals, etc. These are what I call my sales on "good news" and give me the proverbial "permission slip" to add a new position to my portfolio.
On the downside, when I sell a stock on "bad news" I sit on my hands so to speak to avoid compounding losses. My targets for sales are a bit complex, but include an 8% loss after an initial purchase, break-even after a single partial sale at a gain (at the 30% level), otherwise if a stock that has hit more than one appreciation target (at 60% or higher), I set the sale point at 1/2 of the highest appreciation level which had triggered a sale. In other words, for example, if a holding hit a sale at a 120% appreciation target, then I would sell all remaining shares if the stock declined to a 60% appreciation level. The only time I use a sale on "bad news" as a signal to add a new position, is when I am or should be at the minimum number of positions--six stocks. In that case, I shall replace the stock sold with another purchased with the same strategy. Finally, I always reserve the right to sell a stock on whatever fundamental reason I find significant regardless of the price of the stock.
2." How many stocks do you have? And is this collection of
stocks considered your ‘portfolio’?"
Keeping this answer simple, I have 19 stocks currently in my holdings and yes I consider them my "porfolio" or my "Trading Portfolio" as I like to refer to them.
3) "Do you do online trading? And if so, what platform do you
use?"
Yes, I do virtually all of my trading online and I use Fidelity.com for this purpose.
4) "Do you use a particular kind of software?"
No. I do most everything 'manually' without software.
5) "How much did you initially invest?"
Lately, I have been trying to invest $5,000 in a new position. The size of these positions can certainly vary with what you have to invest. I probably wouldn't want to have much of a smaller size for a position than this with my own aggressive selling techniques of portions of each position.
6) "How often do you buy more stock? From what I read on your
blog it sounds like it is once a week or so that you evaluate what is going on
with your stocks and make judgments then. Do you ever do ‘day trading’?"
I generally buy stock when I have received a "signal" from my own portfolio. I generally evaluate what is going on in my portfolio every trading day. I try to write up a review of a different position in my own portfolio every two or three weeks. I also review past stock picks on the blog on a weekly basis.
I do not do day trading as such. I did make a "trade" last year on a "hunch" and it didn't work. So I am back to my "disciplined" approach.
7) "You mentioned in your blog on April 10th that
you rated CVD as a ‘buy,’ at about $63 a share. But, when I went to go buy it I saw that the asking price was around $100 a share. Does that mean in order for me to make a profit the stock would have to go up 60%?"
Hold on a second. Here is the link for Covance (CVD). I am not sure where you got the idea that Covance was $100. It currently is $60.67, actually under what I recently wrote it up for. So if you go to buy it, it shouldn't cost you much more than this depending on what the stock trades at when you go to purchase the stock. But the $100 price isn't correct.
"Isn’t it uncommon for a stock to increase by that much? How
did you determine that in that situation it would be a good stock to ‘buy’"
Is it uncommon for a stock that I own to increase 60% from its purchase price? I believe that is your question. Let me refer to my own portfolio, and I will share with you how many of my holdings have actually appreciated 60% or higher.
I currently have 19 positions in my Trading Account. These are real holdings that I really do own. Of these 19, 9 of them currently are at 60% or greater appreciation points. These stocks are Bolt (BTJ), Coach (COH), Cytyc (CYTC), Kyphon (KYPH), Quality Systems (QSII), ResMed (RMD), Starbucks (SBUX), Meridien Bioscience (VIVO) and Ventana Medical (VMSI) which all have 60% or greater unrealized gains. So Yes, I do believe that stocks can appreciate to this level, and in fact, I expect them to do so after I purchase them!
8) "Do you have a limit that you do not go over when the
asking price is significantly different than the actual value of the stock"
In general, there is always an ask price and a bid price in the stock market. Usually, the gap between these is miniscule, usually a matter of pennies. Thus, when I decide to purchase a stock, I simply buy the stock 'at the market' which usually directs my brokerage house to purchase shares at the ask price. I do not bother setting limits on purchasing stocks which many others successfully employ. I simply don't do that.
Eric, you have asked lots of great questions! I hope that my blog is helpful to you as you learn about investing. Go out and read other writers, find other investing books, listen to Jim Cramer, read the Wall Street Journal, the Investors Daily, read Kiplinger's and Money Magazine, and Smart Money, and Fortune and Forbes and loads of other books. And make up your own mind about how you should be investing!
Good-luck and keep me posted.
Bob
Monday, 9 April 2007
Covance (CVD)
Hello Friends! Thanks so much for stopping by and visiting my blog, Stock Picks Bob's Advice! As always, please remember that I am an amateur investor, so please remember to always consult with your professional investment advisers prior to making any investment decisions based on information on this website.
I had a bit of a tumultuous day in the market. My Bolt Stock (BTJ) hit a 120% sale point enabling to me to add a new position. Later in the day my IHS (IHS) hit an 8% loss and the shares were sold without reinvesting those funds. With the sale of Bolt (BTJ) I had the "permission slip" to add a new position since I was under 25 positions (my maximum). Looking through the list of top % gainers, I came across Covance (CVD) which closed at $61.91, up $1.74 or 2.89% on the day. Before the close of trading (on April 9, 2007) I purchased 119 shares of CVD at $62.52/share.
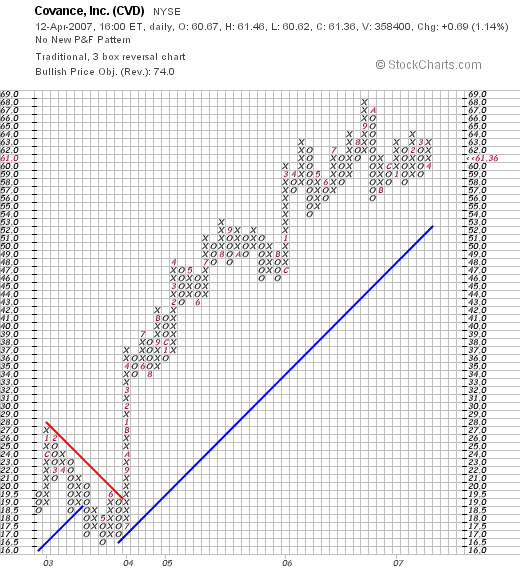
 I had promised you that I would review Covance (CVD) a few days ago, and you know how one thing leads to another, and one excuse to another excuse for not writing. Anyhow, before I get to sleep tonight, I wanted to share with you a more in depth look at this company and explain why I felt it was a good fit for the blog. Why it deserved to be part of my 'vocabulary' of stocks and why I chose to purchase shares. As noted above, I own 119 shares of CVD in my trading account. CVD closed today at $61.36, up $.69 or 1.14% on the day, but still a bit below my purchase price.
What does this company do?
According to the Yahoo "Profile" on Covance (CVD), the company is
 "...a drug development services company, provides early-stage and late-stage product development services to the pharmaceutical, biotechnology, and medical device industries worldwide. Its early stage development services include preclinical services, such as toxicology services, and pharmaceutical chemistry and related services; and clinical pharmacology services, including first-in-human trials of new pharmaceuticals."
How did they do in the latest quarter?
On January 24, 2007, Covance reported 4th quarter 2006 results. For the quarter ended December 31, 2006, total revenues increased to $359.1 million from $343.1 million in the same quarter the prior year. Net income came in at $38.3 million up from $30.0 million ($34.4 million in 2005 with one-time tax charge not included), or $.59/share, up from $.47/share in 2005 (again vs. $.54/share minus the one-time tax charge in the 2005 4th quarter).
The company met expectations on earnings at $.59/share, but missed revenue expectations of $366.2 million.
What about longer-term results?
Checking the Morningstar.com "5-Yr Restated" financials, we find that revenue has steadily increased from $925 million in 2002 to $1.4 billion in 2006. Earnings have also steadily increased from $1.03/share in 2002 to $2.24/share in 2006. While revenue was increasing 50%, and earnings up 100%, the outstanding shares was up only 7% from 60 million shares in 2002 to 64 million shares in 2006.
Free cash flow, while a bit erratic has been positive and increasing recently with $90 million in 2004, $29 million in 2005, and $117 million in 2006.
The balance sheet, as reported on Morningstar, appears solid with $219.8 million in cash and $419.8 million in other current assets easily covering both the $289.7 million in current liabilities and the $84.7 million in long-term liabilities combined. Calculating the current ratio, the total of the current assets of $639.6 million, divided by the $289.7 million in current liabilities, yields a current ratio of 2.21. A ratio over 2.0 is generally considered "healthy".
How about some valuation numbers on this stock?
According to Yahoo "Key Statistics" on Covance (CVD), this stock is a mid cap stock with a market capitalization of $3.93 billion. The trailing p/e is moderate at 27.42, and the forward p/e (fye 31-Dec-08) is estimated at 19.60. The company is growing its earnings quickly enough that the PEG ratio is reasonable from my perspective at 1.28 (5 yr expected).
Checking the Fidelity.com eresearch website for more information, we can see that the Price/Sales ratio (TTM) for CVD is reasonable at 2.75 compared to an industry average of 7.48. In addition, the company's Return on Equity (ROE) (TTM) is equally convincing, with a value of 16.72% ahead of what Fidelity calls the industry average of only .69%. Thus, the company is both 'cheaper than average' as well as more 'profitable than average' from the perspective of these two measurements.
Finishing up with Yahoo, it is noted that the company has 63.97 million shares outstanding with 63.59 million of them that float. As of 3/12/07, there were 2.16 million shares out short, representing 3.4% of the float or 6.1 trading days of volume. This short ratio above 3 is significant from my perspective, and may well be pushing the stock higher with a short squeeze if any good news is announced. Finally, no cash dividends are reported and no stock splits are reported as well.
What does the chart look like?
Reviewing the "Point & Figure" Chart on Covance (CVD) from StockCharts.com, we can see that except for a period of weakness from late 2002 into July, 2003, the stock has been moving strongly and steadily higher. The chart looks encouraging to me and not very over-extended.
Summary: What do I think?
COVANCE (CVD) IS RATED A BUY
Needless to say, I liked this stock enough to buy shares! The last quarter was solid with steady revenue and earnings growth. The company did come in a little light on revenue but earnings met expectations. In addition, the company guided to a higher rate of growth. In addition, the past several years have been solid with steady revenue and earnings growth while shares outstanding havs been reasonably stable. Free cash flow has been positive and growing, and the balance sheet is solid with very little long-term liabilities outstanding.
Valuation is good with a Price/Sales ratio low for its group while the profitability as measured by the Return on Equity was greater than other companies in its industry. The p/e wasn't very high and the PEG was under 1.5. Finally, there is even a significant short interest which may well support the price of this stock in the event of any good news announcement.
Overall I like this stock. Not as a 'get rich quick' kind of stock, but as a steady performer which has year after year been reporting steady growth. The kind of stock I enjoy having in my own portfolio.
Thanks so much for stopping by and visiting! If you have any comments or questions, please feel free to drop me a line at bobsadviceforstocks@lycos.com or just visit my blog! If you get a chance, be sure and visit my Stock Picks Podcast Website!
Bob
Posted by bobsadviceforstocks at 7:58 PM CDT
|
Post Comment |
Permalink
Updated: Thursday, 12 April 2007 9:52 PM CDT
IHS (IHS) "Trading Transparency"
Hello Friends! Thanks so much for stopping by and visiting my blog, Stock Picks Bob's Advice! As always, please remember that I am an amateur investor, so please remember to consult with your professional investment advisors prior to making any investment decisions based on information on this website.
A few moments ago I sold my 120 shares of IHS at $40.37. These shares had been purchased just last month at a cost basis of $44.16/share on 3/22/07. Thus, I had reached a loss of $(3.79) or (8.6)% since purchase. I have a rather strict 8% loss tolerance after an initial purchase. This is not a question about a particular stock, I don't know anything wrong with IHS, it is simply that to maintain my discipline of selling losing stocks quickly and gaining stocks slowly, I need to commit to following my own trading rules. I do.
As part of my strategy, since I have now sold this position on what I refer to as "bad news", I am sitting on my hands with the proceeds. I shall be waiting for a partial sale on 'good news' before adding a new position back into the portfolio.
Thanks again for stopping by and visiting! If you have any comments or questions, please feel free to leave them on the blog or drop me a line at bobsadviceforstocks@lycos.com.
Bob
Covance (CVD) "Trading Transparency"
Hello Friends! Thanks so much for stopping by and visiting my blog, Stock Picks Bob's Advice! As always, please remember that I am an amateur investor, so please consult with your professional investment advisers prior to making any investment decisions based on information on this website.
With that nickel burning a hole in my pocket, and being under my maximum of 25 positions in my Trading Portfolio, I set out to see if I could find a new candidate for purchase this morning. (It usually doesn't take me too long!)
Checking the list of top % gainers on the NYSE this morning, I found a new name, Covance, Inc. (CVD), which appeared to fit my criteria. CVD, as I write, is trading at $62.56, up $2.39 or 3.97% on the day.
Briefly, the latest quarterly report was strong, the Morningstar.com "5-Yr Restated" financials seemed solid, and the "Point & Figure" chart from StockCharts.com appeared encouraging. With a permission slip in hand, I purchased 119 shares of CVD a few moments ago at $62.52/share. Wish me luck!
COVANCE (CVD) IS RATED A BUY
I shall try to post a more detailed evaluation of this stock later today or tomorrow.
Thanks again for visiting! If you have any comments or questions, please feel free to drop me a line at bobsadviceforstocks@lycos.com or just leave your comments right on the blog! Also, if you get a chance, be sure and visit my Stock Picks Podcast Website where you can download mp3's of me explaining many of the same stocks I write about here on the website.
Regards to all of my friends!
Bob
Newer | Latest | Older


