Stock Picks Bob's Advice
Tuesday, 4 January 2005
A reader writes. "I have several questions for you..."

Hello friends! Boy was THAT a sell-off in the market today! I hit two more stops on both LSCP and PARL, two of my recent purchases that now are down 8% or more and are history. Even if I do think they are great companies, my strategy comes first!
Checking my email, I was pleased to see an excellent comment from Gus who wrote:
Hi Bob,
Thanks for providing your approach to profiting in stocks. I pass by here on occasions but have decided to make it a habit and try to learn to see what you see in the stocks you select. Your method is as good as any stock pickers service and it's free. I have several questions for you which are:
Yahoo's PEG is a 5 year PEG. So much will change in 5 years so, how can it be much of any indicator of value?
Recently, you profiled several stocks and then bought LSCP for your portfolio. What carries the most weight for your final decision?
Is there a limit to the amount a stock gains on breakout that would prevent you from buying?
WAG broke out on volume today. How would you evaluate it and why did you not profile it tonight?
Thanks for the blog and providing a place for us to learn. May you have a happy and prosperous New Year.
GusFirst of all, thank you for your kind words and coming and visiting. As I always remind all of my readers here, I AM an amateur investor (no kidding!), and even if I have some interesting ideas (I hope), please consult with your professional investment advisors to double-check everything I write here!
First, you make an excellent comment about Yahoo PEG ratios. Quite frankly, I haven't been giving that much thought because the PEG is just one small part of my whole evaluation of a stock. I like a low PEG but is it truly meaningful being 5 years out? I hope so. But if not, I don't think it is a waste to review it. Perhaps if you can find a better source for 12 month or 24 month PEGS which might be more reliable, I certainly would consider that. It is, I guess, just that Yahoo is so convenient.
Next, you ask another good observation about how I ended up with LSCP (and now have sold that stocks!), as opposed to any of the many other stocks I review. Again, I am truly very arbitrary when it comes down to a final selection if there are a few different ones I am considering. Generally, I like to find a stock to buy (when my portfolio signals me to add a position), on the same day I make the sale. Why? It is just something I do I guess. And among those stocks, I try to buy the company that might have the most sustainable earnings growth. I find myself biased towards halth technology and retail companies. I guess I feel I can understand those businesses. But I have ventured farther off the path with companies as diverse as Egg companies (CALM), perfume companies (PARL), and even military defense contractors (DRS).
Generally, I am not afraid to add a stock because I know I am quite prepared to "pull the plug" if a stock drops 8%. You also asked about stocks breaking-out, and if there was too much of a stock rise to discourage me from buying. Not really. Again, I am impressed by strong gains, not intimidated!
Finally, you asked about WAG. I didn't list WAG because I have already done so. I believe in August, 2003, and if you like, you can go to my "Stock Picks 2003" portion of the blog and find the actual posting. I have considered relisting stocks each day....but then I find my own time constraints often bumping into my grand ideas!
Thanks again for writing! I shall work hard to continue to hold your confidence.
Bob
"Trading Transparency" LSCP and PARL

Well the bear was growling today! And now all of my recent purchases have hit sell points and out they went.
Being busy today, I checked in on my portfolio only to see red all over. In fact, Laserscope (LSCP) which was just purchased on 12/31/04 for $36.30 was over 8% in the loss column and I went ahead and sold my 160 shares for $31.505, for a loss of $(4.495)/share or (12.4)%.
Parlux (PARL), which I had just purchased 300 shares at $22.23 was sold about the same time today at $20.25/share for a loss of $1.98) or (8.9)%. Yikes. I just sold three of my latest purchases the last couple of days. If THAT isn't a bearish ROAR, I don't know what is!
Thanks so much for stopping by. I will be "sitting on my hands" waiting for a sale of one of my stocks at a gain before adding any new positions!
Bob
Monday, 3 January 2005
A Reader Writes "I have a few questions"
Hello Friends! Thanks for visiting my blog,
Stock Picks Bob's Advice. Wasn't today's stock market results a LOUSY way to start off an investing year? Anyhow, I had the pleasure of getting a nice email from Joyce who wrote me today with some questions. She wrote:
Hi Bob:
I started visiting your blog recently, thanks a lot for all the information. They are very helpful.
I have a few questions:
1. What do you do when a stock starts rising but does not get to 30%, say it gets to only 10% then starts sliding? Would you sell?
2. I have noticed that you posted RIMM on one of you blogs, what do you think of the recent news on that stock?
Thanks a lot for answering the above questions and happy new year.
Joyce
Well the first question is an easy one. When I purchase a stock in my trading account, I set an 8% loss limit; in reality I use a 'mental' stop. I simply check the stock and see what the gain or loss is and when it passes 8% on the downside, I sell the holding.
In fact, I allow a stock to wander all over the range between a loss of 8% and a gain of 30% before doing anything at all. That is, if a stock is up 12 or 15% then wanders down, as you are inquiring, I am still sticking with that 8% loss point to sell the stock. That's just what I do. You might very well want to do something different.

Your second question is about RIMM. Maybe you can give me the date I discussed this, but I don't see this particular stock on the list of Stock Picks for 2003 or 2004. I do believe you are correct about your point though. And your question still is "what should a person do?"
Please remember that I am an amateur investor, so I am not qualified to dispense advice to you personally, but let me take a better look at RIMM.
Basically, on December 21, 2004, RIMM
reported 3rd quarter results. Revenue came in at $365.9 million, up 18% sequentially and 138% year-over-year. THOSE are fabulous revenue numbers.
Net income came in at $.46/diluted share, up from $.36/diluted share the prior quarter, and up over 300% from the $.10/diluted share the prior year. Once again, those are FANTASTIC results.
So WHAT was the bad news? Basically, as Reuters
reported on December 22, 2004, the revenue guidance for the 4th quarter was a bit of a disappointment for many analysts. RIMM forecast 4th quarter revenue between $390 to $410 million; three months ago RIMM had guided between $385 to $410 million. Analysts had expected revenue of $411.3 million, so this was a disappointment. However, recall that I just noted that the 3rd quarter revenue came in at $365.9 million, so they are still talking about strong sequential revenue growth!
One of the problems shows up if we look at
"Key Statistics" on Yahoo for RIMM. Here we see that the trailing p/e is at 59.86 with a PEG of 1.52. Price/sales also is rich at 13.38, and Price/book at 7.76 is no bargain. Thus, the stock is priced "near perfection" so the market is skittish at even the hint of a disappointment. Recall that stock prices are determined both by actual past results and expectations of future results.
Also, let's take a look at a
"Point & Figure" Chart from Stockcharts.com:
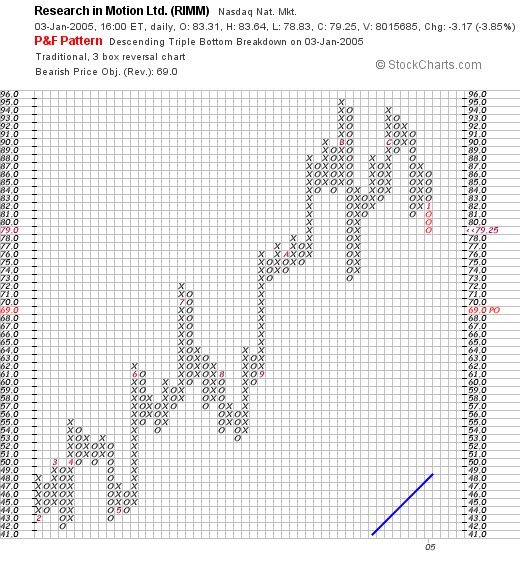
I am NOT a big technician, but the stock has been incredibly strong up to now, moving higher way above that lower blue "support line". It bothers me a little that the stock made a high around $95 sometime in November, 2004, and then only made it to $94 the second move upward, and seemingly "rolled-over" to its current downward move. But I am not one to predict future moves based on stock charts like this. I would just be cautious if I were to be buying the stock for the first time.
What to do if you hold the stock? I can only tell you what I tend to do. Since the news is really not some fundamental bad story, just that the buying public is starting to get ridiculously high expectations, I wouldn't necessarily sell based on the story. I still manage my stocks based on the stock price itself. I use all of those sell-points I discussed and try not to anticipate stock moves which almost always surprise me.
Is that an adequate answer for you? It sure WAS long-winded. If it isn't clear, feel free to re-email me or comment right here on the blog and I will try to answer your question. Remember, I cannot tell you whether RIMM or any stock is a good investment for you! I am just an amateur and you will need to see a professional investment advisor to tell you that. I can just look at a stock and tell you what I see...and what I see isn't always the best view!
Thanks so much for stopping by! Good-luck and let me know what you have done and what you are planning to do with RIMM and we will see as everything unfolds what RIMM will be doing into the future!
Bob
Posted by bobsadviceforstocks at 5:05 PM CST
|
Post Comment |
Permalink
Updated: Monday, 3 January 2005 5:12 PM CST
"Trading Transparency" DRS
Just as I expected, or perhaps should say feared, one of my recent purchases hit the 8% loss point, and was sold out of the trading portfolio. DRS Technologies (DRS) was purchased just days ago at $44.73/share. I sold 200 shares a few moments ago at $41.05 for a loss of $(3.68) or (8.2)%. This is a way that my portfolio automatically starts raising cash in a down-draft...and is a 'signal' for me to sit on my hands and hold off buying another position until such time as I sell a portion of one of my other positions at a gain target.
Thanks so much for stopping by!
Bob
Sunday, 2 January 2005
Thoughts on 2005 and developing an Investment Portfolio

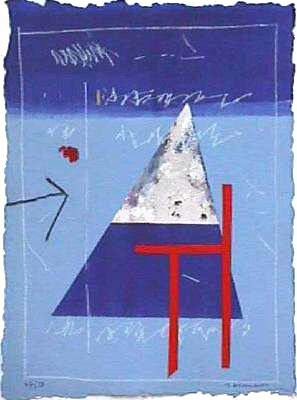
Hello Friends! I wanted to start off the New Year with a pretty poster from Richard Diebenkorn from the San Francisco Museum of Modern Art. I really enjoy some of these artists although I am even MORE of an amateur insofar as appreciating artwork!
It occurred to me that it might be a good time to once again review some investing philosophy that I utilize and help you understand what I am doing on this website. I am sure that some of you may come to my blog and say, "So what AM I supposed to do with all of these stock 'picks'?" First of all, consult with your professional investment advisor before making investment decisions. I AM an amateur after all and cannot be responsible for your actions.
After some 35 years or so of trying many different approaches to investing, I have started using what I would consider a modified CANSLIM approach to investing. I am not a contrarian investor. I do not try to outguess the market searching for hidden value. On the other hand, I am not truly a momentum investor either; I avoid chasing after stocks that do not have fundamental strength. What I try to do is to find stocks that DO have some price momentum and sort through these to identify what I believe will be consistent strength in the future.
How do I do this? As many of you know I first start with the stocks making strong percentage gains each day. I look at both the NYSE and the NASDAQ and will also check the AMEX, although the American Exchange does not seem to have as many of these "candidates" as I would like to see.
Next step is checking the latest quarterly earnings report. I want to make sure that the company is currently doing well. What do I mean by that? I believe that the ultimate price performance of a stock is mainly driven by earnings. And sustainable earnings growth, for most companies, requires associated revenue growth. And it is these two factors that I check in the latest quarterly report that I locate on Yahoo. I check for revenue growth year over year (and sequentially if possible) as well as earnings growth. How much? Well the more the better.
O.K., so if they pass this test, what is next? Well that is when I click over to Morningstar.com and locate their "5-Yr Restated" financials. You can find them by entering the stock symbol in the box at the top, clicking on financials on the left set of boxes, then "5-Yr Restated" on the row of tabs along the top.
With the "5-Yr Restated" I am looking for consistency. It doesn't have to be perfect, but I like to see a trend in again revenue and earnings growth. A smooth set of increasing bars in the bar graph is a pretty sight for me!
After this, I check the earnings on the same sheet. I don't mind if they were negative (losing money) earlier, as long as they are profitable now and improving their earnings picture as consistently as possible.
I also look at "free cash flow". The Morningstar site that I usually link to on my blog postings usually provides this information. Again, the latest number should be positive, and hopefully there is an improving trend the last few years as well.
Finally, I review the balance sheet. The most important part imho, is to check the sum of the "cash" and "current assets" against the "current liabilities". This tells me if there is any immediate problem if the liabilities are far greater than assets. I like to see long-term liabilities within "reason" and smaller is better, but if the company is showing improving free cash flow, can cover their current liabilities, well I usually am comfortable with a moderate long-term debt picture.
Assuming that things still look good, the basic tests I have presented to my stock market possibilities have been "passes", I turn to Yahoo once again to try to find some sense of "valuation". In some fashion, I try to be eclectic in my investment strategy. I do not mind borrowing from a momentum investor, looking at fundamental issues, and then looking at "value". If I can find EVERYTHING, well I figure THAT will be an even BETTER investment!
I like to get a feeling for the market capitalization. I will invest in micro or small cap stocks, and prefer a mid-cap to a large cap, but do not restrict myself to any particular size of company. I would like to see a p/e that isn't astronomical. I like companies with p/e's in the 20's that are growing at 30% to 40%/year. Thus if I can get a PEG at 1.0 or less (P/E divided by growth rate), all the more power to me. But again, this does not rule in or out a stock.
Additionally, I check the number of shares outstanding and the short interest. These are also found on Yahoo and give me a bit of an idea of the possible volatility of the stock. If there ARE a lot of shares out short, and the stock has just reported some good news....well those short-sellers might just have to scramble to cover their shares "sold short". And this might be bullish. I have arbitrarily chosen a short ratio of 3.0 as a cut-off. Greater than 3.0 is bullish for me!
I like to look at whether the stock pays a dividend, and whether the stock has recently split or not. Just gives me a little additional feeling for the stock. Again, even though I am certainly NOT an income investor, if the stock DOES pay a small dividend, and if the company has been INCREASING that dividend, well that just makes the stock a little more attractive to me.

Finally, I like to check "technicals". Through my stock club, I have gotten comfortable with "Point & Figure" charts and utilize these exclusively on my blog. I have found Stockcharts.com to be a GREAT site and encourage all of you to utilize, and even subscribe at their site if you so could benefit. These Point & Figure chart show the battle between the bulls and the bears on a particular stock. The rows of x's are stock price appreciation moves, and the rows of o's are bearish price pull backs. The lines of "support" and "resistance" are supposed to give one an idea of the general direction and limits on the price move.
Do I "believe" that charts determine stock appreciation? Well, as you might guess, I am not a big believe in anything in particular except the tremendous influence of earnings on stock price appreciation. But I do like to see a stock chart that shows what appears to be a generally appreciating stock price before investing.
Finally I pull all of this together and decide whether the stock is "investable." And further whether my portfolio is "signalling" an investment purchase, sale, or "sitting on my hands" as I like to say.
I have come to accept that it is important to have a feeling for the market as well when investing. Maybe that is something I have learned from the O'Neill CANSLIM approach. That the market (the M in CANSLIM) can determine stock appreciation or depreciation with a greater effect than the individual stock characteristics. It sort of represents a boat with a motor in an ocean current. The ocean current will pull all of the boats and it is important to understand and appreciate that effect on the individual "boat" or investment.
Furthermore, I recall O'Neill pointing out that your own portfolio will more or less "talk" to you if you are prepared to listen. That is when the market is bad, you stocks will generally fall, and when the market is strong, you will feel like a genius.
I have set up stops and sell-points on my stocks in my "trading portfolio". First of all, I have set a maximum of 25 positions that I will own in that portfolio. You might want to set something smaller or larger as your number of issues. I believe I would go to a minimum of 6 positions...12 being a neutral number, and half of that being the bearish fall-back position.
When do I add positions? When the market tells me that conditions are good. For me this means I have sold a portion of my stocks on "good news" that is stock appreciation. I start selling at 30%, 60%, 90%, 120%, then 180%, 240%.....etc. At each of these bullish sell points, I try to sell 1/4 of my existing position.
On the downside, I sell if I take an 8% loss (prior to making any sales on gains). If I have sold a portion at a gain, after the first sale, I move my sell-point up to "break-even". After that, I allow my stocks to travel back to 1/2 of the highest appreciation point....i.e. if I sold a portion at a 90% gain, then I would allow the stock to drift back to 45% gain point, if it went past that, I would sell the holding.
When I sell on bad news, I have learned to "sit on my hands." I want to avoid compounding my losses in a bad market. Theoretically, I could drop down to my minimum of 6 positions. These I would replace if they were sold. My system requires some equity exposure to allow my own internal "thermostat" to operate.
There, I have done it. I have been long-winded and I hope you haven't fallen asleep! How is the market going to do in 2005? I really don't know. I have set up a portfolio of what I think are the strongest stocks...and in sort of a "survival of the fittest" approach, many of my weaker issues get weeded out.
I try NOT to anticipate the market. To guess on which sector of stock will be hot. I do have my biases. And I do try to pick stocks over $10. And if I see a stock moving higher on the top % gainers list, and I have reviewed it in the past, if I am eligible to be buying, I will gravitate to a stock that I have "met" once before!
I hope that is helpful to all of you! Wishing you all a very healthy, happy, and successful 2005. And to all of those who have friends, families, or have suffered through the disasters of 2005, whether they be by war, famine, tsunami, quake, or personal tragedy, I wish you better fortune in the upcoming year as well! Please feel free to email me at bobsadviceforstocks@lycos.com if you have any comments, questions, or words of encouragement!
Bob
Saturday, 1 January 2005
"Looking Back One Year" A review of stock picks from the week of November 10, 2003

Hello Friends! Happy New Year! It is hard to celebrate here in the States knowing that so many people in Southeast Asia are suffering from the effects of the terrible tsunami. Please support relief work and keep all of the victims and their friends and families in your prayers.
Thanks so much for stopping by my blog,
Stock Picks Bob's Advice. As always, please remember that I am an amateur investor, so please consult with your professional investment advisors to make sure that all investments discussed here are appropriate, timely, and likely to be profitable for you. If you have any questions or comments, please feel free to email me at bobsadviceforstocks@lycos.com .
It is a weekend and that means that one of my jobs is to look back a year and see how stocks that were mentioned on this blog have performed. These stocks are not stocks that I have necessarily or even likely purchased. I purchase a tiny minority of the stocks I discuss here. And I try very hard to let you know when and which stocks I do own or buy! This discussion presumes a buy and hold strategy. In reality, I have been utilizing a very different strategy: I sell my stocks quickly at 8% losses after a purchase, and then sell slowly on gains. I also have a bit of a trailing stop; that is, if stocks gain and I sell a portion or two....well, I do not wait until I have an 8% loss to sell the remaining shares then!

On November 10, 2003, I
posted CollaGenex Pharmaceuticals (CGPI) on Stock Picks at a price of $10.45. CGPI closed at $7.34 on 12/31/04 for a loss of $(3.11) or (30.0)%.
On October 26, 2004, CGPI
announced 3rd quarter 2004 results. Total revenues were $11.1 million compared to $13.9 million in the prior year same quarter. Net income for the quarter was $1.1 million down from $1.2 million the prior year or $.05/diluted share vs. $.06/diluted share in 2003. The decline in financial results appears associated with the poor stock performance!

I
posted Coinstar (CSTR) on Stock Picks at $17.18. CSTR closed at $26.83 on 12/31/04, for a gain of $9.65 or 56.2%.
On October 26, 2004, CSTR
announced 3rd quarter 2004 results: revenue came in for the three months ended September 30, 2004, at $106.4 million up strongly from $48.7 million the prior year. However, on a fully-diluted basis, earnings per share came in at $.30/share down from $.32/share last year. Kind of a mixed-result!

On November 11, 2003, I
posted Fossil (FOSL) on Stock Picks at $28.42/share. FOSL split 3:2 on 4/12/04 for a net pick price of $18.95. FOSL closed at $25.64 on 12/31/04 for a gain of $6.69 or 35.3%.
On November 9, 2004, FOSL
reported 3rd quarter 2004 results. Net sales were up 22.5% to $236.1 million compared to $192.6 million in the same quarter in 2003. Net income jumped 39.1% to $23.4 million compared with $16.8 million, or on a diluted earnings per share basis came in at $.31, up 34.8% from $.23 in 2003. Great results!

On November 13, 2003, I
posted Whole Foods Market (WFMI) on Stock Picks at $64.68/share. WFMI closed at $95.35/share, a gain of $30.67/share or 47.4%.
On November 10, 2004,
WFMI reported 4th quarter 2004 results. Same store sales growth for the quarter came in at 14.0% (!). Overall sales grew 24% to $927.3 million, net income increased 27% to $30.2 million and diluted earnings per share jumped 21% to $.46. This was a great quarter!

On November 13, 2003, I
posted Medtronic (MDT) on Stock Picks at a price of $46.39. MDT closed at $49.67 on 12/31/04 for a gain of $3.28 or 7.1%.
On November 17, 2004, MDT
reported 2nd quarter 2005 results. Revenues for the quarter were $2.4 billion, an increase of 11% over the prior year's $2.164 billion in revenue. Net earnings were $535.7 million, or $.44/diluted share, a 13% increase over the $476.1 million or $.39/diluted share the prior year.
The last stock pick that week was Medical Technology Systems (MPP), which is now known as MTS Medications Inc., at a price of $6.00. MPP closed at $7.37 on 12/31/04 for a gain of $1.37 or 22.8%.
On November 10, 2004, MPP
announced 2nd quarter results. For the quarter ended September 30, 2004, sales increased 28% to $10.2 million from $8.0 million the prior year. Unfortunately, there are a lot of non-recurring expenses, and "pro forma" results are available: pro forma net income came in at $629,000 up 65% from $381,000 the prior year. Pro forma diluted eps jumped 67% to $.10 from $.06 the prior year. The company does explain the pro forma points, including early repayment of subordinated debt, relocation of the company's operations, and charges associated with a restricted stock grant. Apparently the "street" was satisfied with these results!

So overall, how DID we do for the stock picks that week? I had one loser (CGPI), and the other five were gains with an average overall gain of 23.1%. Not too shabby a way to start out the new year! Thanks so much again for stopping by! Please consult with your professional investment advisor. Realize that past performance is NO guarantee of future performance! If you have any questions or comments, please feel free to contact me at bobsadviceforstocks@lycos.com .
Have a Healthy, Happy, Safe, and Profitable 2005!
Bob
Friday, 31 December 2004
December 31, 2004 Laserscope (LSCP)
Hello Friends! As I just noted earlier, I purchased 160 shares of Laserscope (LSCP) today and I promised you that I would review the stock and show you why I found it attractive as an investment. As always, remember that I am an amateur investor, so please consult with your professional investment advisors prior to making any investment decisions based on information on this blog,
Stock Picks Bob's Advice. If you have any questions or comments, please feel free to email me at bobsadviceforstocks@lycos.com and I will try to get back to you, most likely with an entry right here!

This morning, looking through the
list of top % gainers on the NASDAQ, I came across Laserscope Inc. (LSCP) which, as I write, is currently trading at $35.99, up $2.40, or 7.14% on the day. According to the
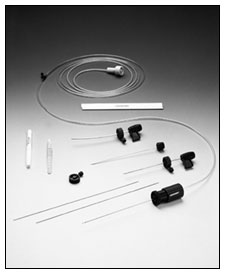
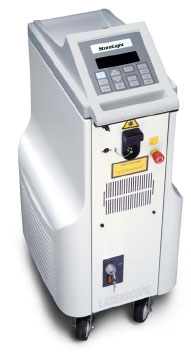
Yahoo "Profile" on LSCP, Laserscope "...designs, manufactures, sells and services, on a worldwide basis, a line of medical laser systems and related energy devices for the medical office, outpatient surgical center and hospital markets."
Taking a look at their latest quarterly report, on October 27, 2005, LSCP
reported 3rd quarter 2004 results. Revenue came in at $24.2 million, for the quarter ended September 30, 2004, a 69% increase from $14.3 million in the same quarter last year. Net income for the quarter was $4.4 million or $.19/diluted share an over 800% increase from the $533,000 or $.02/diluted share last year. These were outstanding results and the stock price has reflected this!
How about longer-term? If we take a look at the Morningstar.com
"5-Yr Restated" financials on LSCP, I do find a disturbing decrease in revenue from $41 million in 1999 to $35.1 million in 2001. This is NOT what I would call a "perfect" stock from my perspective, but everything else is in line with what I like to see. That is, since 2001, revenue has grown swiftly from $35 million to $82 million in the trailing twelve months (TTM). The latest quarterly report continues this trend.
In the same fashion, earnings, slightly erratic between 1999 and 2001, have overall increased from a loss of $(.60) in 1999 to the $.50/share in the TTM.
Morningstar reports that free cash flow which was "0" in 2001, has subsequently improved to $3 million in the TTM.
Balance-sheet-wise on Morningstar, we find $12.7 million in cash and $39.3 million in other current assets. Balanced against the $20.4 million in current liabilities and the -0- long-term liabilities, this looks solid!
What about "valuation"? Using Yahoo
"Key Statistics" on LSCP, we can see that this is a small cap stock with a market cap of $770.28 million. The trailing p/e is a bit rich (!) at 73.84, and the forward p/e isn't much better at 44.95, but the rapid growth rate gives us a PEG of 1.80, which isn't a bargain, but isn't that bad either. The Price/Sales ratio is also rich at 8.76.
Yahoo reports 21.42 million shares outstanding with 19.60 million of them that float. The shares out short as of 11/8/04 stand at 2.32 million, representing 11.86% of the float, or 4.437 trading days of volume. Using my personal 3.0 trading days as a cut-off, there ARE a few shares out short but then again, this doesn't appear to be a big issue.
How about dividends? None. And no stock splits are reported on Yahoo.
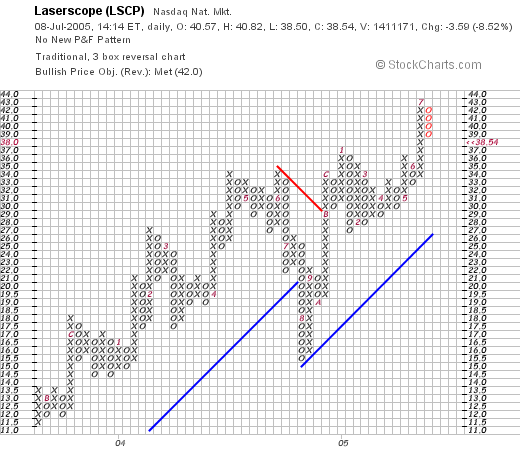
What about "technicals"? For this I like to look at a "Point & Figure" chart from Stockcharts.com. Here we can see that this stock has been trading higher since late 2002 when it was selling at $3.00/share. Sometime in July, 2004, the stock sold off, seemingly breaking down price support as it broke through $21, heading towards $16. Since then, the chart has been charging higher, breaking through a resistance level at $30 to its current level of around $35.87. The chart looks strong to me!
So what do I think? Well the stock made a strong move higher today, and does have a strong chart behind it. The latest quarter was fabulous. The last several years, if not all five, have been quite strong with solid growth in revenue and earnings and the balance sheet is solid. Valuation is a bit rich, but I believe this stock is growing so fast that this valuation may very well be worth it. In fact, I like this stock so much I bought some shares!
Thanks again for stopping by! If you have any questions or comments, please feel free to email me at bobsadviceforstocks@lycos.com .
 In this time of global disaster in Southeast Asia, I would be remiss not to say that stock performance is irrelevant to those in greatest needs and all of our prayers go out to the victims of the Tsunami in Southeast Asia. If you haven't done so already, you can donate to this effort by going to the CARE website (I have linked to CARE USA), but if you are elsewhere, there are links there as well. There are many other organizations working to raise money, so if you have had a good year investing this year, think about some of the victims who have lost families and homes this month.
Bob
"Trading Transparency" LSCP
Hello Friends! Well that nickel was burning a hole in my pocket....having sold my latest 1/4 position in COH just a couple days ago, I was now eligible to add a new position. Looking through the top % gainers today, I came across Laserscope (LSCP), I do not believe I have reviewed that one before.
A few moments ago, I purchased 160 shares of LSCP at $36.246 for a total purchase cost of $5,799.36. I will try to update the blog and take a closer look and review LSCP for all of you as well.
As always, please remember I am an amateur investor sharing with you my own thoughts on investments, so please consult with your professional investment advisors prior to making any investment decisions of your own! If you have any questions or comments, please feel free to email me at bobsadviceforstocks@lycos.com .
Bob
Thursday, 30 December 2004
December 30, 2004 Dialysis Corporation of America (DCAI)
Hello Friends! Thanks for stopping by and visiting my blog,
Stock Picks Bob's Advice. As always, please remember that I am an amateur investor, so please consult with your professional investment advisors prior to using any information on this website. I cannot be responsible for any of your losses that you may experience using any such information, nor shall I attempt to take credit for any of your gains. If you have any questions or comments, please feel free to email me at bobsadviceforstocks@lycos.com . By the way, I hope all of you have a very happy, healthy, safe, and profitable 2005!

Since so many of you who stop by here are new to what I do, I will try to review some of the techniques to find what I would call "stocks of interest". For me personally, it is from these stocks that I have been forming my portfolio. Again, what you do with these stocks should be first to discuss them with your own advisors to determine if they are appropriate, timely, and likely to be profitable for you!
It has been my experience that stocks that are making strong moves on any particular day may be among those stocks that may turn out to be good investments. Thus, I like to scan the
NASDAQ list of top % gainers. In this case, I found Dialysis Corporation of America (DCAI) on the NASDAQ list. Due to my own constraints of selling at 8% losses to prevent losses from growing too large, I have found that stocks under $10 are far too volatile for me and I prefer to avoid these issues. DCAI made the list today with a strong gain of $1.75 (or 10.02%) to close at $19.21. I do NOT own any shares of DCAI as I write this issue. (Since my last portfolio transaction was a sale of a portion of COH at a gain, I am "eligible" to add a position and certainly will be looking at DCAI in the future.)

My first "screening" step after finding a stock is to look at the latest quarter. I am not very "picky" but do insist that the latest quarter show both revenue growth and earnings growth. For this information, I generally turn to Yahoo finance which is a nice place for researching recent quarterly results.
On November 15, 2004, DCAI
reported 3rd quarter 2004 results. First on the question of revenue, for the quarter ended September 30, 2004, revenue came in at $11.0 million compared with $7.6 million the prior year. Second, earnings: net income came in at $776,000 or $.09/diluted share, compared with $308,000 or $.04/diluted share the prior year. On both counts, DCAI passes my "test".
My next step is to look a little deeper on the quality of this company. What do I mean by that? For me, quality is about consistency of growth. I am looking for those companies, boring as it may sound, that have been consistently growing earnings and revenue over several years. It is my hope, that this earnings and revenue "momentum" as you might call it, will persist.
A good friend of mine introduced me to the Morningstar.com site, and I would encourage you to get familiar, and even consider subscribing if you are so oriented. I have found much of the free material adequate for my basic needs. Looking at the
"5-Yr Restated" financials from Morningstar.com on DCAI, we can see a very pretty picture of revenue growth from $5.9 million in 1999 to $37.5 million in the trailing twelve months (TTM).
How about earnings? This has grown almost linearly (except for a dip between 2002 and 2003) from a loss of $(.10)/share to $.22/share in the TTM.
I have also been looking at free cash flow. As noted on the chart, this is the difference between "Operating Cash Flow" and "Capital Spending." Not being an accountant, I am afraid I am not qualified to expound on free cash flow, but in my simple understanding, this amounts to the actual cash being created or consumed by a corporation. (For another view on free cash flow, I would encourage you to read this
discussion on the Motley Fool site)
I prefer to see positive free cash flow, but certainly, "break-even" is preferable to negative cash flow. In DCAI's case, free cash flow, as reported on Morningstar, was $(1) million in 2001, $1 million in 2002, and "0" in 2003 and the TTM. Thus, the company is at this point neither generating nor consuming free cash. (I prefer growth in free cash, but as long as everything else is growing strongly, "0" is acceptable imho.)
How about the balance sheet? (Once again, for a more detailed discussion, I would like to refer you to the
Motley Fool balance sheet basics.) Basically, assets are dollar amounts that you own, and liabilities are dollar amounts that you owe to others. It doesn't take a genius, imho, to realize that you would rather own dollars than owe them to others! In addition, current vs. long-term, as I understand it, are assets or debts that you own or are owed divided by a twelve month period from the current time. For DCAI, from Morningstar, we can see that this company has $1.5 million in cash, and $10.3 million in other current assets. This is balanced against current liabilities of $9.2 million (with the over $11 million in cash and current assets easily covered) and $3.7 million in future liabilities (debts owed that will come due in a greater than 12 month time frame). Overall, the company appears solvent without additional cash needs at this time imho.

Thus far, I have looked at "momentum" both in terms of earnings and revenue growth, and some "fundamental" views of the soundness of the business venture, that is, 'is this company using or generating cash' and 'what is the balance-sheet like?'. This may sound like a lot of work, but if you follow my steps, I think you can see that with a few seconds of review, this information is easily available and readily understood.
My next step is an assessment of "valuation". For this I once again turn to Yahoo, and in particular for DCAI,
"Key Statistics" from Yahoo on DCAI. Here we find that this is really a small cap (under $500 million according to the
Ameritrade definitions with a market "cap" of $163.02 million. (Some people would even refer to this small a company as a "micro cap" stock (See
Investopedia.com) meaning those companies with capitalization between $50 and $300 million).
The trailing p/e is reported as a 'rich' 87.72, there is no PEG, and the Price/Sales is also a bit rich at 3.97. (imho the PEG and Price/Sales are 'bargains' when they hover near 1.0). So this is no great bargain in terms of value, but with a very fast small company, I do not personally rule out stocks on this basis, but it does give me pause.
There are only 8.49 million shares outstanding and only 6.40 million of them float. There are only 4,000 shares out short representing 0.06% of the float or 0.182 trading days, so this is not a factor imho. No cash dividends are paid, and the stock DID recently split 2:1 in February, 2004.
How about "technicals". This is my simple approach of at least looking at a chart! Personally, I believe that stock price performance is a function of the underlying fundamentals, and do not believe that stock charts determine future price performance. However, it is nice to at least look at a chart to either verify or give you pause about the rest of your assessments!
I have grown to like the "Point & Figure" charting techniques. An explanation of these charts is found on
Stockcharts.com, where I found this
"Point & Figure" chart on DCAI:
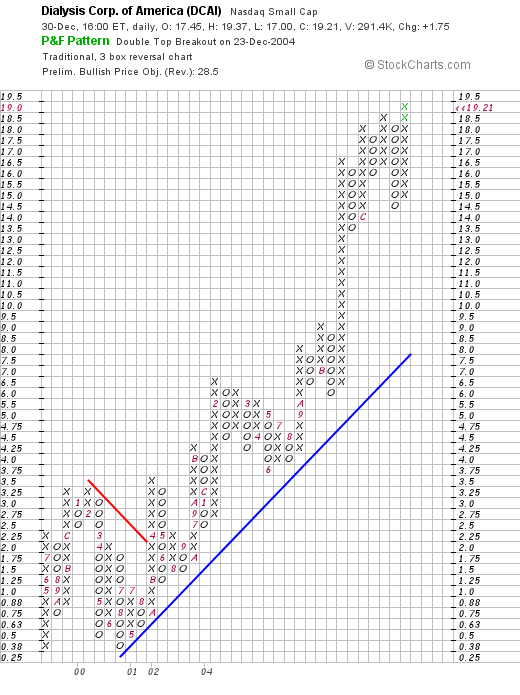
This is my kind of chart with a steadily increasing stock price going back all the way to 2001. It does appear that the stock might be a little ahead of itself, but the strength of the chart, without any sophisticated technical background, for me, is apparent.
 So what do I think? Well, let's review, first of all, the stock made a nice move today, the latest quarter was very strong, the five-year growth in revenue and earnings is impressive, the free cash flow is break-even, but the balance sheet is solid. Valuation is a bit rich, with a p/e above 70, the PEG is unknown probably because there aren't any analysts with estimates. So it is attractive as an investment to me, and since I AM in the investment market....well I will have to sleep on this one!
Meanwhile, I wish you and your friends and family, a Happy, Healthy, Safe, and Profitable 2005. Please note my priorities. Profitable is nice, but the rest is so much more important! Thanks again for stopping by, and if you have any questions or comments on what I have written, please feel free to email me at bobsadviceforstocks@lycos.com or comment right here on the blog!
Bob
Wednesday, 29 December 2004
"Trading Transparency" COH
Hello Friends! My COH hit a sell point and a few moments ago, I sold 22 shares (about 1/4) of my 90 shares remaining at $57.05. These shares were purchased 2/25/03, at a cost basis of $16.66, so my gain was $40.39 or 242.4%. This was my SIXTH partial sale of COH since the purchazse, with sales at approximately 30%, 60%, 90%, 120%, then 180%, and just now 240%.
Thus, I am now "permitted" to add a new position...but I don't see anything much interesting with the market as sloppy as it is. In addition, Starbucks (SBUX) is also approaching a sale point!
Thanks again for stopping by! Please remember that I am an amateur investor, so please consult with your professional investment advisors prior to making any investment decisions based on information on this website. If you have any questions or comments, please feel free to email me at bobsadviceforstocks@lycos.com .
Bob
Newer | Latest | Older


