Stock Picks Bob's Advice
Thursday, 18 November 2004
November 18, 2004 Genesco (GCO)
Hello Friends! Well it is another Thursday and another set of stocks to review. I hope you are all well and preparing yourself for Thanksgiving. As for me, I shall try to go a little easier on the stuffing this year. I have all the stuffing I need :).
Thanks so much for stopping by my blog,
Stock Picks Bob's Advice. Please remember I am an amateur investor, so please do your own investigation on all stocks discussed and consult with your professional investment advisors to make sure that all stocks you select are appropriate, timely, and likely to be profitable for you! If you have any comments, questions, or would like to share with our readers your own thoughts on investing, please email me at bobsadviceforstocks@lycos.com or you can always click on the links below each post to leave your message.

I came across Genesco (GCO) this morning while scanning the
list of top % gainers on the NYSE. I do not own any shares or options on this stock. According to the
Yahoo "Profile", GCO "...is a retailer and wholesaler of branded footwear. The company operates four business segments: Journeys, consisting of Journeys and Journeys Kidz retail footwear chains; Underground Station?Jarman Group, consisting of the Underground Station and Jarman retail footwear chains; Johnston and Murphy, composed of Johnston and Murphy retail operations and whole sale distribution, and Dockers Footwear."
I recall Genesco from years ago when my father, who was the one instrumental in getting me interested in stocks, told me about this shoe company. I don't remember much about what he said, except he was impressed by the management. Anyhow, GCO is having a nice day today, trading at $28.35, up $1.60 on the day or 5.98% in an otherwise lackluster trading session this morning.
Like so many stocks on this blog, what pushed this stock higher was the
announcement of 3rd quarter earnings. Net income rose to $12.1 million or $.54/share up from $9.4 million or $.42/share a year ago. Genesco also raised guidance for future sales and earnings. This was a bullish report! In a slightly
more recent report, GCO detailed their revenue and reported that sales jumped 36% during the quarter.

How about longer-term? Is this earnings and revenue growth a fluke? I believe it is the consistency in earnings and revenue growth that is the best prognosticator of an outstanding price appreciation in an investment. For this information, I like to turn to the
"5-Yr Restated" Financials on Morningstar.com. Here we can see clearly illustrated the consistent growth in revenue from $553.0 million in 2000 to $837.4 million in 2004 and $936.6 million in revenue in the trailing twelve months (TTM).
Earnings have been less consistent, but have improved from $1.05 in 2000 to $1.66/share in the trailing twelve months.
Free cash flow which was a negative $(12) million in 2002, improved to $49 million in 2004, and has stayed positive at $20 million in the TTM.
The balance sheet is solid, with $15.3 million in cash and $305.2 million in other current assets compared with $169.5 million in current liabilities and $239.7 million in long-term liabilities.
What about valuation issues? First, using the
Ameritrade definition of market capitalization, which places mid cap stocks between $500 million and $3 billion in market cap, this stock just makes the cut for a mid cap stock with a market cap of $640.16 million. The trailing p/e is nice at 17.24 (imho), and the forward p/e is nicer at 14.03.
Yahoo reports only 22.04 million shares outstanding with 19.40 million of them that float. There are 2.0 million shares out short as of 10/8/04, representing 10.31% of the float or 9.804 trading days. This seems to be quite a few shares out short, which are now facing the current good news....with a stock price appreciation, these shares may need to be covered which is a bullish statistic on this stock.
This stock does not pay any dividend and no stock splits are reported on Yahoo.
How about technicals? If we take a look at a point and figure graph from Stockcharts.com:
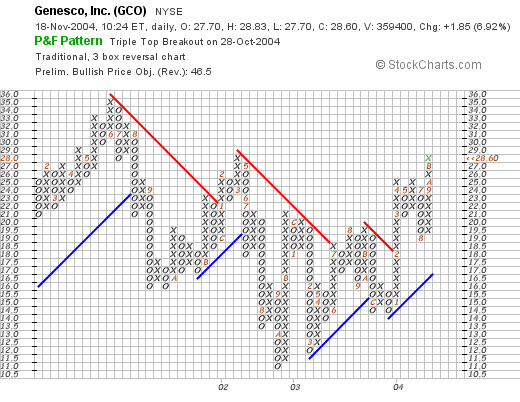
This stock appears to have been trading lower since June, 2001, when it peaked at $35.00/share, this trend appears to have been broken in mid-July, 2003, when it broke through a resistance level at $18/share, and then again more strongly in February, 2004, when it broke through a resistance level, again at $18/share. The stock appears to be heading higher and does not appear over-extended in my humble opinion.
 So what do I think? Reviewing some of the things I just went over, the recent quarterly report was strong and the company raised guidance, which I really like. In addition, Morningstar shows a steady growth in revenue, a growth in earnings not quite as steady, free cash flow being generated, a good if not spectacular balance sheet and reasonable valuation. Add in some shares out short that may need to be covered and a chart that looks strong to me....well I like this stock. Now, if I only had the means to buy some shares....but will sit on my hands until I can sell a portion at a gain!
Thanks so much for stopping by. Please remember that I AM an AMATEUR, so do your own investigation of stocks, and consult liberally with your professional investment advisors. If you have any questions, please feel free to email me at bobsadviceforstocks@lycos.com .
Regards,
Bob
Wednesday, 17 November 2004
November 17, 2004 Watts Industries (WTS)
Hello Friends! Thanks again for stopping by and visiting my blog,
Stock Picks Bob's Advice. I enjoy your visits and I love to look at and share ideas about stock market investing. By all means, please remember that I am an AMATEUR investor, I cannot in any way be responsible for any of your trades, and you should absolutely do your own investigation and discuss your ideas with PROFESSIONAL investment advisors before making any decisions. If you have any questions, please feel free to email me at bobsadviceforstocks@lycos.com . I recently got into some discussions about investing on MSN. Let me make clear my belief that there are many different ways of investing in stocks, that this method may not in the long run turn out to be profitable is a possibility, and that other methods may be more profitable is also a real and likely possibility! I hope I have cleared the air on THAT.

The market has been behaving well. Today, after a small correction yesterday, the Dow and the NASDAQ have been moving higher. Scanning the lists of top percentage gainers, I came across Watts Water Technologies Inc (WTS) which is, as I write, trading at $29.90, up $1.50 or 5.28% on the day. I do NOT own any shares of this stock. According to the
Yahoo "Profile" on Watts, WTS "...is a global manufacturer of safety and flow control products for residential and commercial plumbing, heating and water quality markets."

On November 2, 2004 WTS
announced 3rd quarter 2004 results. Sales came in at $214.8 million, a $39.3 million or 22% increase over sales in the same quarter in 2003. Net income was $13.7 million, a 54% or $4.8 million in crease compared to the comparable 2003 3rd quarter. This company has been busy making acquisitions, but clearly they appear to be handling these purchases satisfactorily, in my humble opinion.

How about longer-term? Taking a look at the
"5-Yr Restated Financials" from Morningstar.com, we can see that revenue has grown strongly from $261 million in 1999 to $705.7 million in the trailing twelve months. Earnings per share have grown from $.56/share in 1999 to $1.21 in the trailing twelve months. Dividends have also increased from $.18/share in 1999 to $.25/share in the TTM.
Free cash flow, while not increasing, has been steady ranging from $35 million in 2001 to $30 million in 2003. The company, according to the Morningstar.com data, has $149.4 million in cash and $331.1 million in other current assets. These are compared with $172.3 million in current liabilities and $229.9 million in long-term liabilities. This looks adequate if not spectacular.
How about valuation questions? For this I like to turn to
Yahoo "Key Statistics" on WTS. Here we can see that this is a mid-cap stock with a market capitalization of $967.03 million. The trailing p/e is reasonable at 19.47, and the forward p/e is nicer at 16.33. They have this company down as a PEG of 1.33, but with the current earnings results, I suspect this is currently closer to 1.0.
There are only 32.35 million shares outstanding with 20.20 million of them that float. Yahoo reports 377,000 shares out short representing 1.87% of the float or a bit heavy at 4.833 trading days. The company does pay a dividend of $.28/share yielding 0.99% and the last stock split reported on Yahoo was a 2:1 split in March, 1994.
How about Technicals? For charts, I turn to
Stockcharts.com and I prefer to look at a Point & Figure Chart:
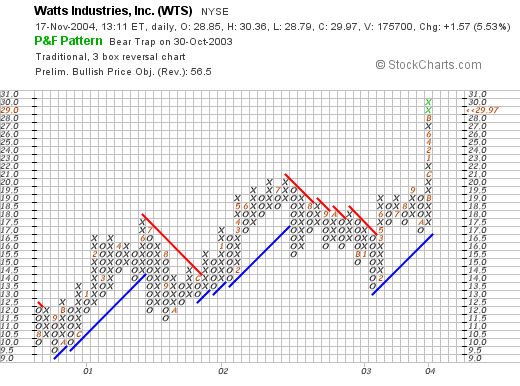
With this chart, we can see that the stock appeared to be slowly appreciating between 2001 and July, 2002, when it broke through a support level at around $17/share dropping to $13.50 around January, 2003, and has traded higher steadily, recently breaking out past $19.50 to its current level. The chart looks strong, perhaps a bit over-extended?
So what do I think? This is a basic manufacturing company which has recently been fairly active purchasing other companies. They appear to be doing this quite effectively and are growing their revenue along with their earnings, maintaining their free cash flow, having an "adequate" balance sheet (imho), and what appears to be reasonable valuation. I like this stock even though it is not in the medical field where I have had some success around here, and would be in the market to purchase some shares if only my trading system allowed me to add another position. I am close to a sell point for a couple of my issues, and I may be in the market soon!
Thanks again for stopping by! If you have any questions, comments or words of encouragement, please feel free to email me at bobsadviceforstocks@lycos.com .
Bob
A Reader Writes "a friend e-mailed me today..."
Hello Friends! If you are a regular reader around here I am sure you know how much I appreciate getting some feedback from all of you readers who stop by. I received a nice email from Forrest who wrote:
a friend e-mailed me today your latest letter detailing NAVR, it was the first time I had heard about you. Anyway I have an expensive subscription to CNBCU so I checked out NAVR. It came back with the best fundamental scores of any stock I have seen in the approximately 3 months I have had the CNBCU resource. Needless to say I will jump on board and have recommended others take a look at it also. Technically I find it a little overbought at the moment and will be watching to enter at the end of this pullback. I have bookmarked your site and expect to be a frequent visitor. Many thanks ForrestThanks Forrest for the kind words! Please remember that I am an amateur investor so please do your own investigation of all stocks discussed and discuss them further with professional investment advisors. It is nice to know that NAVR has a good rating, because I just bought some!
Thanks again for stopping by and please visit and write often! If you have any other questions, comments, or words of encouragement, please feel free to email me at bobsadviceforstocks@lycos.com and I will try to get back to you either on the blog or by email ASAP.
Bob
Monday, 15 November 2004
"Trading Transparency" Navarre Corp (NAVR)
Hello Friends! Well you KNOW how that nickel ALWAYS burns a hole in my pocket. Well with the sale of a portion of my Dell last week at a gain, that enabled me to add a position to the portfolio. As you may recall, I have about 16 positions, with a maximum of 25 planned.
I checked the top % gainers today and saw an old favorite of mine, Navarre Corp. (NAVR). I had
posted NAVR on Stock Picks on June 30, 2004. Today, I picked up 400 shares in my trading account for $17.897, for a total cost of $7,158.80.
As always, remember I am an AMATEUR investor, so please consult with YOUR professional investment advisors prior to making any investment decisions based either on information posted here or my own trading activity! If you have any questions or comments, please feel free to email me at bobsadviceforstocks@lycos.com .
Regards!
Bob
Sunday, 14 November 2004
November 14, 2004 GameStop (GME)
Hello Friends! Thanks for stopping by my blog,
Stock Picks Bob's Advice. Well it is Sunday evening, and I really INTENDED to post this one on Friday, but I just never got around to it. Well there is still time to talk about GameStop (GME). Needless to say one more time, I am an AMATEUR investor, so please consult with your professional investment advisors prior to making any investment decisions based on information found on this website. I cannot be responsible for YOUR investment decisions, so please do your homework, and make sure that all investments are appropriate, timely, and likely to be profitable, before making investment decisions. As always, I would be delighted to hear from any of you if you have any comments, questions, or words of encouragement. In addition, tell me what you are doing and how my blog might be helping you think about investing and I will share it with our readers! Email me at bobsadviceforstocks@lycos.com if you get inspired!

For any of you who are new to this website, I have lots of additional discussions, and you can access these "picks" by clicking on the dates along the left side of the page on
Stock Picks Bob's Advice. If you are reading this blog posting on a third party site, well I certainly apprreciate the third parties who run my blog, but feel free to come to my own website to get a better idea of what this is about!
Phew. That was wordy.
If you are a regular around here, excuse me as I explain the steps I use to find stocks, and why I do this. First step, was to review the
lists of top % gainers on the NYSE (as well as the
list of top % gainers on the NASDAQ). I haven't found the
list of top % gainers on the AMEX to be quite as helpful. A couple of years ago I noticed that it might be profitable to look at these lists to identify stocks with strong same day momentum that might have the ability to yield stock price appreciation. In other words, if it is going up strongly today, it just might have enough momentum to keep going up!
Generally, I have found it best to restrict my analysis to stocks near or higher than $10.00. Looking through the lists, I came across GameStop (GME), a stock which I do NOT own any shares. GameStop closed on 11/12/04 at $23.50, up $2.11 or 9.86% on the day. According to the
"Snapshot" on CNN.money, GameStop's "...principal activity is to sell video games and PC entertainment software."

Before I "approve" of a stock as a pick, I insist that the latest quarterly report is a good report. What is good for me? I like to see increasing revenue AND increasing earnings year-over-year, and sequentially if possible.
For the latest quarterly report, I like to search through the Yahoo finance section, scrolling back to an earnings report. GME
reported 2nd quarter 2004 results on August 17, 2004. For the quarter ended July 31, 2004, sales increased 13% to $345.6 million comparted to $305.7 million the prior year same quarter. Net earnings increased to $7.7 million compared to $6.6 million the prior year. On a diluted earnings per share basis, this was an 18% increase to $.13/diluted share compared with $.11/diluted share in the same quarter last year. This was a solid result!

What about some more information...has this been a consistent grower? I believe that the market values consistency, and I do too. What we are hoping when we look at a consistent record, is that the future will also continue to be positive. For this information, I turn to
Morningstar.com. On this site, I checked for the
"5-Yr Restated Financials".
First thing I like to review are the bar-graphs at the top of this page. Here we can see that revenue has grown steadily from $553 million in 2000, to $1.67 million in the trailing twelve months (TTM). A steady increase is important to me!
Next earnings: On a per share basis, they increased from $.87/share in 2003 to the $1.08 in the TTM. (Since there is no data on this previous to 2003, I can deduce that this was when the company came public, and indeed was a spin-off from Barnes and Noble).
Third, "Free Cash Flow". This is in the middle section on the page, and whereas I would prefer to see a steady increase in free cash flow, at least it is positive, at $45 million in the TTM, compared to $7 million in 2004, even though it is lower than the $58 million in 2002, and the $53 million in 2003. Still, as long as it is improving over the short-term, and is positive, the company may be considered to be 'creating' cash rather than 'burning' up its available cash resources.
Fourth, I check the balance sheet. I am NOT an accountant or even a business person. But I know that I would like to see MORE assets than liabilities and would prefer to see current assets and cash much more than current liabilities. In this case, GME has $159.7 million in cash, not quite enough to cover the current liabilities of $220.3 million, but they also have an additional $224.9 million of other current assets so that coverage of current liabilities is a breeze, and the $20.9 million in long-term debt is no big deal either. (In my humble opinion!)

What do I do next? Now that I have looked at some basic fundamental questions, I like to look at a value perspective. For this I turn to the
"Key Statistics" from Yahoo. Some numbers I like to review include the market cap: for GME this is $1.32 billion making it a mid-cap stock, the P/E ratio which isn't bad at 21.60, and the forward P/E is even better (fye 31-Jan-06) at 16.10.
The Price/Earnings Ratio (P/E) means different things to different investors. William O'Neill, who developed the CANSLIM technique and is the publisher of the
Investor's Business Daily, advocates little weight to the P/E, but rather invest with the strongest technical and fundamental growth. However, imho, if all things are equal, why NOT be impressed by a low p/e stock?
A better question though is "What is low?" Many growth investor's have used the PEG ratio, called by the Motley Fools, the
"The Fool Ratio". This is a ratio of the P/E to the anticipated growth rate. This takes into consideration the fact that a stock that is growing very quickly really DOES deserve a higher p/e that a company whose earnings is NOT growing that fast. Stocks generally with a PEG at or near 1.0 are 'fairly' valued, less than 1.0 is even nicer! For GME, the PEG ratio is 0.95 which is excellent!
Also on this page of Yahoo, we can see the number of shares. For GME there are 56.32 million shares outstanding and 20.10 million that float. That means, imho, that there are something like 36 million shares or so that are 'tightly held' and not out on the market being traded.
Another statistic I like to review on this page are the number of shares out short. Short sellers are speculating that the stock will be declining in price, thus they borrow shares to sell and then to close the transaction, they purchase shares (they hope at a lower price), to replace the borrowed shares. Short sellers represent pessimists on the stock, they also represent individuals that MUST buy shares if the stock moves against them to limit their losses. (A rising stock price is a losing investment for short-sellers!) Thus, for GME, there are 2.74 million shares out short as of 10/8/04. This is an increase in shares out short from 2.38 million shares and represents 13.62% of the float. More importantly, the short raio is 9.036. That means it would take 9.036 days of the current average trading volume for the short sellers to buy enough shares to cover their borrowed position. For my purposes, I use (and this is just me!) 3 days as a cut-off. That is 9 days is quite a few, and is a BULLISH factor for the stock.
Finally, I take a look at the dividend (none) and the latest stock split (none).
So now, I have basically covered the issue of momentum, a fundamental analysis of the stock with a look at the earnings, free cash flow, and balance sheet, and a value oriented approach looking at the p/e, PEG ratio, and short-interest.
Finally I like to look at a bit of the technical analysis that chartists like to do. I do a very simple job of looking at a Point and
Figure Chart, made popular by
Tom Dorsey.
I use
Stockcharts.com to view a
point and figure chart on GameStop:
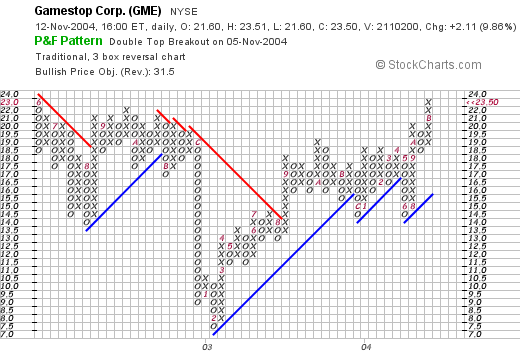
Here we can see that the stock was trading lower between June (represented by a red #6) of 2002, through August of 2003 (a red #8). At that point the stock broke through a resistance level at around $14/share and it has basically headed sideways, breaking out higher in August, 2004. That is about the extent of my chart-reading, but the stock chart looks bullish to me.
At this point I like to think back about the research I have done and summarize. The latest quarterly report looked strong with both earnings and revenue growth. Morningstar showed that the revenue has been growing the past five years, and the earnings at least since 2003. Free cash flow is positive, recently growing and the balance sheet looks nice! Valuation-wise, the P/E is just over 20 and the PEG is under 1.0. In addition, there are a lot of shares out short, and that is a bullish factor imho. Finally, the chart looks just fine!
As far as my own trading portfolio, I DID just sell some of my DELL at a gain, so I CAN add a position. If GME still appears the best choice tomorrow, I might be adding a few shares!
Thanks again for stopping by! If you have any questions, or comments, please feel free to email me at bobsadviceforstocks@lycos.com .
Have a great week everyone!
Bob
Saturday, 13 November 2004
"Looking Back One Year" A review of stock picks from the week of September 29, 2003

Hello Friends! Thanks so much for stopping by my blog,
Stock Picks Bob's Advice. What I try to do in my own amateur way on this website, is to identify stocks that I believe show potential for price appreciation. Since I am an amateur, and NOT a professional, please use your professional advisors to determine if any stock ideas here are appropriate, timely, and likely to be profitable for you! I have been running this blog for about a year and a half, and it is my belief, if we can review past picks, we can find out about what worked and what did not. In any case, please feel free to drop me a line at bobsadviceforstocks@lycos.com and let me know what you think about the blog, how you use it in your own investment thinking, and any other comments or questions! Thanks again for stopping by.

On September 29, 2003, I
posted SFBC International (SFCC) on Stock Picks at a price of $30.25. SFCC split 3:2 on May 20, 2004, making our effective pick price actually $20.17. SFCC closed on 11/12/04 at $36.22, for a gain of $16.05 or 79.6%.
How about the latest earnings? On October 27, 2004, SFCC
announced 3rd quarter 2004 results. Revenue for the third quarter 2004 ended September 30, 2004, came in at $40.4 million up 38.8% from $29.1 million for the same quarter in 2003. Net earnings for the quarter increased 53.9% to $5.3 million compared with $3.4 million for the same quarter in 2003. Earnings per fully diluted share came in at $.34 in the quarter compared with $.28 in 2003, a 20.9% increase. More recently, on 11/3/04, SFCC
raised 2004 guidance from $147-$155 million in revenue to $150-$157 in revenue, and earnings of $1.16-$1.23/share up to $1.20-$1.25/share. Great earnings and raised guidance are my two favorite things to see on a stock!

I
posted Ann Taylor Stores (ANN) on Stock Picks on 9/30/03 at a price of $32.14. ANN split 3:2 on May 27, 2004, making our effective pick price actually $21.43. ANN closed at $23.35 on 11/12/04 for a gain of $1.92 or 9.0%.
On November 10, 2004, ANN
announced 3rd quarter 2004 results. Sales increased 16% to $460.4 million from $396.8 million a year ago. Same store sales grew an anemic 1.4%. However, third quarter earnings dropped 53% to $14.2 million or $.20/share compared with $30.3 million or $.42/share a year ago. This is NOT the kind of results I look for on this blog, I actually owned and sold ANN in my
current trading portfolio, and do not currently own any shares.

Now here is a stock that I wrote up on this blog and NEVER bought a share! On 10/1/03, I
posted TASER Int'l (TASR) on Stock Picks at a price of $29.25. TASR split 3:1 2/11/04, and then 2:1 4/30/04. After the first split, our effective price was $9.75/share. However, after the SECOND split, the adjusted cost works out to $4.88/share. TASR closed at $57.50/share on 11/12/04 for a gain of, drum roll please......$52.62 or 1,078%. YIKES and I never bought a share :(.
And what about earnings? On October 19, 2004, TASR
reported 3rd quarter 2004 results and also raised guidance for the rest of 2004. Revenues for the quarter came in at $18.9 million, up 211% from revenues in the same quarter in 2003. Earnings were $6.1 million or $.21/basic share. Net income was up 469% over the prior year and up 36% over the previous quarter. On a diluted basis, net income came in at $.19/share this quarter up from $.04/share the prior year same quarter. This was a great result, and TASR recently, on 11/4/04,
announced a 2:1 split, the third split this year!

On 10/2/03, I
posted UTStarcom (UTSI) on Stock Picks at $35.23/share. UTSI closed at $18.68 for a loss of $(16.55)/share or (47.0)%.
On October 26, 2004, UTSI
announced 3rd quarter 2004 results. The company reported a 10% rise in sales to $645 million from $584.4 million last year. However, earnings plummeted to $5 million down 90% from $59.1 million or $.04/share down from $.46/share last year. Even though the company forecast robust growth into 2005, the current results and the lackluster results anticipated in the next quarter held back the stock price!

On October 3, 2003, I
posted Bentley Pharmaceuticals (BNT) on Stock Picks at $15.69/share. BNT closed at $8.80/share on 11/12/04, for a loss of $(6.89) or (43.9)%.
On 11/3/04, BNT
announced 3rd quarter 2004 results. Adjusted for currency fluctuations, sales rose 12.4% to $18.1 million in the quarter. Net income for the quarter came in at $1.4 million or $.06/diluted share compared with $1.3 million or $.06/share last year. (Diluted shares increased 2.3% to $22.7 million). This result was clearly not adequate to move the stock price higher!

Finally, on October 3, 2003, I
posted Genesis Microchip (GNSS)on Stock Picks at $13.28. GNSS closed at $16.96 on 11/12/04 for a gain of $3.68 or 27.7%.
On 10/25/04, GNSS
announced 2nd quarter 2005 results. For the quarter, total revenues DECREASED to $50.1 million compared with $52.8 million last year. And the company had a net LOSS of $(.3) million or $(.01)/share, an improvement sequentially, and also an improvement from the loss of $(.12)/share last year. The stock price has performed adequately, but these are not the kind of growing profits I would prefer to see in a stock on this blog!
So how did we do? Well because of the AMAZING performance of TASR, our results were fabulous! For these six stocks, we had an average gain of 183.9% !!!. Now THAT is something we probably will NEVER see looking back one year, but it was fun to post!
Thanks again for stopping by! Please remember that past performance is NEVER a guarantee for future performance, that I am an AMATEUR, and that you should consult with professional investment advisors prior to making any investment decisions based on information on this website!
If you have any questions, comments, or words of encouragement, please feel free to email me at bobsadviceforstocks@lycos.com .
Have a great weekend everyone!
Bob
Friday, 12 November 2004
"Trading Transparency" Dell Computer (DELL)
Hello Friends! Just a quick note to let you know I sold a portion of my DELL at a gain. I just sold 30 shares at $40.41 for a net of $1,212.27. These shares were acquired 2/14/03 at $25.13/share. I made my first sale (original 200 share position) on 6/6/03 of 50 shares for net proceeds of $1,589.47. This worked out to a price of $31.79 or a gain of $6.66 or 26.5%. The current sale was my second price goal with a gain of $15.28/share or 60.8%. Thus, I now have a signal to purchase a new position! I shall start looking later today :).
Bob
Wednesday, 10 November 2004
November 10, 2004 ASV, Inc. (ASVI)
Hello Friends! I really mean to warmly welcome you to my blog. With all of the tumult of the election fading into the distance, it is nice to get back to just arguing about which stock is a good idea or not! As always, however, please remember that I am an amateur investor, so PLEASE do your own investigation on all investment ideas mentioned on this website. In addition, PLEASE consult with your professional investment advisors prior to making any decision to make sure such investments are appropriate, timely, and likely to be profitable for you. If you have any comments, questions, or what I like the most, words of encouragement, please email me at bobsadviceforstocks@lycos.com .

I came across ASV, Inc. (ASVI) today on the
list of top % gainers on the NASDAQ today. ASVI closed today at $44.07, up $4.49 or 11.34% on the day. Unlike most of the stocks I discuss on this blog, I DO own some shares of ASVI in a managed account in which I do NOT make any investment decisions. According to the
Yahoo "Profile" on ASV, ASVI "...designs, manufactures and sells track-driven all-season vehicles."
On October 28, 2004, ASVI
reported 3rd quarter 2004 results. Net sales totaled $40.6 million for the quarter up from $29.2 million in the same quarter last year. Net earnings increased to a record $4.4 million or $.34/share compared with $3.1 million or $.29/share last year. (even though the number of diluted shares jumped 22% in the quarter!) The company, with the Loegering acquisition, announced anticipated results for 2004 showing a 59-64% increase in sales. Also diluted eps was expected to increase 54-62% over 2003. This was a great report, strong revenues and earnings with bullish guidance from management!

How about longer-term? Taking a look at the
"5-Yr Restated" financials on Morningstar.com, we can see a fairly steady increase in revenue from $36.2 million in 1999 to $44.2 million in 2002. However, from that point, revenue has exploded to $127.5 million in the Trailing Twelve Months (TTM).
Earnings were also relatively flat between 1999 and 2002 when they actually dropped from $.14/share to $.13/share. However, since then they have grown strongly to $.78/share in 2003 and $1.06 in the trailing twelve months.
Free cash flow which was a negative $(5) million in 2001, improved to break-even in 2002, and then to $18 million in 2003 and $13 million in the TTM.
Balance-sheet-wise, this stock looks nice. As reported on Morningstar, ASVI has $42.9 million in cash, plenty to cover BOTH the $12.8 million in current liabilities, and the $1.8 million in long-term liabilities three times over! In addition ASVI has $58.6 million in other current assets.

What about valuation? Looking at
"Key Statistics" on Yahoo, we can see that this is a small cap stock with a market cap of $556.6 million. The trailing p/e is a bit rich at 39.67, with a forward p/e (fye 31-Dec-05) of 27.89. With the rapid growth rate predicted, the PEG comes in at a bit more reasonable 1.28.
Yahoo reports only 12.63 million shares outstanding with only 3.20 million of them that float. As of 10/8/04, there were 371,000 shares out short representing 11.59% of the float but only 2.576 trading days of volume. (I use 3 days arbitrarily as my cut-off for significant short position).
Yahoo reports no cash dividend, and the last stock dividend reported was a 3:2 split in May, 1998.
How about "technicals"? For this, I like to turn to
Stockcharts.com, where I like to examine the Point and Figure charts:
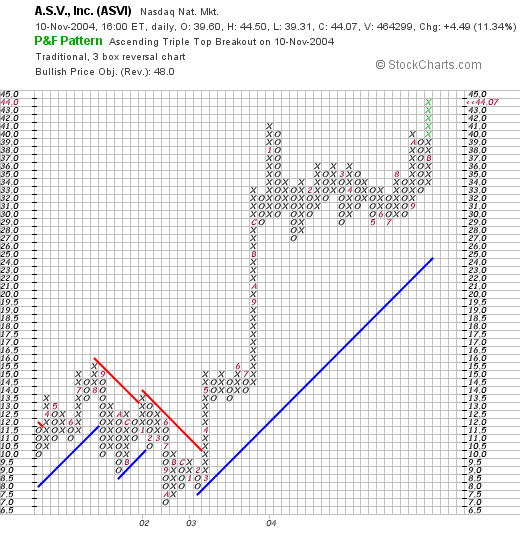
Here we can see a terrific chart, a stock that was trading lower through 2001, until March, 2003, when it broke through a resistance level at around $10.50, and has traded higher since. The stock looks quite strong imho.
So what do I think? Well I do OWN some shares already, but discounting that, the recent earnings/revenue report and the guidance is superb. The valuation is a bit cheap, this is no bargain. However, the balance sheet looks nice, and the chart looks just fine.
Thanks so much again for stopping by! I hope that my posts are helpful; if so, please email me and let me know how you use this information! I would love to share that as well with my readers! You can email me at bobsadviceforstocks@lycos.com .
Regards,
Bob
Sunday, 7 November 2004
"Looking Back One Year" A review of stock picks from the week of September 22, 2003
Hello Friends! We have had a tumultuous week here in the States and I think I am having an electoral "hangover"! In any case, we had quite a rally the last few days and fortunately our stocks participated! In fact, I was able to sell a portion of one of my stocks (AMHC) at a gain, which gave me a "buy signal" in my trading system, and added a position (CDIS) to my
"Trading Portfolio". Again, thanks for visiting my blog,
Stock Picks Bob's Advice, but I always like to remind all of you that I am an amateur investor, so please consult with your professional investment advisors before making any investment decisions based on information here, to make sure that your decisions are appropriate, timely, and likely to be profitable for you!
I like to use the weekend, when I can find the time (!) to write up a short review of stock picks from the previous year. I do this a week at a time on a sort of rolling basis, currently I am up to the week of September 22, 2003.

The first pick that week was TBC Corp (TBCC) which was
posted on Stock Picks on September 22, 2003, at a price of $24.13. TBCC, and I had to check this a couple of times (LOL), closed on 11/5/04 at $24.13, for a 0% change (!). I think THAT is a first on this blog, closing a year or so later at the exact price (!).
On 10/25/04, TBCC
reported 3rd quarter 2004 results. Net sales climbed 31.5% to $476.5 million over the prior year. Due to hurricane effects (?), same store sales decreased 1.7% during the quarter. Net income was up 9.0% to $10.9 million, or $.47/share, compared with $10.0 million or $.44/share the prior year. Overall, not a terrible report!

On September 22, 2003, I
posted Bio-Reference Labs (BRLI) on Stock Picks at $11.63. BRLI closed at $14.20 on 11/5/04 for a gain of $2.57 or 22.1% over the past year.
On September 9, 2004, BRLI
announced 3rd quarter 2004 results. Revenues came in at $35.8 million, a 24% increase over prior year revenues. Net income was $2.3 million or $.18/share, unchanged from the prior year. This was an o.k. result as I would much prefer to see strong earnings going along with the strong revenue growth!

On 9/24/03, I
picked Multimedia Games (MGAM) for this blog at a price of $34.30. MGAM split 2:1 on 3/1/04, and thus our effective selection price was $17.15. MGAM closed on 11/5/04 at a price of $13.87 for a loss of $(3.28) or (19.1)%.
On October 14, 2004, MGAM
announced warnings about the 4th quarter and 2004 results. They loweed guidance for the fourth-quarter and fiscal-year earnings due to "...lower-than-projected contributions from the sale of player terminals." This was NOT good news and the stock price responded accordingly.
 America's Car-Mart (CRMT) was selected
 for Stock Picks on 9/24/03 at a price of $29.61. CRMT closed at $34.81 on 11/5/04 for a gain of $5.20 or 17.6%.
On 9/9/04, this Bentonville, Arkansas-based company (same as Wal-Mart...a coincidence?),
announced 1st quarter results. For the quarter ended July 31, 2004, revenues increased 17% to $50.8 million over the $43.3 million the prior year. Income increased 13% to $4.9 million or $.62/share vs. $4.4 million or $.55/share the prior year same quarter. The company also raised 2005 guidance, a bullish development!

On September 25, 2003, I
Posted Cree, Inc. (CREE) on Stock Picks at a price of $22.16. CREE closed at $35.28 on 11/5/04 for a gain of $13.12 or 59.2%.
On October 14, 2004, CREE
reported 1st quarter 2005 results. Revenue for the three months ended 9/26/04, came in at $95.9 million a 45% increase over the prior year's $66.2 million. Net income came in at $24.4 million or $.32/share compared with $8.9 million or $.12/share the prior year. This was a GREAT result, and the stock price responded accordingly!
On 9/25/03, I
posted WD-40 (WDFC) on Stock Picks at a price of $31.20. WDFC closed at $28.64 on 11/5/04 for a loss of $(2.56) or (8.2)%.
On 10/27/04, WDFC
announced 4th quarter 2004 results. Revenue for the period ended August 31, 2004, dropped 2.3% to $71.7 milion from $73.4 million. Quarterly earnings fell to $8.9 million or $.53/share from $10.3 million or $.61/share the prior year. Even though analysts (First Call) were looking for a decrease to $.55/share, WDFC underperformed even THAT weaker estimate. This is not my kind of earnings report!

On September 26, 2003, I
posted Research in Motion (RIMM) on stock picks at a price of $38.24. On June 7, 2004, RIMM had a 2:1 split making my effective pick price $19.12. RIMM closed at $77.75 on 11/5/04, for a gain of $58.63 (!!!), or 306.6%. (Too bad I didn't buy any shares).
On September 30, 2004, RIMM
announced 2nd quarter 2005 results. Revenue came in at $310.2 million, up 147% from $125.7 million the prior year and up 15% sequentially from the prior quarter. Net income came in strong at $70.6 million or $.36/share, up sequentially and up from $2.1 million or $.01/share the prior year! This was a great quarter.

And on September 26, 2003, I
posted Abaxis (ABAX) on Stock Picks at a price of $13.40. ABAX closed at $12.40 on 11/5/04 for a loss of $(1.00) or (7.5)% since posting.
On October 18, 2004, ABAX
announced 2nd quarter 2005 results. Quarterly revenue came in at $13.6 million, up 18% over the prior year. Earnings per share came in at $.06, up 20% from $.05/share the prior year. These were good results (imho), and the stock has held its price fairly well.

On September 26, 2003, I
posted Cherokee (CHKE) on Stock Picks at a price of $20.90. CHKE closed at $29.00 on 11/5/04 for a gain of $8.10 or 38.8%.
On 9/8/04, CHKE
announced 2nd quarter earnings results. Revenue was up 3% to $10.2 million, from $9.9 million last year. Net income was up 16% to $4.3 million or $.50/share compared with $3.7 million or $.43/share the prior year. Nice results but not spectacular imho. What the street also liked was that Cherokee, on 10/21/04,
announced an increase in the dividend, a 19% increase to $.50/share. Who says dividends don't matter?
So how did we do for these nine stocks since they were "picked" during the week of September 22, 2003. Needless to say, the one SPECTACULAR pick of RIMM will pull up the averages! Including RIMM, the nine stocks had an average gain of 45.5% over the past year! Of course, this shows how one spectacular or miserably performing stock can sway the averages! Also, this assumes a "buy and hold" approach for investing, and I personally use an 8% stop loss approach, and sell portions of my stocks at gain targets. But this is probably informative to look back and see what would have happened if we HAD just bought and held on!
Thanks again for stopping by! Please always do your own investigatin of all stocks discussed as I am an amateur investor. If you have any questions, comments, or words of encouragement, please feel free to email me at bobsadviceforstocks@lycos.com! Have a great weekend!
Bob
Posted by bobsadviceforstocks at 11:16 AM CST
|
Post Comment |
Permalink
Updated: Sunday, 7 November 2004 11:18 AM CST
Friday, 5 November 2004
November 5, 2004 ValueClick (VCLK)
Hello Friends! TGIF. We have had a wonderful week in the market with a very bullish performance for most of the indices. Today,
strong October jobs numbers were reported and this appeared to strengthen the market further. Please remember, as you read my blog,
Stock Picks Bob's Advice, that I am an amateur investor. Please consult with your professional investment advisors prior to making any decisions to make sure that such decisions are appropriate, timely, and likely to be profitable for you! If you have any questions, comments, or words of encouragement, please feel free to email me at bobsadviceforstocks@lycos.com .

Looking through the
list of top % gainers on the NASDAQ, I came across Valueclick Inc (VCLK) which closed at $10.91, up $1.34 or 14.00% on the day. I do not own any shares of this stock nor do I own any options in any accounts that I am responsible for. (I have a couple of managed accounts where shares may be purchased or sold that I may not be aware of!). According to the
CNNMoney "snapshot", VCLK's principal activities "...are to provide products and services that enable marketers to advertise and sell their products."

Yesterday, after the market close, VCLK
reported 3rd quarter 2004 results. For the quarter ended September 30, 2004, VCLK reported revenue of $43.5 million, ahead of guidance of $37-$39 million and 92% ahead of the $22.7 million reported in the third quarter of 2003. GAAP (generally accepted accounting practices) net income for the third quarter was $7.6 million or $.09/share, ahead of guidance of $.06/share, and up from the $3.6 million in the third quarter 2003. VCLK also did something I really LOVE in a report, they RAISED GUIDANCE. For the fiscal year 2004, VCLK raised guidance in revenue from $154 million to $162 million. This was a nice report imho.
How about longer-term? Taking a look at the
"5-Yr Restated" financials from Morningstar.com, we can see that revenue has grown steadily (except for a dip between 2000 and 2001) from $26 million in 1999, to $124.3 million in the trailing twelve months. (See above, 2004 revenue should be coming in at $154-$162 million).
Earnings, which were at $(.20)/share in 2001, have improved gradually, turning profitable in 2003 at $.13/share and improving to $.33/share in the trailing twelve months. Free cash flow has also been improving steadily from $(4) million in 2001, $(1) million in 2002, $12 million in 2003 and $22 million in the trailing twelve months (TTM).
Looking at the balance sheet as reported on Morningstar.com, we find that VCLK has $239.3 million in cash alone, easily covering both the $31.9 million in current liabilities and the $4.1 million in long-term liabilities over 6 times over! In addition, VCLK has another $23.7 million in other current assets.
What about valuation? Taking a look at the
Yahoo "Key Statistics", we see that this is a "small cap" stock with a market cap of $873.67 million. The trailing p/e is 28.49, forward p/e is 29.49 (fye 31-Dec-05), and the PEG is at 1.77. Yahoo reports 80.08 million shares outstanding with 73.40 million of them that float. Of these there are 2.77 million shares out short representing 3.77% of the float or 2.68 trading days of volume.
Taking a look at a Point & Figure chart from
Stockcharts.com:
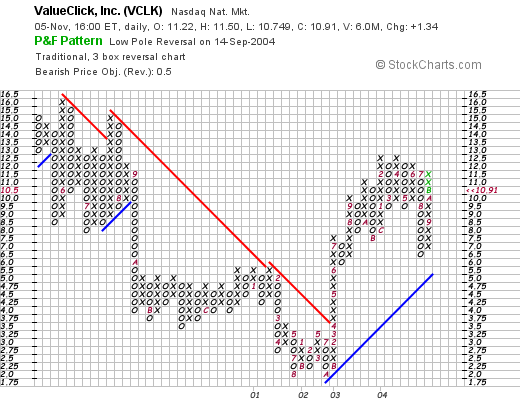
we can see that this stock has traded lower since May, 2000, from $16.00/share to a low of about $2.25/share in August, 2001. Since then, the stock broke through a resistance line in April, 2003, at $4.00/share and has traded steadily higher. The graph looks nice to me!
So what do I think? Summarizing some of the things I noted, the stock made a nice move today on a gorgeous earnings report (imho). The company has a record of growing its revenue and improving its earnings for the past five years. They are cash-flow positive and have a beautiful balance sheet with loads of free cash. Valuation is reasonable, imho, although the PEG is a bit high, I suspect this will drop as the current numbers get integrated into the Morningstar site. The graph is nice as well! In fact, this is a pretty picture!
Now, if I just had SOLD some of my stock at a profit so I could add a position! Thanks again for stopping by! Please remember that if you have any questions or comments, please feel free to email me at bobsadviceforstocks@lycos.com .
Bob
Posted by bobsadviceforstocks at 5:40 PM CST
|
Post Comment |
Permalink
Updated: Friday, 5 November 2004 5:51 PM CST
Newer | Latest | Older


