Stock Picks Bob's Advice
Friday, 17 June 2005
June 16, 2005 Alliance Data Systems (ADS)
Hello Friends! Thanks so much for stopping by and visiting my blog,
Stock Picks Bob's Advice. As always, please remember that I am an amateur investor, so please remember to consult with your professional investment advisors prior to making any investment decisions based on information on this website.

Earlier today, I purchased some Alliance Data Systems stock (ADS) for my trading account, and I wanted to briefly go over my thinking. It is very late here and I want to get right to the point....so bear with me.
ADS made the list of top % gainers on the NYSE today, closing at $39.00, up $2.16 or 5.86% on the day. I purchased some shares this afternoon, after selling shares of HIBB that had hit a 300% gain mark (!).
Yahoo "Profile": The company "...provides transaction services, credit services, and marketing services in North America."
1st quarter 2005 earnings: Revenues rose 20% to $375.9 million from $312 million. Earnings jumped to $37.2 million or $.43/share from $32.3 million or $.39/share last year.
"5-Yr Restated" financials from Morningstar.com: Revenue has grown steadily from $0.7 billion in 2000 to $1.3 billion in the trailing twelve months (TTM).
Earnings have climbed from $.31/share in 2002 to $1.26/share in the TTM.
Free cash flow looks nice with $80 million reported in 2002, expanding to $345 million in the TTM.
Balance sheet is o.k. with $156.7 million in cash and $461.9 million in other current assets, enough to cover the $485.1 million in current liabilities, but not enough to cover all of the $778.2 million in long-term liabilities as well.
Yahoo "Key Statistics": Large cap stock with a market cap of $3.25 Billion. Trailing p/e moderate at 30.81, but the forward p/e is much nicer (fye 31-Dec-06) at 17.89; thus, the PEG comes in at 1.14.
The Price/Sales ratio is 2.32. This doesn't look bad in the context of the "Information/Delivery Svcs" industry. Jupitermedia (JUPM) is at 7.6, FactSet (FDS) at 5.5, ADS at 2.5, Proquest at 2.0 and DST (DST) at 1.6.
Other statistics: 83.37 million shares outstanding with 68.87 million of them that float. Of these, as of 5/10/05, there were 2.35 million shares out short, representing 2.90% of the float or 2.5 trading days of volume. No cash dividend and no stock dividends are reported.
The
"Point & Figure" chart from Stockcharts.com:
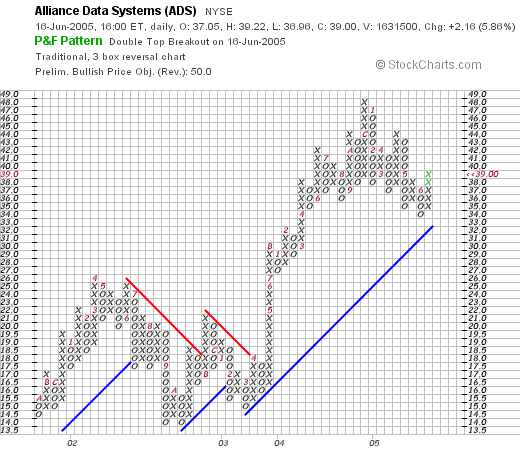
After moving sideways from 2002 through 2003, this price chart broke through resistance in April, 2003, at $18, and has moved strongly higher since. The chart looks nice to me.
So what do I think? Well, I liked it enough to buy some shares! The latest quarter was strong, the last five years look nice, with growing free cash flow. The balance sheet is adequate, and valuation looks reasonable. Finally, the stock chart looks nice as well.
Thanks again for visiting. If you have any questions or comments, please feel free to leave them right on the blog or email me at bobsadviceforstocks@lycos.com.
Bob
Thursday, 16 June 2005
June 16, 2005 Progress Software (PRGS)
Hello Friends! Thanks so much for stopping by and visiting my blog,
Stock Picks Bob's Advice. As I always point out, and I mean it, I am truly an amateur investor, so PLEASE consult with your professional investment advisors prior to acting on any information on this website!

Earlier today, my Coach Stock (COH) which has been a fabulous investment, hit one of my sale points. If you are new to what I write, I believe in selling losers quickly at an 8% loss, and selling winners slowly at different sale points on gains. In other words, I sell 1/4 of my remaining position at gains of 30, 60, 90, 120, 180, 240, and 300% gain levels! After that, I shall sell at 360%, then by 90% increments x 4 etc.
Anyhow, I actually hit TWO 300% gain points today. First, my Coach stock hit 300%, and I sold 1/4 of my position. Then my Hibbett also hit 300% (!) and I sold 1/4 of my remaining shares. Unfortunately, since I purchased these stocks a couple of years ago, my initial purchase was not as big as my current buys. Nevertheless, this gave me "permission" to add two new positions, actually filling my "quota" of 25 positions in my trading account.
Hopefully, the market continues relatively strong, and I can start applying my partial sales to paying off my neverending margin :).
Back to the sale. So sellling a portion of Coach entitled me to add position # 24. Looking through the
list of top % gainers on the NASDAQ today, I came across Progress Software (PRGS) which closed at $30.33, up $2.13 or 7.55% on the day. Actually, as the market turned around and moved higher late in the afternoon, PRGS was no longer on the top 50 gainers, but my purchase of 240 shares at $30.96, was already made :).
According to the
Yahoo "Profile" on PRGS, the company "...engages in the development, marketing and distribution of software and services for the development, deployment, integration, and management of business applications deployed in a distributed, Web-based or client/server environment."
What drove the stock higher today was the
2nd quarter 2005 earnings announcement this morning. PRGS reported that revenue climbed 10% to $100.2 million from $90.8 million last year, and net income rose 54% to $14.4 million or $.35/share from $9.4 million or $.24/share for the same quarter last year.
Looking at the
"5-Yr Restated" financials from Morningstar.com, we can see that while revenue dropped from $273.1 million in 2000 to $263.6 million in 2001, it has climbed steadily since with $374.0 million in the trailing twelve months (TTM).
Earnings also dropped from $.85 in 2000 to $.46/share in 2001, but since 2001 have climbed steadily to $.93/share in the TTM.
Free cash flow the last few years has grown steadily from $38 million in 2002 to $62 million in the TTM.
The balance sheet also looks solid with $204.7 million in cash, more than enough to cover both the $178.2 million in current liabilities and the $8.8 million in long-term liabilities. In addition, Morningstar reports that Progress has an additional $95.4 million in other current assets.
Looking at
"Key Statistics" from Yahoo on Progress, we can see that the market cap is at $1.13 billion making this a mid-cap stock. The trailing p/e is a bit rich at 32.33, but the forward p/e (fye 30-Nov-06) is a bit better at 21.36, and estimates suggest a PEG of 1.51, making this not exactly a bargain, but not that expensive either.

This is a Poster by Marc Chagall, another of my favorite artists!
Yahoo shows the Price/Sales ratio at 2.81. Using this measurement of valuation, with data from the Fidelity website, we find that Progress is in the "Application Software" industry and its Price/Sales ratio is actually quite reasonable relative to other members of the same industry group. Microsoft (MSFT) tops the list with a Price/Sales of 7.0, Oracle (ORCL) next at 5.9, Veritas (VRTS) at 4.9, Cognos (COGN) at 3.8, and Siebel (SEBL) at 3.5. Progress is the cheapest with its 2.8 Price/Sales ratio.
Going back to Yahoo, we can see that there are 37.23 million shares outstanding with 35.97 million of them that float. Of these, there were 1.07 million shares out short as of 5/10/05. This amounts to 3.00% of the float, or 4.3 trading days, making this somewhat significant using my arbitrary 3 day cut off on short interest ratios.
Yahoo shows no cash dividend paid and the last stock split was a 2:1 split in January, 2000.
How about a graph? If we look at a "Point & Figure" chart on Progress from Stockcharts.com:
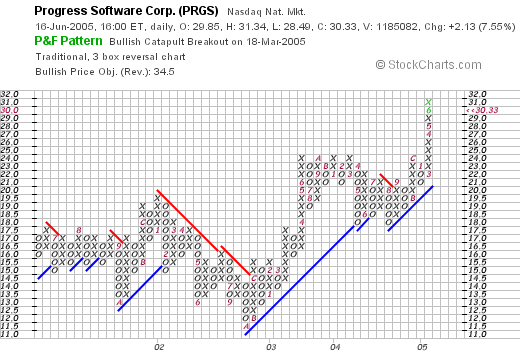
we can see that the stock was actually trading lower between late 2001 and into late 2002, when in October, 2002, it broke through resistance at $14, and has traded higher since. Recently, PRGS has shown significant strength moving rapidly higher. The stock looks bullish, and not really over-extended to me!
So what do I think? Well, I liked it enough that I bought some shares earlier today. Reviewing: the stock moved strongly higher today on a very solid earnings report. The last four, if not five, years have been steadily growing earnings and revenue for PRGS. The free cash flow is positive and growing and the balance sheet is quite pretty. Valuation wise, the PEG is 1.5, but the Price/Sales at 2.8 is the lowest in its group. Finally, the chart looks great.
Thanks again for stopping by! Your visits are appreciated by me and for those who stop to comment or email me a note, thanks again ahead of time! It makes it all worthwhile. If you have any questions or comments, please feel free to leave them here on the blog or email me at bobsadviceforstocks@lycos.com.
Bob
Posted by bobsadviceforstocks at 7:57 PM CDT
|
Post Comment |
Permalink
Updated: Thursday, 16 June 2005 11:42 PM CDT
"Trading Transparency" Alliance Data Systems (ADS)
Hello Friends! Well I hit 25 positions earlier today. Now I shall try to sit on my hands :). After selling my partial position in HIBB as I wrote up earlier, this was a signal to add a new position (being at 24, with a goal of 25).
Scanning through the lists of top % gainers, and reviewing Morningstar.com, I came across Alliance Data Systems (ADS) that I do not believe I have reviewed here on Stock Picks....will try to get that in later or tomorrow as well.
Anyhow, I bought 200 shares of ADS at $39.06, shortly before the close of trading. Wish me good luck! Anyway, with future sales, I shall be applying the proceeds to the margin balance, unless I drop down to 24 with a sale on bad news, in which case I will wait for a sale on "good" news, prior to going back to 25. I hope you follow.
Will I ever get over 25? Well, never say never :). If I pay off my margin, I will be thinking about indications for adding a new position. Maybe THAT will be the trigger?
Anyhow,
Thanks so much for stopping by. I hope that my chatter is helpful to you. Remember that I truly am just an amateur investor who loves to write about stocks, so please consult with your investment advisors who are professionals!
Bob
"Trading Transparency" HIBB
Hello Friends! Just a quick note to update you. Another of my stocks hit a sell point, Hibbett Sporting Goods (HIBB), which I first purchased 3/6/03 at a cost basis of $9.74, hit the 300% gain point as well, and I sold 1/4 of my 98 shares (24 shares) at $39.18 a few moments ago.
That represents a gain of $29.44/share or 302.3%. WOW! Anyhow, I am now "entitled" to purchase position #25. Probably not enough time to go fishing this afternoon for a position, but I can feel that last nickel burning a hole in my pocket!
Bob
"Trading Transparency" Progress Software (PRGS)
Hello Friends! Thanks so much for stopping by and visiting my blog,
Stock Picks Bob's Advice. As always, please remember that I am an amateur investor so please consult with your professional investment advisors prior to making any investment decisions based on information on this website.
Just to keep you posted. That "nickel" was burning a hole in my pocket as soon as it got there. Since I just sold a portion of my COH stock at a gain (see the prior post), this entitled me to add a new position to my portfolio. (since I am under my 25 position goal).
Looking through the lists of top % gainers today, I came across Progress Software (PRGS). It appears to fulfill my "criteria" to purchase, and I just picked up 240 shares at $30.96. As I write this post, PRGS is trading at $31, up $2.80 on the day or 9.93%. I will try to write up this stock later on if I get a chance :).
Regards!
Bob
"Trading Transparency" COH
Hello Friends! Thanks so much for stopping by and visiting my blog,
Stock Picks Bob's Advice. As always, please remember that I am an amateur investor, so please consult with your professional investment advisors prior to making any investment decisions based on information on this website.
A few moments ago, my investment in Coach (COH) in my Trading Account hit a sale point, and I sold 1/4 of my position of 136 shares (34 shares), at $33.25/share. Coach has been the strongest stock in my portfolio, which I purchased at a cost basis of $8.33/share on 2/25/03. Thus, this represented a gain of $24.92/share or 299.2%. This was my seventh (!) partial sale of Coach, having sold portions at 30%, 60%, 90%, 120%, 180%, 240%, and now at 300% gains (!). My next sale target will be either at a 360% gain on the upside, or failing any particular bad news which might trigger a sale, I shall allow the stock to drift back to a 150% gain level prior to selling on the downside. This would represent a 50% retracement of my highest sale target.
In any case, that frees me up to purchase a new position, which would be position #24 in my trading account with my goal of 25 positions. After reaching 25 positions, I shall be using any proceeds to at long last pay down that margin!
Thanks so much for stopping by. If you have any questions or comments, please feel free to email me at bobsadviceforstocks@lycos.com or just plain leave a message here on the blog.
Bob
Wednesday, 15 June 2005
June 15, 2005 Landauer (LDR)
Hello Friends! Thanks so much for stopping by and visiting my blog,
Stock Picks Bob's Advice. As always, please remember that I am an amateur investor so PLEASE consult with your professional investment advisors prior to making any investment decisions based on information on this website.

Looking through the
list of top % gainers on the NYSE this evening, I came across Landauer (LDR) which closed at $52.90, up $2.45 or 4.86% on the day. I do not own any shares nor do I have any options on this stock.
According to the
Yahoo "Profile" on LDR, the company "...provides analytical services to determine personnel exposure to occupational and environmental radiation hazard in the workplace and home in the United States."
How about the latest quarterly report? On April 25, 2005, Landauer
reported 2nd quarter 2005 results. For the quarter ended March 31, 2005, revenues came in at $19.7 million, up 8% from $18.2 million the prior year. Net income came in at $5.1 million or $.57/diluted share, up from $4.8 million or $.54/diluted share the prior year same quarter.
How about longer-term? Taking a look at the
"5-Yr Restated" financials on Morningstar.com, we can see that revenue has been growing steadily from $47.2 million in 2000 to $71.4 million in the trailing twelve months (TTM).
LDR has a pretty picture of steady earnings growth, except for a dip from $1.83 in 2002 to $1.69 in 2003. However, earnings once again rebounded and have grown to $2.02 in the TTM.
In addition, LDR has been paying dividends, which while also dipping between 2001 and 2002, have grown from there from $1.40/share to $2.03 in the TTM.
Free cash flow has been positive and growing, from $13 million in 2002 to $20 million in the TTM.
The balance sheet looks adequate if not fabulous, with $10.3 million in cash and $23.5 million in other current assets, balanced against $31.4 million in current liabilities and $5.7 million in long-term liabilities.
What about some
"Key Statistics" on LDR from Yahoo? There we can see that this is a small mid-cap stock with a market capitalization of only $473.98 million.
The trailing p/e isn't bad at 25.75, and the forward p/e (fye 30-Sep-06) is a bit better at 22.90. However the PEG ratio is 2.60, and the Price/Sales is 6.16.
Other key statistics from Yahoo show Landauer with only 8.96 million shares outstanding with 8.28 million of them that float.
Currently, as of 5/10/05, there are 261.38 thousand shares out short representing 3.00% of the float, or 11.3 trading days of volume. With my 3-day cut off, this appears, at least at first glance to be quite significant.
The company pays a large dividend of $2.08/share yielding 4.15%. No stock splits are reported on Yahoo.
And what does the chart look like? Taking a look at a
"Point & Figure" chart on LDR from Stockcharts.com:
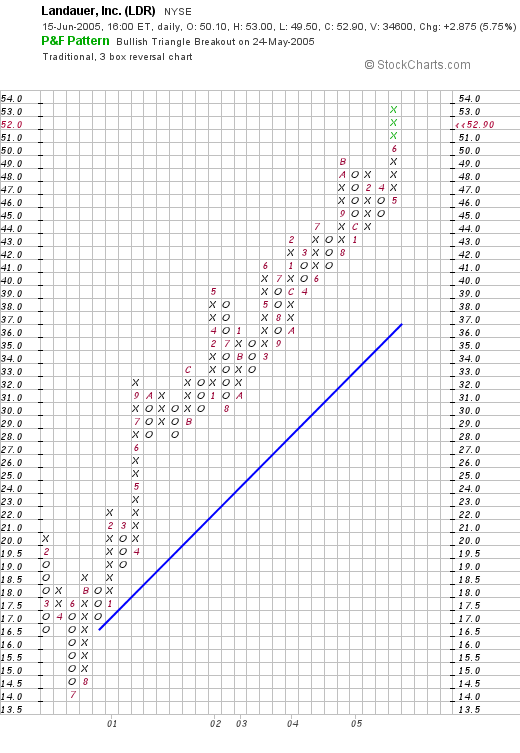
All I can say is "WOW!". Look at that chart! This chart, which bottomed in July, 2000, at around $14, has been heading almost directly higher, with the current move to $52.90 continuing its trend. The chart looks very strong to me!
So what do I think? Well, if my COH holds up I shall be in the market for a new holding, and if this stock was moving higher on the day I sell my next partial position, I certainly would look twice at this one!
Let's review: stock made a nice move higher today, last quarter was solid, past five years was almost perfectly steady with revenue and earnings growth, free cash flow is positive and growing and the balance sheet looks reasonable if not fantastic. The stock, valuation-wise is no bargain, and the PEG is over 2.0. But the chart looks phenomenal. All-in-all not such a shabby report at all!
Thanks again for stopping by! I can only talk about this stock at the moment, as I am not in the market until I sell a portion of one of my holdings at a gain. COH is flirting with a 300% gain for me (which is my next sale point)....so I may be buying something soon (?). Anyhow,
Thanks for visiting. Please feel free to leave comments right here on the blog or email me at bobsadviceforstocks@lycos.com.
Bob
Tuesday, 14 June 2005
June 14, 2005 Diodes (DIOD)
Hello Friends! Thanks so much for stopping by and visiting my blog,
Stock Picks Bob's Advice. As always, please remember that I am not a professional investment advisor. I am not a certified financial specialist. I am truly an amateur investor who loves to invest and share ideas with fellow investors who share this same passion. However, please do consult with your professional investment advisors prior to making any investment decisions based on information on this website!
What this website is about is a process. A way of looking at the overwhelming number of stock market investment possibilities and trying to make heads or tails of the chaos. Just maybe, I shall be able to do a little better than random by having a strategy of identifying companies that may have a better than average chance of appreciating in price. Together, we shall see if this approach is successful.
Furthermore, my strategy is NOT about picking the perfect stock. Even thought that might be what YOU are looking for :). I strongly believe in building a portfolio of stocks that as a group can outperform the market. My loyalty to any particular stock in my portfolio goes only as far as the stock continues to perform.

Looking through the
list of top % gainers on the NASDAQ today, I came across Diodes (DIOD) which closed at $33.30, up $3.37 or 11.26% on the day. I do NOT own any shares, nor do I have any options in this company.
According to the
Yahoo "Profile" on DIOD, the company "...engages in the manufacture, sale and distribution of discrete semiconductors, primarily to manufacturers in the communications, computing, industrial, consumer electronics, and automotive markets, as well as to distributors of electronic components to end customers in these markets."
Apparently, what drove the stock higher today was an
upgrade by Raymond James, the brokerage house, which raised the stock to "strong buy".
In my review of a stock, besides watching for a large % move that day, I check the latest quarter results. I am looking for good news :), obvious stuff like increasing revenue and earnings. On April 28, 2005, DIOD
reported 1st quarter 2005 results. Revenues for the quarter ended March 31, 2005, increased 17.3% to $48.6 million from $41.4 million last year in the same quarter. Sequentially, the company also raised revenue by 1.5%. Net income for the company increased 49.1% to $7.2 million or $.46/share, up from last year's $4.9 million or $.32/share. These were very strong results!
One of my observations in looking at stocks, is that stock prices often appreciate when a company can demonstrate persistence of "good" results. This is another way of saying earnings "momentum". That is, a company that has grown for many years may well continue to grow. Of course, nothing is guaranteed. But in general, my goal is to identify these kind of companies.
I have found Morningstar.com to be very helpful in this regard. On the Morningstar site, I have used the
"5-Yr Restated" financials, in this case for Diodes.
Here, I check the revenue growth, as illustrated by the series of purple bars superimposed on the yellow background near the top of the page. For DIOD, this isn't perfect, but it is quite good. Except for the drop in revenue between 2000 and 2001, when revenue declined from $116.1 million in 2000 to $93.2 million in 2001, this company has been a steady grower, reaching $192.9 million in the trailing twelve months (TTM).
Next step is earnings. Again, the company had a weak year in 2001, when earnings dropped from $1.62 to $.01, but since that year, the company has been steadily improving earnings numbers with $1.79 reported in the TTM.
Further down the page, I like to look at free cash flow. This is calculated by Morningstar by subtracting Capital Spending from Operating Cash Flow. For DIOD, this has been a bit erratic but has stayed positive the last few years in the face of growing capital spending. $12 million in free cash flow is reported in the TTM.
Finally, the last piece of information I use on Morningstar is a glance at the balance sheet. Again, I am an amateur. It is my understanding that current is distinguished from "long-term" by either being available to spend (asset) or coming due (liability) in the next 12 months. Beyond 12 months, assets and liabilities become "long-term".
In any case, obviously, if you had to own a company, you would want lots of assets and not very much in the way of liabilities. For a manager of a company, this gives a degree of flexibility to manage growth and invest for the future. In any case, for DIOD, we can see that the company has $27.9 million in cash and $72.2 million in other current assets. This is WAY greater than the $41.9 million in current liabilities and the 'smallish' $9.8 million in long-term debt. IMHO, this looks like a solid balance sheet to me.
My next step is to look up some key statistics on the company using Yahoo once again. For DIOD, let's take a look at some
"Key Statistics" on Yahoo. Here we can see that this is a small "mid-cap" stock with a market cap of $477.36 million.
The trailing p/e is reasonable (in the teens is reasonable to me), at 18.56, with a forward p/e (fye 31-Dec-06) of an even nicer 15.71. The PEG (5 yr expected) is just over 1.0 at 1.05.
The Price/Sales is 2.22. As I have stated previously, I greatly respect Paul Sturm who writes for Smart Money and has
written on Price/Sales ratios. His point, which I would agree with, is that to assess the meaning of a Price/Sales ratio, one must evaluate a company by its peers, that is other companies in the same industry!
I have found my Fidelity account to be a great source for research on Price/Sales ratios. I am sure there are lots of other places you can find this data. It turns out that DIOD is a member of the "Semiconductor-Integrated Circuit" industrial group. In this particular parameter of valuation, DIOD doesn't look too expensive. This group includes Marvell Technology (MRVL) at 9.2, Semtech (SMTC) at 5.2, Broadcom (BRCM) at 4.9, and then lower than Diodes, we have RF Micro (RFMD) at 1.4 and Skyworks (SWKS) at 1.3. Thus, DIOD, at 2.5 Price/Sales is on the reasonable side of valuation!
Other data from the "key statistics" site on Yahoo reveals that there are 14.34 million shares outstanding with only 9.62 million of them that float. Currently there are (as of 5/10/05) 1.31 million shares out short representing 8.30% of the float. This works out to a ratio of 8.2 (meaning 8.2 days of average trading volume to cover the short sales). This is significant, using my own arbitrary 3 days of volume cut-off. Thus, the short sellers may be adding to the buying "panic" if the stock continues to move higher.
No cash dividends are reported on Yahoo, and the last stock split noted was a 3:2 split on 11/26/03.
What about a graph? Taking a look at a
DIOD "Point & Figure" chart from Stockcharts.com:
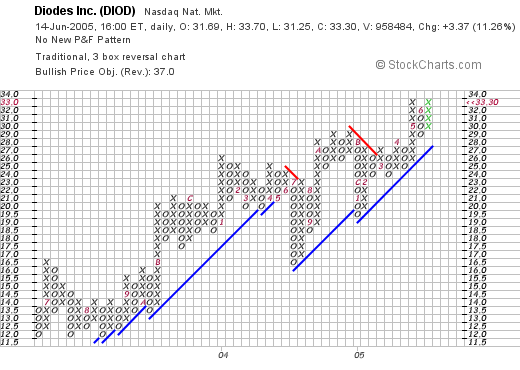
we can see what looks like a very strong long-term chart on DIOD. The stock, which was trading at around $12.00 in August, 2003, has moved higher, except for weakness in July, 2004, when it broke down to $16, the stock has been moving higher in a very regular fashion.
I am no expert at reading any kind of charts :). I look at them and determine whether the graph looks like the stock is moving higher, moving sideways, or moving lower. That's about the extent of my expertise. But I think that basic take is worth a look!
Anyhow, what do I think about this stock? Well, I think the stock looks terrific. Let me review: stock moved higher on an upgrade, recently reported great numbers in the latest quarterly report, has been growing fairly steadily in both earnings and revenue for the last 4-5 years, the cash flow is positive, the balance sheet looks strong, valuation is reasonable both with a PEG just over 1.0, and a Price/Sales ratio in the low-end of its group. In addition the chart looks great and there are a lot of short sales out there looking to be 'covered'.
Now, if I just had a reason to be buying something :). Anyway, I shall be sitting on my hands until one of my stocks hit a sale target. Ventana is actually flirting with a 90% gain...so hopefully that one is next. Meanwhile, thanks again for stopping by. I love your emails and comments. I hope that I am not being too verbose, but that my comments and observations are helpful to you!
Please feel free to leave comments or questions on the blog or email me at bobsadviceforstocks@lycos.com.
Bob
Posted by bobsadviceforstocks at 4:39 PM CDT
|
Post Comment |
Permalink
Updated: Tuesday, 14 June 2005 5:08 PM CDT
Monday, 13 June 2005
"Revisiting a Stock Pick" SRA International (SRX)
Hello Friends! Thanks so much for stopping by and visiting my blog,
Stock Picks Bob's Advice. As always please remember that I am an amateur investor, so please consult with your professional investment advisors prior to making any investment decisions based on information on this website.

I was browsing through the
list of top % gainers on the NYSE today and was really trying hard to get a new name. I like the excitement of new ideas around here, but the best stock I could find on the NYSE, the NASDAQ, and the AMEX top % gainers today was SRA International (SRX). This
is a stock that I own now in my trading portfolio. I did not own any shares when I
posted SRX on Stock Picks on June 1, 2004, at a price of $41.80. SRX recently split 2:1 making our effective stock pick price actually $20.90. SRX closed today at $34.74, up $1.74 or 5.27% on the day. Thus, we have a gain of $13.84 or 66.2% since my first listing of SRX on Stock Picks in June, 2004.
I actually purchased 160 shares of SRX, which split to 320 shares that now have a cost basis of $29.82/share. These shares were acquired on 2/1/05.
On May 2, 2004, SRX
announced 3rd quarter 2005 results. Revenue climbed 41% to $226 million from $160 million last year. Net income increased 44% to $14.7 million or $.52/share, up from $10.2 million or $.37/share a year ago. The company also raised guidance for the fourth quarter and the full year 2005 results.
If we recheck the
"5-Yr Restated" financials on Morningstar.com for SRX, we can see that the pattern of revenue growth from $312.5 million in 2001 to $821.6 million in the trailing twelve months (TTM) is undisturbed.
Earnings have increased from $.63/share in 2003 to $.96 in the TTM.
Free cash flow has also grown impressively from $4 million in 2002 to $52 million in the trailing twelve months.
The balance sheet is solid with $217.5 million in cash alone, enough to cover both the current assets of $151.6 million and the 'smallish' $7.2 million in long-term liabilities reported on Morningstar.com. In addition, Morningstar reports that the company has an additional $228.5 million in other current assets.
How about other "key statistics"? Looking at
Yahoo "Key Statistics" on SRX, we can see that this is now a large cap stock (if we use a $1.5 billion cut-off), with a market cap of $1.87 billion. The trailing p/e is a bit rich at 36.23 with a forward p/e (fye 30-Jun-06) shown at 35.81. I do not think these numbers take into consideration some of the increased guidance from the company (?).
The PEG isn't too bad at 1.51, and the Price/Sales is at 2.16.
Other statistics show SRX with 53.77 million shares outstanding, with 35.53 million of them that float. Currently, as of 5/10/05, there were 2.37 million shares out short, representing 4.50% of the float or 4.7 trading days of volume. Thus, with a 3-day "cut-off" that I like to use, there are still some significant short-shares out there that could come in and contribute to buying pressure in this security.
Yahoo does not show any cash dividend, and the company recently split 2:1.
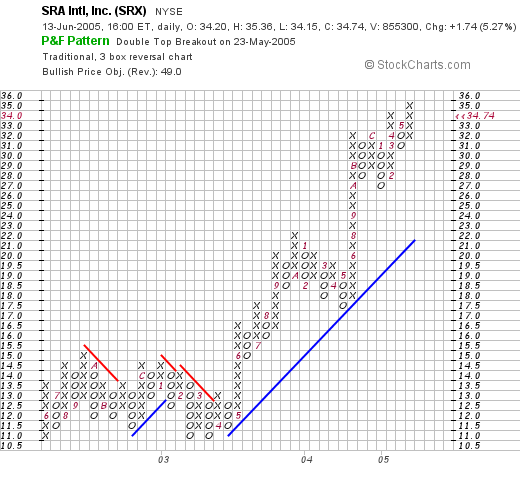
Let's take a quick look at the chart. Looking at a
SRX "Point & Figure" chart from Stockcharts.com, we can see that this stock has been moving strongly higher since April, 2003, when it broke through resistance at $12.50 and has moved to its current $35 level in a very strong fashion.
So what do I think? Well, first of all I do own the stock. The numbers on this company are fabulous, the latest quarter was very strong and the company raised guidance for the next quarter and the year. The only drawback I can think is that the company is dependent on government contracts, which can always be a bit fickle. But the numbers look nice, and I chose to purchase some shares.
Thanks again for stopping by and visiting! If you have any questions or comments, please feel free to leave them on the blog or email me at bobsadviceforstocks@lycos.com.
Bob
Sunday, 12 June 2005
"Looking Back One Year" A review of stock picks from the week of April 19, 2004

Hello Friends! Thanks so much for stopping by and visiting my blog,
Stock Picks Bob's Advice. As always, please remember that I am an amateur investor so please consult with your professional investment advisors prior to making any investment decisions based on information on this website.
I just finished responding to William Z. about performance of all of the stock picks that I write about. I guess this is where the "amateur" status really shows up. I do not have a master spreadsheet or other methods at this time of monitoring all of my stock picks. However, you can review all of them by clicking on the dates along the left side of the blog itself.
What I do like to do is to systematically review stock picks looking back about a year, a week at a time. Last weekend I was reviewing the week of April 12, 2004, and this week I shall be looking at the week of April 19, 2004.
My actual performance using these picks is different than this review would infer. First of all, I only own a small fraction of all of the stocks I review. I have tried to keep you posted regarding my trading portfolio which currently consists of 23 positions and which stocks I own and when I buy and sell them. Just review the past picks and you will come across all of those posts. (In addition, if I can get around to it, I have a trading portfolio up on the blog that you can reach through the link along the left side of the blog.)
This review assumes a buy and hold strategy. For my own portfolio, I sell stocks quickly if they reach or exceed an 8% loss; I also sell stocks "slowly", that is 1/4 positions, when they have gains of 30%, 60%, 90% 120%, then 180%, 240%, 300%, 360%, then by 90% intervals, etc.

On April 19, 2004, I
posted Misonix on Stock Picks at a price of $11.35. MSON closed at $5.90 on 6/10/05, for a loss of ($5.45) or (48%).

On May 5, 2005, MSON
reported 3rd quarter 2005 results. Revenue for the quarter ended March 31, 2005, came in at $10.9 million, a 5% increase from the $10.3 million reported in the same quarter the prior year. However, net income came in at $3,000 or $.0/diluted share compared with net income of $388,000 or $.06/diluted share for the same quarter in 2004.

On April 19, 2004, I
posted Carbo Ceramics (CRR) on Stock Picks at a price of $68.75. CRR closed at $74.40 on 6/10/05 for a gain of $5.65 or 8.2%.

On April 28, 2005, CRR
announced 1st quarter 2005 results. For the quarter ended March 31, 2005, revenues grew 22% to $61.2 million and net income increase 21% to $11.6 million or $.72/diluted share.

On April 21, 2004, I
posted FLIR Systems (FLIR) on Stock Picks at a price of $43.13. FLIR split 2:1 on 2/3/05, making our resultant stock pick price actually $21.57. FLIR closed at $27.04 on 6/10/05, for a gain of $5.47 or 25.4%.
On April 20, 2005, FLIR
announced 1st quarter 2005 results. Revenue dropped slightly to $108.3 million in the quarter from $108.9 million the prior year. Net earnings grew 16% to $14.7 million, from $12.7 million. On a per diluted share basis, this came in at $.19/share compared to $.17/share in the prior year.
I gave FLIR and any of my other stocks a "thumbs-down" when either the revenue or earnings decline in a given quarter.

On April 21, 2004, I
posted J&J Snack Foods (JJSF) on Stock Picks at $44.07. JJSF closed at $49.96 on 6/10/05, for a gain of $5.89 or 13.4%.
On April 20, 2005, JJSF
announced 2nd quarter 2005 results. Revenue for the quarter ended March 26, 2005, increased 4% to $99.4 million from $95.2 million in the prior year second quarter. Net earnings jumped 13% to $3.8 million from $3.3 million in 2004. On a diluted per share basis, earnings came in at $.41/diluted share up from $.36/diluted share in the 2nd quarter of 2004.

Finally, on April 22, 2004, I
posted Meridian Bioscience (VIVO) on Stock Picks at $11.22. This is the only stock of the group that I currently own in my trading account. VIVO closed at $20.12 on 6/10/05 for a gain of $8.90 or 79.3%.
On April 21, 2005,
VIVO announced 2nd quarter 2005 results. Net sales for the quarter ended March 31, 2005, came in at $23.7, up 13% from $20.9 million the prior year. Net earnings came in at $3.2 million, up 40% from $2.3 million the prior year. On a diluted per share basis this came in at $.20/share, up 33% from the prior year's $.15/diluted share.
So how did I do with my stock picks that particular week? Actually, quite good, with only one loss, albeit a significant one with MSON, and the other four showing gains for an average gain of 15.7% since posting!
Thanks so much for stopping by and visiting! If you have any comments or questions, please feel free to leave them right here on the blog otherwise, feel free to email me at bobsadviceforstocks@lycos.com.
Bob
Newer | Latest | Older


