Stock Picks Bob's Advice
Thursday, 1 July 2004
"Trading Transparency" LWAY
Hello Friends! This is a quick note to update you on activity in my trading account. A few moments ago I sold 50 shares of my 200 share position of Lifeway Foods (LWAY) at $16.32. I had JUST purchased LWAY on 6/25/04 at a price of $12.76, so this was a gain of $3.56 or 27.9%. Close to my 30% sell point, I sold my 1/4 position of LWAY into a market that is actually quite weak. And that allows me to look for a NEW position...yipppeee....you know how much I like BUYING stock :).
Thanks again for stopping by! Remember, I am an amateur investor, so please check with your professional investment advisors prio to making any decisions based on information on this website. For questions or comments, please feel free to email me at bobsadviceforstocks@lycos.com
Bob
July 1, 2004 Tempur-Pedic Intl (TPX)
Hello Friends! I guess the "street" didn't like that quarter point move...and the jobless numbers up 1,000 weren't that impressive for a booming economy that requires the Fed to tighten...now I am just an amateur as I repeat over and over....but does that old term "STAGFLATION" come to mind to anybody else besides me? Please remember that I am an amateur investor, so please do your own investigation of all investments discussed on this website and consult with your professional investment advisors.

Tempur-Pedic Intl (TPX) had a nice day in an otherwise ugly trading session closing at $14.45, up $.44 or 3.14% on the day. I do not have any shares of TPX nor any leveraged positions.
According to the
Yahoo "Profile", TPX "...is a vertically integrated manufacturer, marketer and distributor of premium visco-elastic foam mattresses and pillows that it sells globally in 54 countries, primarily under the Tempur and Tempur-Pedic brands."
On April 22, 2004, TPX
announced 1st quarter results. Revenue was $153.1 million, up 45.7 from the prior year, and fully diluted earnings per share came in at $.16, up 33% from the $.12/diluted share the prior year.

In addition, TPX increased guidance for the balance of 2004.
Looking longer term, we can examine the
"5-Yr Restated" financials from Morningstar.com. Here we see the steady growth in revenue from $73.6 million in 1999 to $479.1 million in the trailing twelve months (TTM). Earnings were break-even in the TTM, but clearly are positive and growing from the latest quarterly report.
Free cash flow which was negative at $(16) million in 2001, has improved to $14 million in 2003.
The balance sheet looks o.k., although the long-term debt is a bit steep, the cash is at $14.2 million with $131.2 million in other current assets, enough to cover the current liabilities of $90.5 million and make a small dent in the $407.2 million in long-term liabilities.

What about "valuation?" Taking a look at
"Key Statistics" from Yahoo, we see that this stock is a mid cap issue with a market cap of $1.41 billion. The trailing p/e is a bit rich at 35.50, but the anticipated growth leads to a forward p/e (fye 31-Dec-05) of 16.06. This rapid growth results in a calculated PEG of 0.80. Price/sales not quite as nice at 2.59.
Yahoo reports 97.41 million shares outstanding with 28.40 million of them that float. 70.85% of the shares are held by insiders...usually a bullish indicator. Only 872,000 shares are out short as of 6/7/04, representing a moderate short ratio of 3.218 trading days.
Yahoo reports no cash dividend and no stock split is noted on Yahoo either.
What about "technicals?" Taking a look at a point & figure chart from Stockcharts.com:
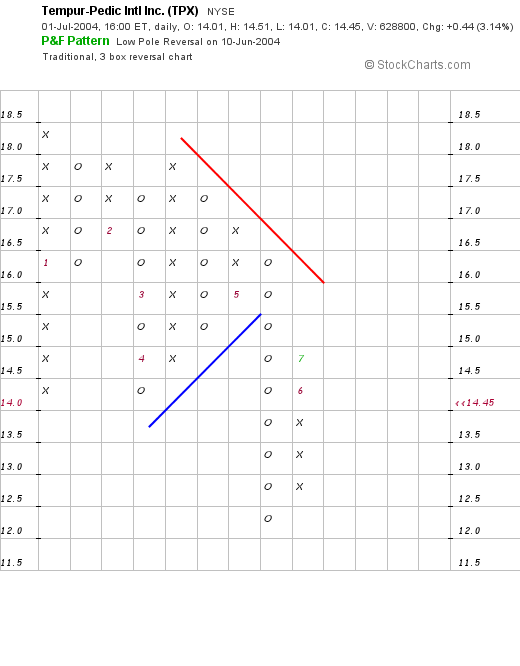
This chart is a bit less than convincing with TPX struggling with a resistance level and actually trading lower. I would like to see the stock break through the resistance level of about $16 to higher territory before calling this graph bullish.
What do I think? The latest earnings result is very nice....as is the record of the past 5 years. The free cash flow is also good to see, however, the company DOES have a good amount of long-term liabilities to deal with. Valuation is nice with a PEG under 1.0...and lots of insiders hold shares. However, the technicals are a bit weak.
In conclusion, I LOVE their material. (I have a Tempur-Pedic pillow I adore), but I do not at this time own any shares, nor am I convinced that this is the BEST opportunity for my limited resources. Thanks so much for stopping by! If you have any comments or questions, please feel free to email me at bobsadviceforstocks@lycos.com
Bob
Posted by bobsadviceforstocks at 11:37 AM CDT
|
Post Comment |
Permalink
Updated: Thursday, 1 July 2004 9:51 PM CDT
A Reader Writes "Check out MDCC!"
Hello Friends! Happy Thursday everyone. Thanks so much for stopping by. If you are new at this site, please make yourself at home, explore what is available here, and remember that I am an amateur investor, so please do your own investigation of all investment matters discussed on this website and please consult with your professional investment advisors prior to making any investment decisions to make sure they are appropriate and timely for your investment needs!
Leon was kind enough to write again. He writes:
Check out MDCC !
That might satisfy your requirements and they are now in the process to merrge with an aussie company with a nice product line coming to market which should help MDCC with more revenue growth.....
PE around 17x i think.....not much debt less than 20m when equity is more than 150m
revenue and eps growing last few years.
actually eps positive for few years now......
LeonI actually am a little familiar with this company and I DO think Leon is onto something here! Let me take a closer look at MDCC:

First of all, Molecular Devices (MDCC), closed at $17.78 yesterday. According to the
Yahoo "Profile", MDCC "...is a supplier of bioanalytical measurement systems that accelerate and improve drug discovery and other life sciences research." I personally do NOT own any shares of MDCC, although I do not know whether Leon does or doesn't.
On April 22, 2004, MDCC
reported 1st quarter 2004 results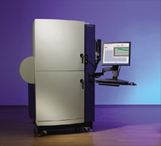
Revenues for the quarter came in at $27.3 million, an 11% increase compared to the prior year. Net income came in at $1.4 million, compared to $721,000 the prior year. On a diluted per share basis this came in at $.10/share vs $.05 per share, a 100% increase. This was a nice earnings report. In addition, MDCC projected continued growth for the upcoming quarters.
What about longer term? Taking a look at the
"5-Yr Restated" financials on Morningstar.com, we can see a relatively uninterrupted revenue growth from 1999 to the latest twelve months (except for a small dip between 2000 and 2001), with revenue growing from $71.9 million to $118.4 million in the TTM.
Earnings have also been a bit erratic, growing from $.26, but dipping to $(.32) in 2001, and then increasing steadily to the $.56 reported by Morningstar in the TTM.
Free cash flow also looks very nice with $10 million in 2001, $13 million in 2002, $16 million in 2003, and $18 million in the TTM. Not only is it positive but it is growing!
Balance Sheet? Couldn't be prettier! They have $50.4 million in cash, enough to pay off their TOTAL liabilities almost 3x over! They also have $46.2 million in other current assets with NO long-term liabilities and only $17 million in current liabilities. Very nice indeed....Leon you and I are thinking alike!
How about Valuation? Looking at
"Key Statistics" on Yahoo, we can see that this is a small company with a market cap of $253.4 million. The trailing p/e is a bit richer than the 17 you suggested Leon, and is actually at 31.64 with a forward p/e (fye 31-Dec-05) of 21.42. However, with the rapid growth anticipated, a PEG of 1.17 is reported which looks just fine to me.
Yahoo reports 14.25 million shares outstanding with 13.60 million of them that float. Of these 459,000 shares are out short as of 6/7/04, giving us a short ratio of 5.598 trading days. This is also bullish for the stock...WHO in their right mind would be going SHORT against these numbers? O.K. I just don't understand the short strategy.
No dividend is paid and Yahoo does not report any prior stock splits.
What about Technicals? Taking a look at a point and figure chart from Stockcharts.com:
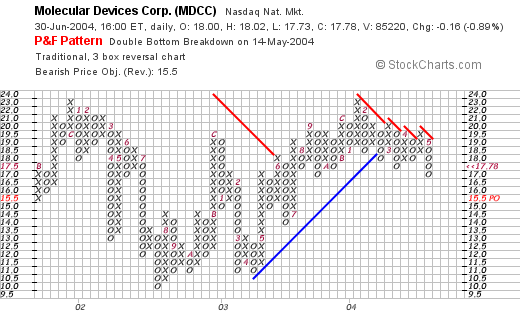
I would have to say that sometime in February, 2004, this stock turned down, failing after several attempt to break through its resistance level. I would like to see this break through the $19.5 level in a strong fashion, maybe with some additional good news, before committing funds to this stock. Now I am NOT a very good chart reader, but what do you think?
Overall the company looks great. They have had great earnings, revenue growth, free cash flow, balance sheet is pretty, PEG only just a bit over 1.0, but the charts looks suspect....maybe the SHORTS do know something I don't. One thing I do is watch CLIMBING stocks that are showing a lot of same-day momentum so that I know that at least for the moment, the technicals are in my favor. This company should stay on the screen for this website....Thanks so much for following up with another question!
If YOU have questions, or comments, please feel free to email me at bobsadviceforstocks@lycos.com or post them right on the website.
Bob
Wednesday, 30 June 2004
June 30, 2004 Boston Scientific (BSX)
Hello Friends! Well I have gotten to enjoy the single posts on this blog for stocks but Boston Scientific (BSX) came up today on some positive comments, and the numbers just cannot be ignored. In the past, I have posted Surmodics (SRDX) which makes the stent for Johnson & Johnson....but BSX is pulling in the lion's share of the market.
As ALWAYS, please consult with your PROFESSIONAL investment advisors as I am just an amateur investor, before taking action regarding this or any other investment on this website to make sure such investments are timely and appropriate for you!

Boston Scientific (BSX) had a nice day today closing at $42.80, up $1.81 or 4.42% on the day. According to the
Yahoo "Profile", BSX "...is a worldwide developer, manufacturer and marketer of medical devices whose products are used in a range of interventional medical specialties, including interventional cardiology, peripheral interventions, neurovascular invtervention, electrophysiology, vascular surgery, endoscopy, oncology, urology and gynecology."

This is a GREAT picture of the Taxus covered cardiac stent, the device that is used to maintain the patency, that is keep the coronary arteries OPEN after angioplasty....hopefully preventing the need for bypass surgery.
On April 20, 2004, BSX
announced 1st quarter 2004 results. For the quarter ended March 31, 2004, net sales came in at $1.08 billion compared to $807 million, a 34% increase. Even removing the favorable currency exchange effects, the revenue growth came in at 27%. Net income jumped 100% to $194 million or $.23/diluted share vs. $97 million, or $.11/diluted share the prior year. These are great results!
Checking the
"5-Yr Restated" Financials from Morningstar.com, we can see that revenue was fairly stable between 1999 when it was $2.8 billion, and 2002 when $2.9 billion of sales were reported. Since, then, sales have grown to $3.8 billion in the TTM, on the back of the fabulous reception BSX's drug-coated stents have received (about 70% of the market agains J&J's Cypher stent.)
Earnings dropped initially from $.45/share in 1999 to a loss of $(.07)/share in 2001, then has increased each year to $.68/share in the TTM.
The free cash flow has been SOLID. $369 million reported in 2001, $624 million in 2002, $599 million in 2003, and $485 million in the TTM.
The balance sheet is adequate with $615 million in cash and $1.37 billion in other current assets vs. $1.74 billion in current liabilities and $882 million in long-term liabilities.
What about Valuation? Looking at
"Key Statistics" on Yahoo, we can see that this is a Large Cap stock with a market cap of $35.74 billion. The trailing p/e is rich at 63.79, but the company is growing its earnings so quickly (estimated) that the forward p/e (fye 31-Dec-05) comes in at 17.98. Thus the PEG is only 1.16, and the Price/sales is a bit rich at 9.13.
Yahoo reports 835.08 million shares outstanding with 567.6 million of them that float. There are 14.18 million shares out short as of 6/7/04, representing 2.50% of the float, but only 1.942 trading days...so this isn't that much imho.
Yahoo reports NO cash dividends, but the company DID relatively recently split the stock 2:1 in November, 2003.
How about Technicals? Looking at a nice "Point & Figure" chart from Stockcharts.com:
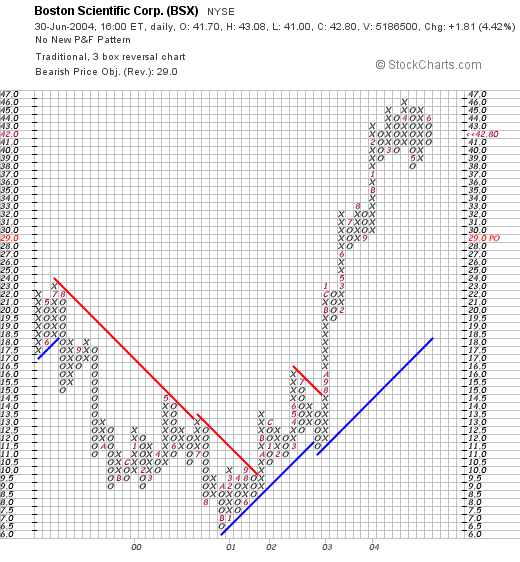
we can see that this stock, which traded lower from $24/share in July, 1999, dropped to a low of $6.5 in September 2000, only to climb steadily until breaking out in August 2003, when it broke through a resistance line of about $14.5 and has now traded very strongly higher....if anything maybe a bit ahead of itself.
What do I think? Well, the numbers are intriguing. The free cash flow is impressive, the valuation isn't that bad as long as the growth continues as the PEG is barely over 1.0. Technicals look nice as well. However, I would NOT write off J&J and their stent....and if that giant pharmaceutical firm every wakes up and stretches it big paws....relatively smaller fish like BSX may have to pay attention!
Thanks again for stopping by. It is getting late here, I posted the three posts I promised!....so off I go. If you have any questions, or comments, please feel free to email me at bobsadviceforstocks@lycos.com
Bob
Posted by bobsadviceforstocks at 11:13 AM CDT
|
Post Comment |
Permalink
Updated: Wednesday, 30 June 2004 11:06 PM CDT
June 30, 2004 The Scotts Company (SMG)
Hello Friends! Scotts (SMG), the lawn company looks like it deserves a spot on this blog. I came across it earlier today and will take a bit of a closer look at the company tonight. As always please remember that I am an amateur investor, so please consult with your professional investment advisors before taking any action based on information on this website!

Scotts Co. (CMG) had a nice day today closing at $63.88, up $3.58 or 5.94% on the day. I do NOT own any shares of Scott, nor do I own any options or leveraged positions. Earlier today, Scotts
updated 2004 financial forecasts and the street 'liked' what it heard!
On April 27, 2004, Scotts
announced 2nd quarter 2004 results. For the quarter ended March 27, 2004, adjusted for currency exchange rates, net sales were up 5% to the reported $729.2 million. Net income came in at $73.1 million or $2.21/diluted share compared with $62.5 million or $2.00/diluted share last year.
Taking a look at the
"5-Yr Restated" financials on Morningstar.com, we can see a steady, if not rapid, growth in revenue from $1.6 billion in 1999 to $2.0 billion in the trailing twelve months.
Earnings have been a bit erratic, but have increased from $2.27/share in 1999 to $2.81/share in the TTM. Free cash flow has been solid with $2 million reported in 2001, increasing to $163 million in the TTM. The balance sheet looks just fine with $14.2 million in cash and $1.3 billion in other current assets, plenty to cover the $593.3 million in current liabilities AND make a nice dent in the $1.2 billion in long-term liabilites.
What about Valuation? Taking a look at
"Key Statistics" from Yahoo.com, we can see that the Market Cap is a mid-cap $2.09 Billion, with a trailing p/e of 23.46 and a forward p/e (fye 30-Sep-05) of 14.13. The PEG is very nice at 1.18, as is the price/sales at 1.00.
Yahoo reports 32.65 million shares outstanding with only 11.20 million of them that float. Of these floating shares fully 9.12% of them are out short as of 6/7/04, representing 7.794 trading days of volume. This is a significant amount of trading volume waiting to be 'covered'...and is bullish for the stock.
No dividend is reported on Yahoo, and no stock splits are noted either.
What about technicals? If we look at a "Point & Figure" on Scotts:
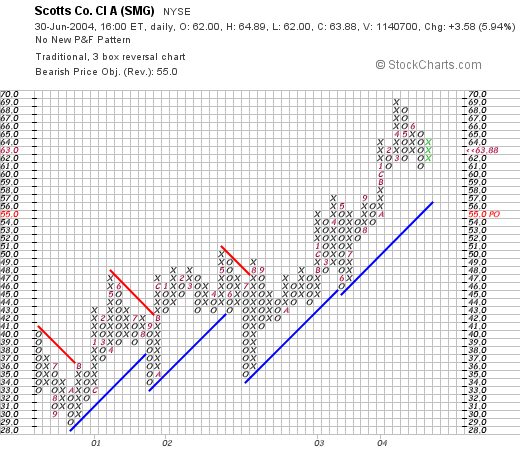
we can see that this stock has a BEAUTIFUL graph, it has been climbing from $29.00 in October, 2000, and has steadily been moving ahead just right on its support line. With the latest good earnings report, I frankly don't see any reason why this shouldn't continue!
What do I think? Well, you KNOW I don't have any MONEY to buy anything....but if I did, I just might. The revenue growth is a little subdued for me...but the outlook looks nice, the valuation is excellent, the balance sheet is fine and technicals are superb. With the recent news upping earnings/revenue estimates....well that is just the ICING on this cake...or should I say it is the FERTILIZER....yuck yuck.
Anyhow, thanks so much for stopping by! I hope you enjoy my posts and continue to visit here often! Please feel free to share your own trading experience....especially if you have chosen to invest in some of the companies discussed on this website! If you would like to comment, or have any questions, please feel free to email me at bobsadviceforstocks@lycos.com
Bob
Posted by bobsadviceforstocks at 10:38 AM CDT
|
Post Comment |
Permalink
Updated: Wednesday, 30 June 2004 10:37 PM CDT
June 30, 2004 Navarre Corp (NAVR)
Hello Friends! Thanks so much for stopping by! Just trying to catch up with some of my earlier brief posts. I hope some of my longer posts recently have helped clarify my investment strategy for you. Please remember that I am an amateur investor, so that means you must do your own investigation of all stocks mentioned on this website and consult with your professional investment advisors to make sure they are appropriate for you!

I came acrosse Navarre Corp. (NAVR) earlier today while looking through the lists of greates percentage gainers today. I do NOT own any shares nor do I have any options on this stock. NAVR closed at $14.39 today, up $.84 or 6.20% on the day. According to the
Yahoo "profile", NAVR "...is a provider of distribution, fulfillment and marketing services for a broad range of home entertainment and multimedia products, including personal computer (PC) software, audio and video titles, and interactive games."
On May 26, 2004, NAVR
reported 4th quarter 2004 results. Net sales for the quarter ended March 31, 2004, increased 70% to $142.6 million from $83.6 million the prior year. Net income for the quarter increased 641% to $3.3 million or $.12/diluted share vs. $442,000 or $.02/diluted share in the prior year. The company ALSO announced estimates for 2005 with revenue in the $550 to $580 million range, and earnings in the $.69 to $.77/share range.
Looking at the
Morningstar "5-Yr Restated" financials, we can see the steady revenue growth from $210.4 million in 1999 to $416.3 milllion in the TTM. It is interesting that even though revenue dipped slightly in 2002 it more than made up for it to maintain the trent in the 2003 year.
During this period, earnings have also fairly steadily improved from a loss of $(4.41) in 1999 to the first profit of $.12/share in 2002, and $.26/share in the trailing twelve months. From the latest quarter results mentioned above, the company is anticipating earnings of about $.70/share in 2005. This also looks nice!
Free cash flow has been less than exciting with $9 million in 2001 dropping to $0 in 2003. The balance sheet is just fine with $14.2 million in cash and $125.7 million in other current assets, enough to easily cover the $110.3 million in current liabilities and the $0 in long-term liabilities.
What about valuation? Looking at
"Key Statistics" on Yahoo.com, we can see that the market cap is a small $368.86 million. The trailing p/e is rich at 55.35, but the forward p/e (fye 31-Mar-05) is downright cheap at 15.99. This is due to the RAPID growth expected. This leaves us with a PEG of 0.80 (anything under 1.0 is great in my humble opinion), and a Price/Sales of 0.83.
Yahoo reports 25.68 million shares outstanding with 21.80 million of them that float. Of these, 8.58% or 1.87 million are out short representing only 1.87 trading days as of 6/7/04. No cash dividend is paid and the last stock split was a 2:1, according to Yahoo, in June, 1996.
How about technicals? Taking a look at a "Point & Figure" chart from Stockcharts.com, we can see:
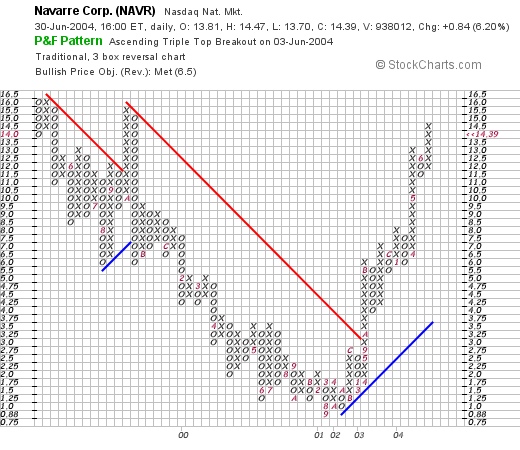
This stock traded steadily lower between May, 1999, from $16/share to a low of $.88 in September, 2001. It has since that time traded steadily higher, and in my humble opinion, the graph looks strong if a bit extended from its support line.
What do I think? I like this stock. If I had some available cash I might just buy a few shares! The revenue and earnings growth looks nice. The free cash flow is marginal...but the balance sheet is just fine. Valuation-wise, the p/e is a bit high, but the company IS growing so fast that the PEG is actually under 1.0. Technically, the chart looks just fine to me.
Anyhow, THAT's NAVR. Thanks so much for stopping by! If you have any questions or comments, please feel free to email me at bobsadviceforstocks@lycos.com
Bob
Posted by bobsadviceforstocks at 10:04 AM CDT
|
Post Comment |
Permalink
Updated: Wednesday, 30 June 2004 10:10 PM CDT
Tuesday, 29 June 2004
A Reader Writes "How do you rank your top 25?"
Hello Friends! A quick note before I shut down for the evening....I had an encouraging email which I would like to share with you....Leon writes,
Hi bob,
Interesting site.....I was wondering how you rank your top 25 that you invest in ? best growth or consistent growth ( as per strong moat)......also more importantly....how has performance of your investment been like with those methods.
Warmest regards.In response to Leon's questions, I would like to point out that I do not have a true top 25 list. What I do have is my
current trading portfolio that I REALLY need to update, which contains the stocks that I have chosen to personally own. I have one additional stock, Rite-Aid (RAD), which is in there that does NOT fit the criteria I have laid out, regarding steading earnings/revenue growth etc. I purchased that stock prior to really setting up this investment protocol about a year and a half ago.
I refer to "natural selection" as a sort of DARWINIAN investment process that creates my portfolio. In other words, I purchase a stock when my system says I can. That is, when I have sold a portion of a stock at a gain, then I can add another position...up to my maximum of 25...currently at 22. I tend to buy a stock THAT DAY....that is showing up in the current gainers...that is showing price momentum THAT day.
If it performs well, that is it doesn't decline in price to a sell point, well then it stays in my portfolio. I have MANY stocks I review that I really like. But I do NOT have enough money to buy them all! And many stocks that I reviewed early like TASER, yes I reviewed TASER Before the 3:1 and the 2:1 split....and I have never owned a share! There are others in my list that have declined significantly. Overall, my current trading portfolio has an unrealized gain of about $30,000....I am fairly heavily margined...that I do NOT recommend....at about 45% equity....the value of the trading accout is about $57,000, so that $30,000 in unrealized gains is quite good! The realized gains/losses for the year is only about $1,500....as I take a LOT of small losses...and am now only getting into long-term gains....I hope you follow.
I am not sure if I have adequately answered your question. I will try to update the website soon to get the latest numbers on the trading account in particular but I DO post almost immediately whenever I make a change!
Going back to your question, best growth or most consistent growth....tough question, but I believe that the BEST growth is the most CONSISTENT growth in earnings AND revenue if possible. I also like to see a real healthy underpinning to the whole operation with nice generation of free cash flow and a healthy balance sheet. If I can get this in a stock over $10, with reasonable valuation....well that would be NIRVANA. :)
Thanks again for stopping by! Remember I am an AMATEUR investor, so please consult with your professional investment advisors if you have questions on these stocks insofar as their appropriateness for your investment situation! Please feel free to write to me at bobsadviceforstocks@lycos.com if you have any other questions or comments!
Bob
June 29, 2004 Getty Images (GYI)
Hello Friends! I didn't have much time to write up Getty Images (GYI) like I usually do, so I left you all a note that I would be back at it! Please remember that I am an amateur investor so that means you need to check into all investments discussed on this blog yourself and PLEASE consult with professional investment advisors before acting on any information on this website. As always, if you have any questions or comments, please also feel free to email me at bobsadviceforstocks@lycos.com and I will try to get back to you....usually with a blog entry!

Scanning throught the lists of greatest percentage gainers today, I came across Getty Images which closed this afternoon at $58.90, up $2.63 or 4.67% on the day. I do NOT own any shares nor do I have any options or leveraged positions in this company. According to the
Yahoo "Profile", Getty "...is a provider of imagery and related products and services worldwide. Getty offers a range of visual content products that include creative or stock imagery (still and moving images), editorial photography, archival imagery (still and moving) and illustrations."
On April 22, 2004, GYI
reported 1st quarter 2004 results. For the quarter ended March 31, 2004, revenue grew 20.1% to $156.5 million, compared with $130.3 million the prior year. Even taking into consideration currency exchange rates, revenue was up 11%. Net income was up almost 100% to $26.1 million or $.43/diluted share vs $13.2 million, or $.23/diluted share the prior year. Also pertinent, the company RAISED guidance for 2004, with revenue anticipated in the $600 to $610 million range and diluted eps of $1.55 to $1.65. This is MY kind of earnings report!
How about longer-term? How has Getty Images been doing? Looking at the
"5-Yr Restated" financials on Morningstar.com, we can see that revenue has grown steadily, except for an unexpected "bump" in 2000, from $247.8 million in 1999 to $549.4 million in the trailing twelve months. With 2004 revenues anticipated in the $600 to $610 million range, this trend is expected even by the company to be continuing!
Earning, which were $(1.94)/share in 1999, turned positive at $.39 in 2002 and have grown to $1.31 in the trailing twelve months. This ALSO looks nice.
Free cash flow which was $(27) million in 2001, turned positive in 2002 at $66 million, and has grown strongly since with $144 million reported in the TTM. This is ANOTHER pretty picture for GYI!
How about the balance sheet? According to Morningstar, GYI has $356.6 million in CASH and another $107.9 million in other current assets. This is PLENTY to cover BOTH the $112.2 million in current liabilities AND the $273.8 million in long-term liabilities. This is the kind of balance sheet I LOVE to see!
And is "valuation" in line? Checking
"Key Statistics" on Yahoo, we can see that the market cap is at $3.43 billion. The trailing p/e is a bit rich at 45.38 but the forward p/e (fye 31-Dec-05) is a bit better at 30.21...but still no bargain. The PEG, however, isn't bad at 1.54 but the price/sales is also a bit rich at 5.97. So we can see that GYI is NOT selling at some kind of "fire sale" price...but sometimes I guess you get what you pay for!
Yahoo reports that there are 58.28 million shares outstanding with 43.90 million shares that float. Currently there appears to be a LOAD of shares out short as of 6/7/04....3.68 million...representing 12.653 trading days of volume or 8.39% of the float. This is a bit of a bullish level...if you use as I have started using...3 days as a cut-off. So with the recent run-up in price...maybe we are seeing a bit of a "squeeze" of those short-sellers who may need to cover their "pre-sold" borrowed shares! Just maybe....
No dividend is paid and no stock-dividend is reported on Yahoo.
What about "Technicals"? Looking at a "Point & Figure" chart from stockcharts.com:
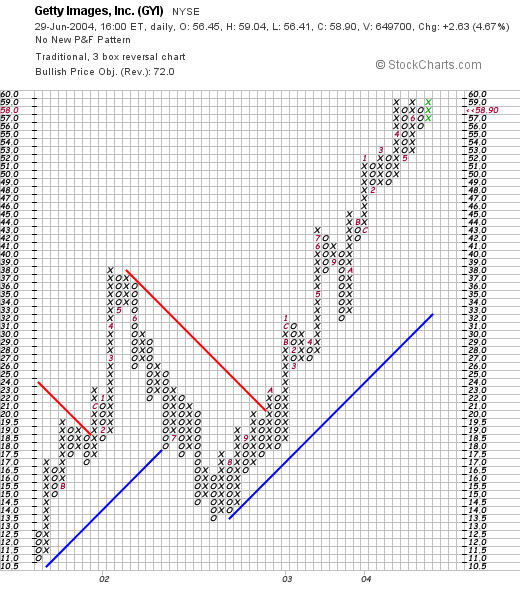
We can see that the stock has been trading very strongly. After reaching a level of $38 in April, 2002, the stock corrected to $13.50 level in July, 2002, and then has traded very strongly higher to the current level of $58.90. If anything the stock price may be a bit ahead of itself...but there isn't much weakness in this graph in my humble opinion.
Well, what do I think. First of all I sold two stocks in the last couple of days on my 8% loss level....Even so, the other stocks have continued to appreciate so overall my trading portfolio has grown. So I do NOT have any money to buy any stocks. I ALWAYS, well most of the time lol, WAIT to sell a portion of a stock at a gain before adding another position. In other words I am back to 22 positions and trying desparately to follow my own rules...and sit on my hands. OTHERWISE, I might just be nibbling on this stock. The earnings results are great, I especially like the increase in current year's expectations as announced by management, in addition, the past 5 years have shown fairly steady growth, the earnings results are gorgeous, the free cash flow is fabulous, and the balance sheet is perfect. Just one problem, other people have also seen this...and the stock does not sell for a cheap price...but then again, I would say with this high quality issue....and I think you can see why I use the term "quality"...lots of people are willing to pay a premium. This is something the short-sellers are gambling against....selling these shares because they are "over-valued" I guess. A bit risky with such nice results!
Thanks again for stopping by! Please email me at bobsadviceforstocks@lycos.com if you have any comments, questions, or words of encouragement! I sure enjoy the opportunity of sharing with you a few of my humble thoughts!
Bob
Posted by bobsadviceforstocks at 3:35 PM CDT
|
Post Comment |
Permalink
Updated: Tuesday, 29 June 2004 10:40 PM CDT
"Trading Transparency" NVEC
Hello Friends! Just a quick note to update you on my trading portfolio. NVE Corporation (NVEC) hit my 8% loss limit and out it went...all 160 shares! I sold them a few moments ago at $36.25. I JUST purchased the shares on 6/24/04 at $39.44. That represents a loss of $(3.19)/share or (8.1)%. Out they went!
Thanks so much for stopping by! Please email me at bobsadviceforstocks@lycos.com if you have any comments, questions or WHATEVER!
Bob
Monday, 28 June 2004
June 28, 2004 Aeroflex, Inc. (ARXX)
Hello Friends! I had a very busy Monday, so am getting around to updating the blog this evening. I sure am glad you all stopped by to visit. Please remember that while I may give you some ideas as "food for thought", I am an AMATEUR investor, so please do your own investigation on all investments discussed on this website, and PLEASE consult with your investment advisors to make sure that any investment decision you may make is appropriate and timely for you!

For those of you who are NOT familiar with my techniques, I will try to review what I am doing as I post this new stock idea. My first step, usually while the market is open, is to peruse the list of greatest percentage gainers. I have found, as you can see from the previous post on NOIZ, that stocks over $10 work best for me and that lower-priced stocks are too volatile to hang onto...at least with what I am doing. Today, I came across Aeroflex (ARXX), which IS a bit of a low priced stock, and which closed at $13.66, up $.85 or 6.64% on the day. According to the
Yahoo "Profile", Aeroflex "...uses its advanced design, engineering and manufacturing abilities to produce microelectronic and testing solutions. Its products are used in the aerospace, defense and broadband communications markets." I really do NOT know a lot about this particular industry....and I do NOT own any shares of Aeroflex at this time....and I cannot BUY any shares because I just sold a stock at a LOSS, so with my system, I am waiting to sell a portion of a stock at a gain...before I add to my portfolio to get back to 24 positions.
O.K., so the stock went up nicely today. "What do you do next?" you are asking. One of the first places I like to check is the latest quarterly result. This gives me an idea of the CURRENT financial health of the company. Two things that I look for is revenue growth AND earnings growth. I can usually find the latest earnings report on Yahoo...but sometimes have to search through the company's own website to get the story.
So how does Aeroflex look in regards to the latest quarterly report? Well, on May 12, 2004, ARRX
reported 3rd quarter 2004 results. Quite frankly, the heavy use of "pro forma" and "GAAP" and "non-GAAP" qualifiers DOES make me a bit concerned. Using GAAP numbers (Generally Accepted Accounting Practices), is preferable to me. These are the tougher numbers to report. For ARRX, for the quarter ended March 31, 2004, revenue or "Net sales" as they report came in at $116.8 million compared to $72.5 million the prior year. That's great! Net income came in at $5.9 million vs $2.9 million the prior year. That's great too. And on a fully diluted basis, the important way to look at per share results, this came in at $.08/share this year vs. $.05/share in 2003. This is also terrific results in my opinion. So ARRX has "passed" the latest quarter results test as I put it!
Next, my routine is to go over to
Morningstar.com and check out the "5-Yr Financials" which give me some important fundamental data on each stock.
The
ARXX 5-Yr Restated financials give me information on stocks with views on revenue growth, earnings growth, dividend payments, free cash flow, and the balance sheet. ARXX shows nice, if not perfect, numbers in these departments.
First revenue growth history. This is visually apparent by looking at the series of bar graphs which show an almost uninterrupted growth in revenue (except for the dip of 2002) from $160.4 million to the $386.5 million in the TTM (trailing twelve monts.)
Earnings have been quite inconsistent dropping from $.20/share in 1999 to $.07/share in TTM. No dividend is paid.
Next step is cash flow. I like to review the "Free cash flow" which as Morningstar shows, is calculated by subtracting "Capital Spending" from the "Operating Cash Flow". For ARXX, we can see that they had $34 million in free cash flow in 2001, $10 million in 2002, $15 million in 2003, and $18 million in the TTM. It is important for me to see that the recent free cash flow is positive and it is an added plus, in my opinion, if the TREND of the cash flow is positive as well...that is that the cash flow is GROWING. ARXX passes this review nicely.
How about the balance sheet? "What do you do with that?" you are asking. I am NOT an accountant. In a simple fashion, which IS the level that I understand a lot of these numbers, I think it is important to see MORE assets than liabilities. And breaking this down into current and long-term amounts, it is crucial that the current assets...those that are readily available, are greater than current liabilities. Thus for ARXX, the $9.9 million in cash and the $210.7 million in "other current assets" greatly outweighs the $81.1 million in current liabilities, and actually is enough to pay off the moderate $52.3 million in long-term debt as well.
Thus, except for the income figure, which was just fine in the latest quarter, the numbers look very good on Morningstar.com to me.
"What do you check next?" you may be asking. Usually at this time I like to look a little at "valuation". O.K., I am not EXACTLY a value investor am I? But why not look at value when thinking about a stock? For this, I usually turn to "Key Statistics" on Yahoo.com. The
"Key Statistics" on Aeroflex show that the "Market Cap" is currently at $1.01 billion. I have to admit that I often have to look up
"Market Capitalization Defined", which from the Investopedia.com website, defines "Micro Cap" as between $50 to $300 million, "Small Cap" between $300 million and $2 billion, "Mid Cap" between $2 billion to $10 billion, "Large Cap" between $10 and $200 billion, and "Mega Cap" (a new term to me!) as over $200 billion.
So we can see that at $1.01 billion, according to this source, ARRX is a "Small Cap" stock.
What about the p/e? For ARRX this comes in at 76.31, which is pretty darn high...but the forward p/e, estimating the p/e based on current price and future earnings, is much better at 23.15 for the fiscal year ending 30-Jun-05. This is reflected in the PEG which at 1.45, isn't really too high. A good number is in the 1.00 range, meaning that the ratio of the p/e and the growth rate was about 1.0. The PEG is a nice way to value a growth stock...but it IS based on future estimates, which can be only as good as the analyst that provides the estimate.
At this point, I usually check the number of shares outstanding and the number that float. ARRX has 74.21 million shares outstanding and 72.20 million of them float. I also am interested in the "Shares Short" which as of 5/10/04 was standing at 2.37 million shares. Is that a lot? Well, in my humble opinion, the important number for this question is the "Short Ratio" which as of 5/10/04 was standing at 2.442. This means that it would take 2.442 days worth of current daily trading volume for the short sellers to "cover" their shorts, that is to buy back the borrowed shares that they have sold. When the short interest starts getting over 3.0, in my opinion, this means that there is an increased chance of seeing a "short squeeze" that is an almost panic to purchase shares to cover the shorts in the face of good news (!) and a climbing stock price. (Both of these events are bad as a rule for short-sellers.)
Finally, I like to see if there is a dividend (no), and if the stock recently split. Here Yahoo reports that ARRX last split 2:1 in November, 2000.
Lately, I have been using graphs to get me a picture of the trading activity. I like to use Point and Figure charts on
Stockcharts.com. Over the last couple of years, I have grown to like these charts...if you would like you can read or order a GREAT book by Thomas J. Dorsey on this subject:
"Point and Figure Charting: The Essential Application for Forecasting and Tracking Market Prices, 2nd Edition" by Thomas J. Dorsey. Anyhow, this is the ARRX chart:
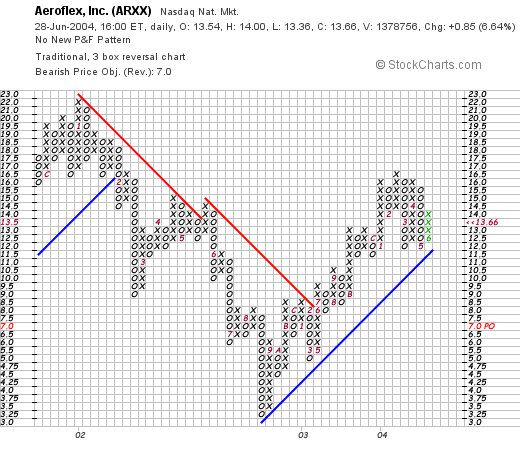
Here we can by the columns of "climbing x's" and "descending O's" that the stock was trading lower between January, 2002, and September,2002, after which it has steadily been rising from the $3.00 range to the current $12.00 level. The graph looks reasonably strong to me as long as it stays above it's "support level" which is outlined in blue. That is my simple understanding of graphing :).
So what do I think, now that I have perused all of this data? Well, the stock made a nice move today, its latest quarterly report was very strong, the 5-yr results on Morningstar are impressive, except for the earnings which have been erratic, the free cash flow is positive and improving and the balance sheet looks quite clean.
Valuation-wise, the p/e is steep but the stock is expected to grow so quickly that the PEG is only about 1.5. There are a lot of shares out but not many are sold short. And the technicals look encouraging.
This IS the kind of stock I might buy....but as I have said many times, I am limited in my trading strategy to 25 positions, have 23 so room for two more, but am waiting to ADD a new position until such time as I SELL a portion of a position at one of my set goals. That is my strategy, you may choose to do something completely different!
I hope all of this discussion is helpful to you! Please let me know if you like it, by emailing me at bobsadviceforstocks@lycos.com with your comments and questions!
Thanks again for stopping by and please come back and visit again!
Bob
Posted by bobsadviceforstocks at 3:05 PM CDT
|
Post Comment |
Permalink
Updated: Monday, 28 June 2004 9:47 PM CDT
Newer | Latest | Older


 Tempur-Pedic Intl (TPX) had a nice day in an otherwise ugly trading session closing at $14.45, up $.44 or 3.14% on the day. I do not have any shares of TPX nor any leveraged positions.
  In addition, TPX increased guidance for the balance of 2004.
  What about "valuation?" Taking a look at
 First of all, Molecular Devices (MDCC), closed at $17.78 yesterday. According to the
  Revenues for the quarter came in at $27.3 million, an 11% increase compared to the prior year. Net income came in at $1.4 million, compared to $721,000 the prior year. On a diluted per share basis this came in at $.10/share vs $.05 per share, a 100% increase. This was a nice earnings report. In addition, MDCC projected continued growth for the upcoming quarters.
 Boston Scientific (BSX) had a nice day today closing at $42.80, up $1.81 or 4.42% on the day. According to the
  This is a GREAT picture of the Taxus covered cardiac stent, the device that is used to maintain the patency, that is keep the coronary arteries OPEN after angioplasty....hopefully preventing the need for bypass surgery.
 Scotts Co. (CMG) had a nice day today closing at $63.88, up $3.58 or 5.94% on the day. I do NOT own any shares of Scott, nor do I own any options or leveraged positions. Earlier today, Scotts
  Earnings have been a bit erratic, but have increased from $2.27/share in 1999 to $2.81/share in the TTM. Free cash flow has been solid with $2 million reported in 2001, increasing to $163 million in the TTM. The balance sheet looks just fine with $14.2 million in cash and $1.3 billion in other current assets, plenty to cover the $593.3 million in current liabilities AND make a nice dent in the $1.2 billion in long-term liabilites.
 I came acrosse Navarre Corp. (NAVR) earlier today while looking through the lists of greates percentage gainers today. I do NOT own any shares nor do I have any options on this stock. NAVR closed at $14.39 today, up $.84 or 6.20% on the day. According to the
 Scanning throught the lists of greatest percentage gainers today, I came across Getty Images which closed this afternoon at $58.90, up $2.63 or 4.67% on the day. I do NOT own any shares nor do I have any options or leveraged positions in this company. According to the
 For those of you who are NOT familiar with my techniques, I will try to review what I am doing as I post this new stock idea. My first step, usually while the market is open, is to peruse the list of greatest percentage gainers. I have found, as you can see from the previous post on NOIZ, that stocks over $10 work best for me and that lower-priced stocks are too volatile to hang onto...at least with what I am doing. Today, I came across Aeroflex (ARXX), which IS a bit of a low priced stock, and which closed at $13.66, up $.85 or 6.64% on the day. According to the