Stock Picks Bob's Advice
Wednesday, 13 April 2005
April 13, 2005 LoJack (LOJN)
Hello Friends! Thanks so much for stopping by and visiting my blog,
Stock Picks Bob's Advice. As always, please remember that I am an amateur investor, so please consult with your professional investment advisors prior to making any investment decisions based on information on this website.
It wasn't a very good day in the market today. Yesterday, we saw a big swing from negative to positive territory and today things stayed weak with the Dow down about 1% and the NASDAQ down about 1.5%. However, it is still possible to look at stocks and find candidates for investment.

For any of you who might be new to my strategy, my first place in identifying a possible investment candidate is to scan the
list of top % gainers on the NASDAQ. I prefer to stay with stocks over $10, and LoJack (LOJN) came to my attention. I do NOT own any shares of LOJN nor do I have any options.

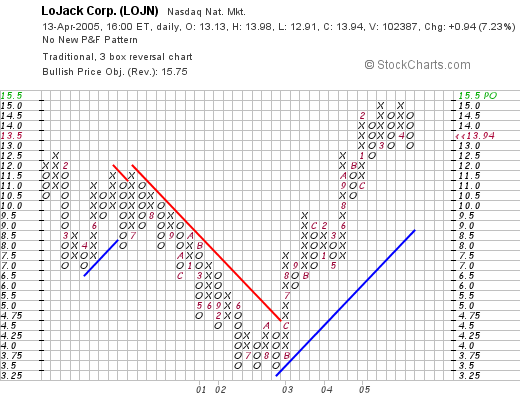
LOJN closed at $13.94, up $.94 or 7.23% on the day. According to the
Yahoo "Profile" on LOJN, LoJack "...is a provider of technology products and services for tracking and recovering mobile assets." LoJack is used to recover cars that have been stolen, in other words :).
My next step in reviewing a stock is to check the latest quarterly report. I am looking for increasing revenue AND earnings. On March 3, 2005, LOJN
reported 4th quarter 2004 results. Revenue for the quarter ended December 31, 2004, increased by 20% to $39.6 million compared to $33.0 million the prior year. Net income jumped by 26% to $3.1 million or $.18/diluted share, up from net income of $2.5 million or $.16/diluted share for the same quarter the prior year.
How about "longer-term"? In other words, is this just an atypical quarter, or has this company demonstrated consistent performance the past five years?
For this examination, I have been using Morningstar.com and in particular, the
"5-Yr Restated" financial statement on Morningstar. Here we can see that revenue growth has been steady, increasing from $83 million in 1999 to $139 million in the trailing twelve months (TTM).

Earnings, however, have NOT been as consistent, dropping from $.57/share in 1999 to $.12/share in 2002, before turning around and increasing steadily to $.62/share in the trailing twelve months.
Next thing I like to examine is "free cash flow", which again is on the same Morningstar page. Here we can see positive $8 million dropping to a negative $(1) million in 2002, but increasing to $6 million in the TTM.
The balance sheet, right under the free cash flow section shows $13.1 million in cash and $47.4 million in other current assets, plenty to cover both the $24 million in current liabilities and the $17.7 million in long-term liabilities combined...with assets left over. This looks just fine with current assets handily exceeding current liabilities.
What about "valuation"? Looking at
"Key Statistics" from Yahoo, we can see that this is a small cap stock with a market capitalization of only $231.9 million. The trailing p/e isn't bad at 21.95, and the forward p/e (fye 31-Dec-06) is nicer at 15.66. There is no calculated PEG.

The Price/Sales ratio is 1.48. Using the
Paul Sturm approach to Price/Sales ratios, and utilizing my
Fidelity.com research to get competitor P/S ratios, Fidelity has LoJack with a Price/Sales ratio of 1.5. This is comparable to a P/S ratio of 1.3 with Armor Holdings, 0.9 for Checkpoint Systems, 0.4 at Brink's, 0.4 at Compudyne and 1.5 for Integrated Alarm Svcs. Thus, it is not the cheapest in the group!
LOJN has 16.59 million shares outstanding with 16.10 million of them that "float". Currently there are 81,000 shares out short representing 0.50% of the float or only 0.587 trading days of volume as of 3/8/05. This is not much of a factor imho.
Yahoo does not show any cash dividend and no stock dividends are reported either.
What about "technicals"? That is, how does the price chart look? For my reviews, I like to look at
"Point & Figure" charts which I believe help show the overall forces both bullish and bearish driving a stock price. For LOJN, the
Stockcharts.com Point & Figure chart shows a weak stock price between June, 2000, when the stock was trading at $12.00/share until August, 2002, when the stock had declined all of the way to $3.50/share and actually appears to have hit this level three times (a "triple bottom"), and the stock subsequently recovered throughout 2003 and 2004 until its current price, closing just under $14/share.
So what do I think? Well actually, I think the stock is very interesting. I am not in the market to purchase any shares, but I am always on the "look-out" for interesting candidates so that when I am "eligible" to buy, I may recognize a stock that I have reviewed previously.
In summary, the stock made a nice move higher today in a very weak market. The last quarter was solid, the last five years has seen steady revenue growth. Earnings have been more erratic, but have been moving higher the last few years. The company is generating free cash and the balance sheet looks nice. Valuation issues look fine, however, in its group of security companies, this stock is a relatively pricey pick among its peers. Finally, the chart looks solid for the last few years. In fact, if I were buying a stock, well it might just be this one!
Thanks again for stopping by! If you have any questions, comments, or words of encouragement, please feel free to leave your messages right here on the blog or email me at bobsadviceforstocks@lycos.com.
Bob
Monday, 11 April 2005
Paul Sturm: Nice Article on Price/Sales ratio
One of my favorite financial writers is Paul Sturm. He
wrote recently about the importance of revenue growth and price/sales ratios in determining relative valuation of a stock.
He points out how earnings can be manipulated in reporting a stock's results, but in general, it is more difficult to manipulate revenue numbers (but not unheard of!). Also, surprises on revenue numbers on the upside are important factors in a stock's price performance.
I shall have to look harder at those Price/Sales figures and work on getting some industry numbers for each stock. Meanwhile, read Paul's article and enjoy!
Bob
Sunday, 10 April 2005
"Looking Back One Year" A review of stock picks from the week of February 23, 2004

Hello Friends! Thanks so much for stopping by and visiting my blog,
Stock Picks Bob's Advice. As always, please remember that I am an amateur investor, so please consult with your professional investment advisors prior to making any investment decisions based on information on this website. I cannot be responsible for any losses generated by your trading and shall not ask for any credit!
If you are new to this website, I am happy to welcome you and hope that you enjoy your visit. My blog performs two functions: looking at a variety of stock investment possibilities, and then actually building a real portfolio and following along with those investments. I do not buy every stock that I review, in fact, I currently own 20 stocks in my
"Trading Portfolio". This is a real investment portfolio and I try very hard to update my trading activity on this blog as events happen. However, at the same time I have reviewed literally hundreds of stocks since starting this blog almost two years ago. I also have a Xanga account which acts as a "mirror" site, but offers Xanga readers what I consider a more personalized website.
In order to determine how well the multitude of stock picks turned out, I use the weekend, when I get a chance, to review past stock picks with about a trailing one year period. Last weekend I reviewed stock picks from the week of February 16, 2004. This week, I shall be looking at picks from the week of February 23, 2004. Besides looking at the price performance, I also like to look at the latest quarterly result, which I believe gives us a good idea whether the stock is still a good investment at least from my perspective. If both revenue and earnings are positive, I give the stock a "thumbs-up", otherwise down goes the thumb!
By the way, this analysis, as I have pointed out previously, assumes a buy and hold strategy that I do NOT employ in practice. I practice selling my losing stocks quickly and then selling portions of my gaining stocks slowly at pre-determined sale points. That certainly would affect the performance of any portfolio that I actually owned!

On February 23, 2004, I
posted Escalon Medical (ESMC) on Stock Picks at $10.60. ESMC closed on 4/8/05 at $5.22, for a loss of $(5.38) or (50.8)%.

On February 14, 2005, ESMC
reported 2nd quarter 2005 results. For the quarter ended December 31, 2004, net revenue came in at $6.3 million, compared with $3.8 million the prior year. However, the company reported a net loss of $(422,625) or $(.072)/diluted share compared with net income of $820,961 or $.196/diluted share in the second quarter of 2004.

I
posted Mannatech (MTEX) on Stock Picks on February 24, 2004, at a price of $9.98. MTEX closed at $20.29 on 4/8/05, for a gain of $10.31 or 103%.

On March 9, 2005,
MTEX announced 4th quarter 2004 results. Net sales for the fourth quarter came in at $84.2 million, a 55.1% increase over the $29.9 million last year. Net income was $4.0 million or $.15/diluted share, a 21.9% increase over the fourth quarter of 2003.

On February 25, 2004, I
picked Lipman Electronic Engineering (LPMA) for Stock Picks at a price of $44.98. LPMA had a 2:1 split on 7/2/04, giving us an effective stock pick price of $22.49. LPMA closed at $29.12 on 4/8/05, for a gain of $6.63 or 29.5%.
On January 31, 2005, LPMA
reported 4th quarter 2004 results. Revenue grew strongly by 78% to $65.7 million from $36.9 million last year. However, while net income grew to $9.7 million from $9.6 million last year, due to an increased number of shares, this worked out to $.35/share down from $.44/share last year.

On February 27, 2004, I
posted ShuffleMaster (SHFL) on Stock Picks at a price of $41.45. SHFL has had two 3:2 splits since (4/04 and 1/05) and thus, the effective stock pick price works out to $18.42. SHFL closed at $28.15 on 4/8/05, for a gain of $9.73 or 52.8%.
On March 3, 2005, SHFL
reported 1st quarter 2005 results which were quite good! Revenue increased 63% to $25.4 million and diluted earnings per share increased 55% to $.17/share.
So how did I "do" for picking stock picks for that week in February, 2004? Well, actually quite well for these four selections. I had one big loser (ESMC) and four very strong gainers. Thus, the average percentage gain that week was 33.6%.
Thanks so much for stopping by! I hope that you have a very good week and that you visit here often. I enjoy hearing from readers and if you have any questions, comments, or words of encouragement, please feel free to email me at bobsadviceforstocks@lycos.com or just go ahead and leave your comments right here in the blog!
Bob
Friday, 8 April 2005
April 8, 2005 The Buckle, Inc. (BKE)
Hello Friends! Thanks so much for stopping by and visiting my blog,
Stock Picks Bob's Advice. As always, please remember that I am an amateur investor, so please consult with your professional investment advisors prior to making any investment decisions based on information on this website.

The market is correcting a bit today, but that doesn't mean we can't be looking for interesting stock investment ideas! Scanning the
list of top % gainers on the NYSE today, I came across "The Buckle", BKE, which as I write, is trading at $35.60, up $1.10 or 3.19% on the day. I do not own any shares of BKE nor do I own any options.

According to the
Yahoo "Profile" on BKE, The Buckle is "...a retailer of medium to better-priced casual apparel, footwear and accessories for fashion conscious young men and women."
What is helping the stock rise today, in the face of an overall weak equity trading day, was a
story released yesterday that same store sales had jumped 8% for the month of March. Overall sales increased 13.3% to $43.2 million from $38.1 million the prior year.
On March 3, 2005, BKE
reported 4th quarter 2004 results. Net sales for the fourt quarter ended January 29, 2005, jumped 8.6% to $145.6 million from $134.1 million the prior year. On a comparable store net sales basis this came in at a 3.7% increase for the period. Net income for the quarter was $17.1 million or $.79/share, up from $15.0 million or $.71/share.
Longer-term, looking at the
Morningstar.com "5-Yr Restated" financials, we can see a steady ramp-up of revenue growth from $375.5 million in 2000 to the $459.4 million in the trailing twelve months (TTM).
Earnings have been more erratic, dropping from $1.64/share in 2000 to $1.47/share in 2003, but increasing strongly since that time.
Free cash flow is solidly positive varying from $33 million in 2002 to $47 million in the trailing twelve months (TTM).
The balance sheet also looks nice with $150.1 million in cash, more than enough to pay off the $44.8 million in current liabilities as well as the $3.2 million in long-term liabilities, more than three times over! In addition, Morningstar reports that BKE has $102.6 million in other current assets.
What about "valuation"? Looking at
"Key Statistics" on BKE from Yahoo, we can see that this is a mid-cap stock with a market capitalization of $762.93 million. The trailing p/e is a moderate 24.75, with a more reasonable forward (fye 31-Jan-06) of 13.68. Yahoo has the peg (5 yr expected) at 1.34. Price/sales is moderate at 1.77.
Yahoo shows that there are 21.62 million shares outstanding with 8.60 million of them that float. Of these, 110,000 shares were out "short" as of 3/8/05. This represented 1.28% of the float, or 5.5 trading days of volume.
The Buckle pays a dividend, with $.48/share reported in Yahoo, yielding 1.39%. The last stock split was a 3:2 split reported in June, 1998.
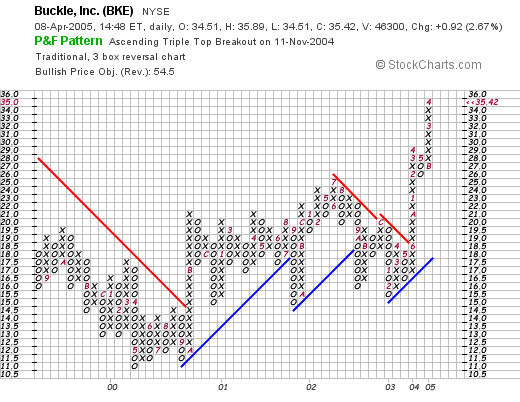
If we take a look at a chart, especially the
Stockcharts.com "Point & Figure" chart on BKE, we can see that this stock was trading lower from $19.50 in October, 2000, to a low at $11.00 in May, 2000. Since then it has been steadily higher, making a sharp break towards the upside in June, 2003. The chart looks strong if a bit over-extended over the short-term.
So what do I think? Well, I like this stock for the following reasons: retail sales are strong with same store sales the latest month showing even stronger growth than the last quarter's rate, earnings were positive along with earnings the latest quarter as well as for the past five years. Free cash flow is positive, the balance sheet is beautiful with loads of cash and very low liabilities, the valuation is reasonable and the chart looks encouraging.
As always, I am sitting on my hands, as I am waiting for one of my stocks to hit a sale point at a gain. I am fairly close with AMHC, but waiting until it actually hits its sale target!
Thanks again for stopping by! If you have any questions, comments, or words of encouragement, please feel free to email me with your thoughts at bobsadviceforstocks@lycos.com. Hope you all have a wonderful weekend!
Bob
Thursday, 7 April 2005
April 7, 2005 Bed Bath & Beyond (BBBY)
Hello Friends! Thanks so much for stopping by and visiting my blog,
Stock Picks Bob's Advice. As always, please remember that I am an amateur investor so please consult with your professional investment advisors prior to making any investment decisions based on information on this website. I cannot be responsible for any losses generated by your trading activity nor can I make any claim for any gains you generate trading stocks and investments!

I managed to scan the
list of top % gainers on the NASDAQ today, and came across Bed Bath & Beyond (BBBY). BBBY had a great day, closing at $40.80, up $4.06 or 11.05% on the day. I do not own any shares or options on this stock. In fact, I had to go through my list of
2003 Stock Picks,
2004 Stock Picks, and
2005 Stock Picks, because I was almost certain that I had reviewed this one before!
According to the
Yahoo "Profile" on BBBY, Bed Bath and Beyond "...operates specialty retail stores in the United States, including Bed Bath & Beyond stores (BBB), Harmon stores and Christmas Tree Shops stores (CTS)."
What drove the stock nicely higher today was a "better-than expected"
4th quarter 2004 earnings report. For the final quarter of 2004, sales increased 13.1% to $1.47 billion from $1.3 billion in the fourth quarter of 2003. Same-store-sales growth came in at 5.1% for stores open at least a year. Net income came in at $181 million or $.59/share up from $144.2 million or $.47/share last year. According to this report, analysts surveyed by Thomson Financial were "looking for the company to post earnings of $.55/share on sales of $1.45 billion.
Taking a look at the
Morningstar.com "5-Yr Restated" financials, we can see a beautiful ramp-up of revenue from $1.9 billion in 2000 to $5.0 billion in the trailing twelve months (TTM).
Earnings during this period have a perfect growth record with $.46/share reported in 2000, increasing to $1.53 in the TTM.
Free cash flow has also been solid with $216 million in 2002, increasing to $417 million in the TTM.
The balance sheet is also very nice with $968.8 million in cash, enough to almost cover both the $885.0 million in current liabilities and the $114.8 million in long-term liabilities combined. Besides the cash, Morningstar.com reports $1.3 billion in other current assets!

What about "valuation" questions? Taking a look at the
Yahoo "Key Statistics", we can see that this is a large cap stock with a market capitalization of $12.35 Billion. The trailing p/e is a moderate 24.76 with a forward p/e (fye 26-Feb-07) of 18.38, and thus a 5-yr estimated PEG of 0.86. Price/sales is moderate at 2.23.
Yahoo reports 302.61 million shares outstanding with 300.80 million of them that float. There were 6.00 million shares out short as of 3/8/05, representing only 1.99% of the float or 2.078 trading days of volume. No cash dividend is paid and the last stock split reported on Yahoo was a 2:1 split 8/14/00.
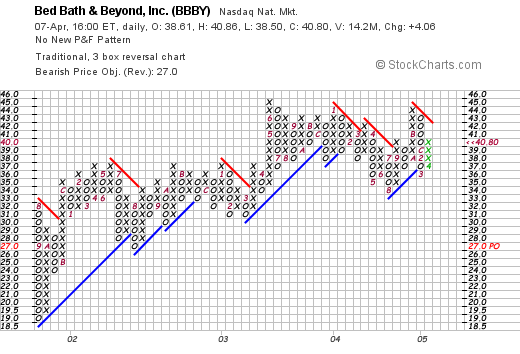
What does the price chart look like? How are the "technicals" on BBBY? Looking at a
"Point & Figure" chart from Stockcharts.com on BBBY, we can see that this stock has been showing modest price appreciation since trading at around $19.0 in September of 2001. The stock has hit resistance at the $45 level since hitting it in June, 2003, again in January, 2004, and again in October 2004. I don't think the stock price movement has gotten too far ahead of itself, but would like to see the price break above $45, which it coule do in the next couple of trading sessions.
 So what do I think about all of this? Well, actually, I like this stock a lot. The latest quarter result was solid, with 5.1% same store sales growth as well. The past five years show a perfect record of increasing revenue and earnings growth. The company is spinning off 'gobs' of free cash flow contributing to a solid balance sheet. The valuation issues are reasonable and the graph looks adequate, appearing to have been consolidating in price for about a year now.
If I had some money, and was going to purchase some stock, this one would be near the top of my list today. As you know, I wait for a buy signal generated by my own portfolio before jumping in! So I shall be sitting on my hands for now. Thanks so much again for stopping by and visiting. Please feel free to leave comments right here on my blog, or if you have any questions or comments, and would like to write, you can email me at bobsadviceforstocks@lycos.com!
Bob
Tuesday, 5 April 2005
"Trading Transparency" EXAC
Hello Friends! Thanks so much for stopping by and visiting my blog,
Stock Picks Bob's Advice. As always, please remember that I am an amateur investor, so please consult with your professional investment advisors prior to making any investment decisions based on information on this website.
One of the stocks I have been watching has been Exactech (EXAC), an orthopedics device manufacturer that overall, has been a good performer for me in my portfolio. Today, EXAC
announced lower guidance for profit/revenues for the 1st quarter, and the stock took it 'on the chin', currently rebounding slightly at $15.39, down $(1.70) or (9.95)% on the day.
I had 135 shares remaining of EXAC with a cost basis of $10.78 acquired over two years ago on 1/2/03. I just sold my remaining shares a few moments ago at $15.331, for a gain of $4.551 or 42.2%. Since I had sold this stock three times previously on gains (!), at 30, 60, and 90% levels, crossing the 45% gain point on the downside triggered (manually) a sale point for me and out the shares went.
Unfortunately, I shall now be sitting on my hands once again, not replacing this stock, until such time as I sell a portion of an existing position at a gain! Thanks again for stopping by! If you have any questions or comments, please feel free to email me at bobsadviceforstocks@lycos.com.
Bob
April 5, 2005 Greif Inc. Cl. A (GEF)
Hello Friends! Thanks so much for stopping by and visiting my blog,
Stock Picks Bob's Advice. As always, please remember that I am an amateur investor so please consult with your professional investment advisors prior to making any investment decisions based on information on this website. Use of this website implies your understanding that I cannot be responsible for any losses generated by your own trading activity and I shall not ask for any part of any profits that you might accrue.

Yesterday, I purchased some shares of Greif (GEF), and I wanted to go over the numbers and the information that I found on review of this company and why I thought it made a nice addition to my portfolio. Yesterday, GEF made the
list of top % gainers on the NYSE, and thus was in my list of stocks to consider purchasing in light of my recent sale of a portion of Cantel (CMN) and Ventana (VMSI) at gain targets.

Currently, as I am writing, GEF is trading at $74.06/share, up $.41 or .56% on the day today.
According to the
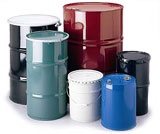
Yahoo "Profile" on GEF, Greif "...is a global producer of industrial packaging products with manufacturing facilities located in over 40 countries. The Company offers a line of industrial packaging products, such as steel, fiber and plastic drums; intermediate bulk containers, closure systems for industrial packaging products and polycarbonate water bottles, which are complemented by a variety of value-added services."
On March 2, 2005, Greif
reported 1st quarter 2005 results. Net sales for the quarter rose 24% to $582.6 million for the first quarter of 2005, up from $468.9 million for the same quarter last year. Net income was $15.1 million this year compared with a loss of $(3.4) million last year. Diluted earnings per share came in at $.52/share compared to a loss of $(.12)/share last year.
How about longer-term? Looking at the
Morningstar.com "5-Yr Restated" financials, we can see that revenue has grown from $1.0 billion in 2000 to $2.3 billion in the trailing twelve months (TTM). Earnings have been more erratic, increasing to
$3.14/share in 2001, then dropping to $.34/share in 2003, but increasing since then to $2.30/share in the TTM.
Free cash flow has been solid, increasing from $90 million in 2002 to $175 million in the TTM.
The balance sheet is adequate if not overpowering. That is, cash of $56.1 million, combined with the $550.2 million in other current assets, is plenty to cover the $384 million in current liabilities and make a bit of a dent in the $761.2 million in long-term debt. I always prefer a bit more in the assets than liabilities.

What about "valuation"? Looking at
Yahoo "Key Statistics" on GEF, we can see that this is larger mid-cap stock with a market capitalization of $1.69 billion. The trailing p/e is moderate at 25.62, with a forward p/e (fye 31-Oct-06) of 16.89. Thus the PEG is at 1.19, demonstrating rather reasonable valuation. The Price/sales is nice at 0.72.
Yahoo reports 22.81 million shares outstanding with 16.20 million that float. Of these, as of 3/8/05, there were 418,000 shares out short representing a bit of a significant 5.359 trading days of volume, but only 2.58% of the float is actually out short.
This NYSE company does pay a small dividend of $.64/share yielding 0.87%. No stock dividends are reported on Yahoo.
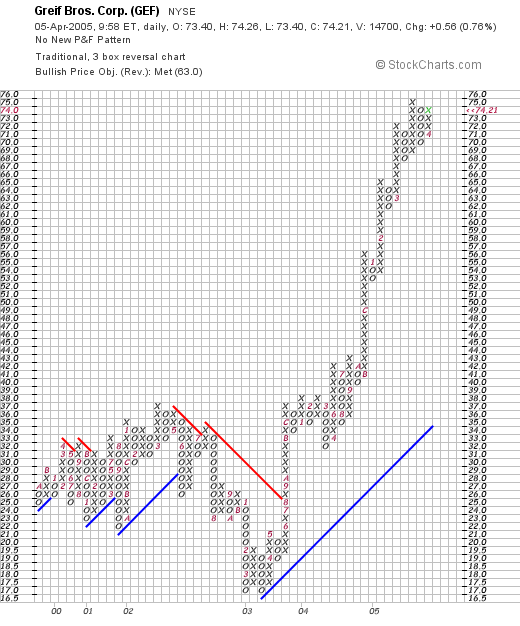
And how does the chart look like? Taking a look at a
"Point & Figure" chart on GEF from Stockcharts.com, we can see that this stock demonstrated what I would call a rather lackluster performance between late 2000 when in was trading in a range between $25 and $31, when it actually broke down in price to a low at $16.50. Starting in March, 2003, the stock has rallied strongly to its current $74 level. If anything the graph looks a bit overextened with the stock price significantly above its support level (the 45 degree blue line on this chart)
Well what do I think? Well, looking closer at the stock, I can see attractive things that got me to make a purchase decision. Usually, I take a quick look before making a purchase and think later (lol). The latest quarter is great. The revenue growth is strong. Earnings have been a bit erratic. Free cash flow is solid. The balance sheet is fine. Valuation is reasonable. And the graph is strong if a bit overextended.
The stock, in the packaging industry, is something different from my usualy holdings in my portfolio, and thus, I felt it would be a helpful addition. Time will tell. I shall be keeping a close watch on this as I do all of my stocks!
Thanks again for stopping by. Please feel free to email me at bobsadviceforstocks@lycos.com if you have any questions, comments, or words of encouragement!
Bob
Monday, 4 April 2005
"Revisiting a Stock Pick" Jos A. Bank (JOSB)
Hello Friends! Thanks so much for stopping by and visiting my blog,
Stock Picks Bob's Advice. As always, please remember that I am an amateur investor, so please consult with your professional investment advisors prior to making any investment decisions based on information on this website!

That nickel was really 'burning a hole' in my pocket today! Having sold a portion of Cantel (CMN) and Ventana (VMSI) today, I was "eligible" to purchase two additional positions. Looking through the
list of top % gainers on the NASDAQ, I came across Jos A. Bank (JOSB) which closed at $31.88, up $2.17 or 7.30% on the day. By the close of trading today, the stock was no longer on the list of top gainers which stopped with a 7.91% gain, but during the day it was there, and I made a purchase of shares on that basis. I actually posted JOSB on Stock Picks on 8/7/03, when it was trading for a split-adjusted $23.56.
According to the
Yahoo "Profile" On Jos A Bank (JOSB), the company "...is a designer, retailer and direct marketer, through stores, catalog and the Internet, of men's tailored and casual clothing and accessories."
What drove the stock higher today was a
preliminary 4th quarter 2004 earnings report. Sales for the fourth quarter 2004 increased 26.8% to $127.9 million compared with sales of $100.9 million in the prior year same period. More importantly, same store sales jumped 9.4% in the fourth quarter and 8.4% for the FY2004, while combined catalog and internet sales grew 31% for the quarter over the prior year. Net income for the quarter came in at $12.6 million, up from $9.6 million the prior year. On a diluted per share basis, this came in at $.88/share up from $.68/share the prior year. I especially like the same store sales growth in this report!

How about longer term? For this, I like to turn to the
Morningstar.com "5-Yr Restated" financials for JOSB. Here we can see the steady revenue growth from $193.5 million in 2000 to $345.5 million in the trailing twelve months (TTM).
Earnings/share have grown in an uninterrupted fashion from $.11/share in 2000 to $1.54/share in the TTM.
Free cash flow has been a bit erratic, but is at a positive $6 million in the TTM.
The balance sheet is solid with $1.3 million in cash and $153.4 million in other current assets, balanced against $65.4 million in current liabilities and $45.8 million in long-term debt.
What about "valuation"? For that I like to turn right back to Yahoo, for
"Key Statistics" on JOSB from Yahoo. First, this is a small cap stock with a market capitalization of only $427.03 million.
The trailing p/e is reasonable (imho) at 20.65, with a forward p/e (fye 31-Jan-06) of 15.40. Thus, the 5-yr estimated PEG is downright cheap at 0.72, and the Price/Sales raio is also low at 1/15.
Yahoo reports only 13.40 million shares outstanding with 11.80 million of them that float. As of 3/8/05, there were 6.03 million shares out short, representing 51.11% of the float and 17.583 trading days of average volume. This appears quite significant to me (anything over 3.0 days is suspect in my book), and we may be in the throes of a bit of a short "squeeze".
No dividend is paid and the last stock split was a 5:4 split on 8/19/04.
How about "technicals"? In other words, what does the chart look like? Taking a look at a
Stockchart.com "point & figure" chart on JOSB:
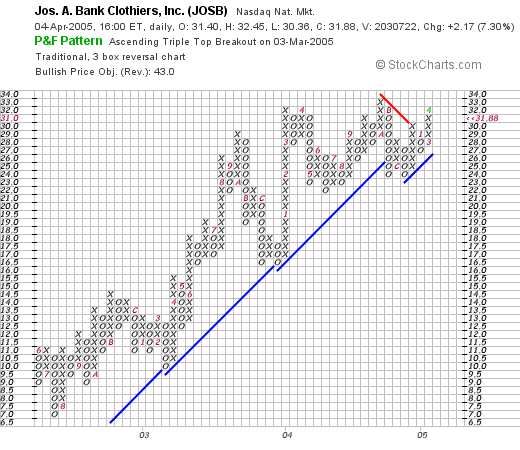
this chart actually looks fairly strong with an impressive move from $7.00 in July, 2002, to the $31.88 level where it closed today.
So what do I think? Well, I liked it enough to post it in August, 2003, and I still like it enough to buy some shares. The company is small but growing strongly with upper single-digit same store sales growth. Revenue and earnings growth have been very steady the past 5 years, company is free-cash-flow positive and has a nice balance sheet. Valuation is reasonable with a PEG under 1.0 and the large number of shares out short is just pent-up buying demand. Things look nice to me!
Thanks again for stopping by! If you have any questions or comments, please feel free to email me at bobsadviceforstocks@lycos.com.
Bob
"Trading Transparency" JOSB, GEF
Hello Friends! Thanks so much for stopping by and visiting my blog,
Stock Picks Bob's Advice. As always, please remember that I am an amateur investor, so PLEASE consult with your professional investment advisors prior to making any decisions based on information on this website. I cannot be responsible for any losses you incur and I shall not make any claims on any gains you realize!
If you have been reading my posts, a few moments ago I wrote up my sales this mornings of portions of two different positions (CMN and VMSI) at gains. Thus, these sales at gains game me "permission" to add two new positions to my portfolio. If you know me, as you will if you read these posts (lol), then you would realize that I am not very good at sitting on my hands. Scanning through the lists of top % gainers today, I came across Jos A. Banks (JOSB), which I have reviewed previously on Stock Picks and a new one Greif (GEF) which I have not previously reviewed but appears to fit my "parameters" fairly well. I purchased 240 shares of JOSB at $31.865, and 120 shares of GEF at $72.27 a few moments ago.
I will try to review JOSB later as well as introduce GEF on this site soon. Just wanted to keep you posted regarding my real transactions in my trading account! Thanks again for visiting. If you have any questions or comment, please feel free to email me at bobsadviceforstocks@lycos.com.
Bob
"Trading Transparency" CMN, VMSI
Hello Friends! Thanks so much for stopping by and visiting my blog,
Stock Picks Bob's Advice. As always, please remember that I am an amateur investor so please consult with your professional investment advisors prior to making any investment decisions based on information on this website.
I was away from my computer last week, and this weekend, I realized that two of my stocks had actually hit sell points in spite of the relatively weak market overall, and this morning I sold 1/4 positions of each of these.
Cantel Medical (CMN) was acquired 6/4/04 with a cost basis of $13.36/share. I have already sold portions on 7/8/04, 12/20/04, and 2/3/05. (30%, 60%, 90% targets.) Earlier today, I sold 50 shares of CMN at $29.60 for a gain of $16.24 or 121.6%, for my fourth sale target (120% gain). This was a 1/4 position of my remaining 200 shares, and thus I now have 150 shares of Cantel. My next sale target on the upside would be at a 180% gain, or on the downside, allowing it to retrace 50% back to a 60% gain level.
The other partial position that was sold at a gain this morning was Ventana Medical Systems (VMSI). I acquired Ventana shares 4/16/04 for a cost basis of $23.47/share. I sold my first shares 11.29/04, at approximately a 30% gain, and now with VMSI trading this morning at $38.00, I sold 1/4 of my remaining shares (75 out of 300), for a gain of $14.53 or 61.9%, for my second targeted sale. My next sale will be at a 90% gain on the upside, or allowing it to retrace to a 30% gain on the downside.
Having sold two partial positions on good news (gains) this "entitles" me to add two new positions if any are appropriate for the portfolio. If a stock is sold at a loss...or two...prior to making these purchases, these will "cancel out" the buy signals....I hope you follow.
Thanks again for stopping by! If I make a purchase, I will keep you posted. If you have any questions or comments, please feel free to email me at bobsadviceforstocks@lycos.com.
Bob
Newer | Latest | Older


