Stock Picks Bob's Advice
Monday, 24 December 2007
Synchronoss (SNCR) "Trading Transparency"
Hello Friends! Thanks so much for stopping by and visiting my blog, Stock Picks Bob's Advice! As always, please remember that I am an amateur investor, so please consult with your professional investment advisers prior to making any investment decisions based on information on this website.
A few moments ago I sold my last 200 shares of Synchronoss (SNCR) at $37.54. These shares were purchased as a 'trade' and I wanted to clear them out so that I could get back to my usual portfolio management strategy. (In addition, without these shares I can, in my own mind, make another trade as well!) These shares were just purchased 12/20/07 at a cost basis of $35.96, so I had a gain of $1.58 or 4.4% since purchase.
Regardless of my own sale which has nothing to do with my overall opinion on this stock,
SYNCHRONOSS (SNCR) IS RATED A BUY
Just keeping you posted. I don't know if I should or shouldn't be dabbling in these trades, but since my overall performance has been very solid this year, I am willing to put my toes in the water in this very volatile and very risky activity! Thanks for visiting and wishing you all a very Happy Holiday Season!
Bob
Sunday, 23 December 2007
"Profiling"--Identifying Stocks With Potential
So many of my entries are about individual stocks. And yet for the casual reader I am sure the question is 'Why did you pick that stock?'
For me the answer is about profiling.
I borrowed this diagram from Leatherhead Food International:
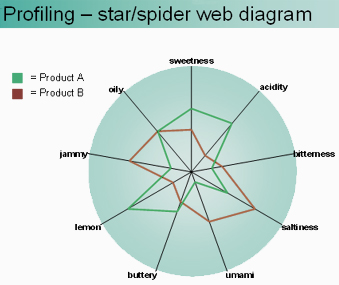
Leatherhead is interested in evaluating new food products.
I am interested in evaluating new stocks.
So instead of "oily" or "buttery" or "bitterness", think about "earnings", "Morningstar", "Valuation", "chart", and other characteristics that we investigate.
I am a very strong believer that earnings drive stock prices. I have seen this over and over and we can match downturns to financial results to downturns in the price of an equity. And with reversals of those same fortunes, comes reversals of stock prices.
But I do not believe in any particular magic about any particular stock. Good management drives results. Of course a great stock should have a great product or service. But it is the financial results, the growth in earnings, the increasing dividend, the stable shares, and solid balance sheet that provides the fuel for the engine of stock appreciation.
When I blog, I am very repetitious. I hope I am not boring anyone. But I am going through my own list of essential characteristics. Much like a packing list on a voyage, I check-off each of the needed things I am searching for in an investment.
So as you read through my stocks, and there are many on this blog, keep thinking about the profiling effort that I am utilizing.
Sometimes I talk about finding the next Fastenal (FAST), a local stock that is a favorite in this area. But I don't know what shape or form the next great investment will take. I am on a great search. In fact, a never-ending exploration of investing that changes with each quarterly report and each session of trading.
I hope that this helps all of you understand what I am doing. I know it helps me. Thanks to all of you readers who regularly stop by, and for those who are new--welcome and stay awhile. There is a lot of content on this website and I believe that even if I am an amateur, there is good stuff in those webpages.
Merry Christmas and Happy Holidays to all of my great friends on and off-line.
Bob Freedland
Posted by bobsadviceforstocks at 11:00 PM CST
|
Post Comment |
Permalink
Updated: Monday, 24 December 2007 4:31 PM CST
IHS Inc (IHS) "Weekend Trading Portfolio Analysis"

Hello Friends! Thanks so much for stopping by and visiting my blog, Stock Picks Bob's Advice! As always, please remember that I am an amateur investor, so please remember to consult with your professional investment advisers prior to making any investment decisions based on information on this website.
As part of my continued effort at transparency on this website, I have been reviewing my actual holdings in my Trading Account approximately every three weekends. Currently with 13 positions, this will take me about 39 weeks to complete the cycle. Three weeks ago I reviewed Harris Corporation. Going alphabetically (by symbol) brings me up to IHS Corp (IHS). Let's take a closer look at this stock and see whether it still deserves a spot on my blog and in my own investment portfolio.
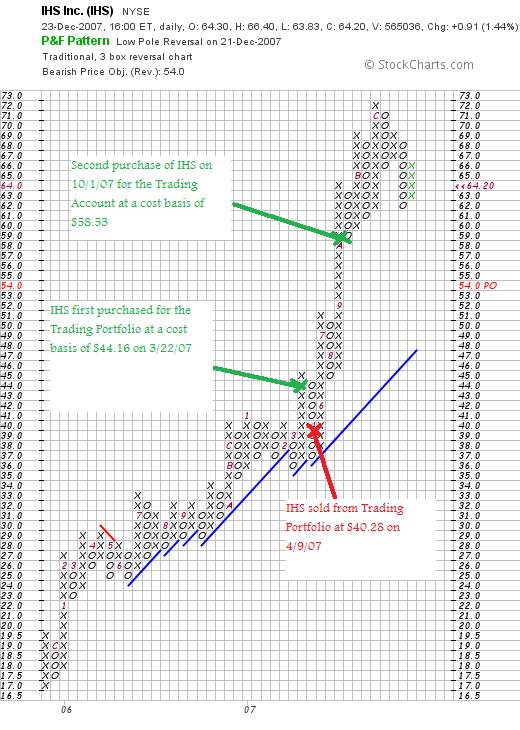
 Currently I own 140 shares of IHS which closed at $64.20 on December 21, 2007. These shares were acquired 10/1/07 with a cost basis of $58.53, giving me an unrealized gain of $5.67 or 9.7% since purchase. This is actually the second time that I have owned IHS. I purchased shares 3/22/07, only to see them decline to a sale point 4/9/07 at which time those shares were sold resulting in a $(465.98) loss in a couple of weeks time.
I am occasionally asked about whether I will 'revisit' a stock after having solid it at a loss. I think that IHS demonstrates that I do keep these stocks on my investing 'horizon' even if they are sold on what I would call a 'technical' basis. I first discussed IHS on this blog on March 24, 2007, when the stock was trading at $42.10.
What exactly does this company do?
According to the Yahoo "Profile" on IHS, the company
"...provides technical information, decision-support tools, and related services to customers in the energy, defense, aerospace, construction, electronics, and automotive industries worldwide. It operates in two segments: Energy and Engineering. The Energy segment develops and delivers oil and gas industry data on exploration, development, production, and transportation activities to energy producers and oil companies. It also provides decision-support tools and operational, research, and strategic advisory services to these customers, as well as to utilities and transportation, petrochemical, coal, and power companies. The Engineering segment provides solutions, such as technical specifications and standards, regulations, parts data, design guides, and other information to customers in its targeted industries. This segment serves defense, aerospace, construction, energy, electronics, and automotive industries. The company' customers range includes governments, multinational corporations, smaller companies, and technical professionals."
How did they do in the latest quarter?
On September 20, 2007, IHS reported 3rd quarter 2007 results. Revenue for the quarter ended August 31, 2007, came in at $183.4 million, up 31% over the 3rd quarter 2006 results of $139.9 million. Net income increased similarly to $21.7 million from $16.1 million and earnings grew 25% to $.35/share from $.28/diluted share last year.
How about longer-term results?
Examining the Morningstar.com "5-Yr Restated" financials on IHS, we can see the steady revenue growth from $339 million in 2002 to $551 million in 2006 and $639 million in the TTM. Earnings have been a bit more erratic with results climbing to $1.11/share in 2004 before dipping to $.75/share in 2005, but resuming the climb to $.99/share in 2006 and $1.22/share in the TTM. No dividends are paid. Outstanding shares are stable with 69 million in 2003 increasing only slightly to 71 million in the TTM.
Free cash flow is positive and growing with $63 million in 2004 and $105 million in 2006 and $101 million in the TTM.
The balance sheet is just adequate with $132 million in cash and $221 million in other current assets compared to the current liabilities of $350.9 million. This works out to a current ratio of 1.01. I would prefer to see companies with more current assets and ratios of at least 1.25. There are $86.2 million in long-term liabilities as well.
What about some valuation numbers?
Looking at Yahoo "Key Statistics" on IHS, we can see that this company is a mid cap stock with a market capitalization of $4.02 billion. The trailing p/e is rich at 52.28 with a forward p/e of 33.61 (fye 30-Nov-08). According to Yahoo, the p/e is not justified in terms of anticipated growth as the PEG ratio (5 yr expected) comes in a bit rich at 1.90.
This richness in valuation is reflected as well, using Fidelity information, by the Price/Sales ratio which is 5.99 is well above the industry average of 2.40. In terms of profitability, as measured by the Return on Equity (TTM) statistic, we find that IHS does a little better with a statistic of 11.38 vs. the industry average of 8.73%.
Yahoo reports 62.65 million shares outstanding with 58.13 million shares that float. There are 2.02 million shares out short as of 11/9/07. This is moderately significant as it totals 7 trading days of volume (the short ratio) to cover. No stock dividends are reported on Yahoo and no cash dividends have been paid.
What does the chart look like?
Examining the "point & figure" chart from StockCharts.com on IHS, we can see that this stock has steadily appreciated from November, 2005, when the stock was trading at $17 to a peak of $72/share in December, 2006. The stock has pulled back somewhat but overall the sharp and steady ascent appears intact.
When would I sell these shares?
With a cost basis of $58.53, and not having sold any shares of this lot yet, I would sell all my shares should the stock decline to an 8% loss which works out to .92 x $58.53 = $53.85. On the upside, my plan is to sell 1/7th of my shares or 20 shares at the 30% appreciation target. This works out to 1.3 x $58.53 = $76.09.
Summary: What do I think about IHS?
I like IHS and continue to own the stock. That being said, I have concerned about the p/e in the 50's, a PEG over 1.5, and a price/sales ratio double the stock in its industry. I do not see any analysts on this stock and don't know whether the latest quarter was above or below 'street' expectations. The graph shows upward price momentum but appears to be a bit over-extended. In addition, the balance sheet shows relatively heavy current debt loads with a current ratio barely over 1.0.
Thus,
IHS (IHS) IS RATED A HOLD
Thanks again for stopping by and visiting. If you have any comments or questions, please feel free to leave them on the blog or email me at bobsadviceforstocks@lycos.com. If you get a chance, be sure and visit my Covestor Page, my SocialPicks Page, and my Podcast Website.
Have a great shortened week and wishing all of my friends a very Merry Christmas and a wonderful New Year!
Bob
"Looking Back One Year" A review of stock picks from the week of June 19, 2006

Hello Friends! Thanks so much for stopping by and visiting my blog, Stock Picks Bob's Advice! As always, please remember that I am an amateur investor, so please remember to consult with your professional investment advisers prior to making any investment decisions based on information on this website.
It is the weekend. And almost Christmas. We have lots of snow outside and I am sure some travelers are having a bit of trouble getting where they need to get. As for me, I am staying put for the duration. But I do have a bit of time to take a look at the week of June 16, 2006, when actually I only picked a single stock for this blog.
These weekend reviews assume a buy and hold approach to investing. That means it assumes that an investor purchases the stock and holds it for the long-term regardless of the price changes. In reality, I advocate and practice a much more disciplined approach (except when I buy a stock for what I call a 'trade'). That means buying stocks based on investment signals and selling them either on declines or appreciation when they reach their appropriate targeted prices. But for the ease of analysis, I utilize this buy and hold approach each weekend to evaluate stock picks. The difference in these strategies would certainly affect stock portfolio performance.
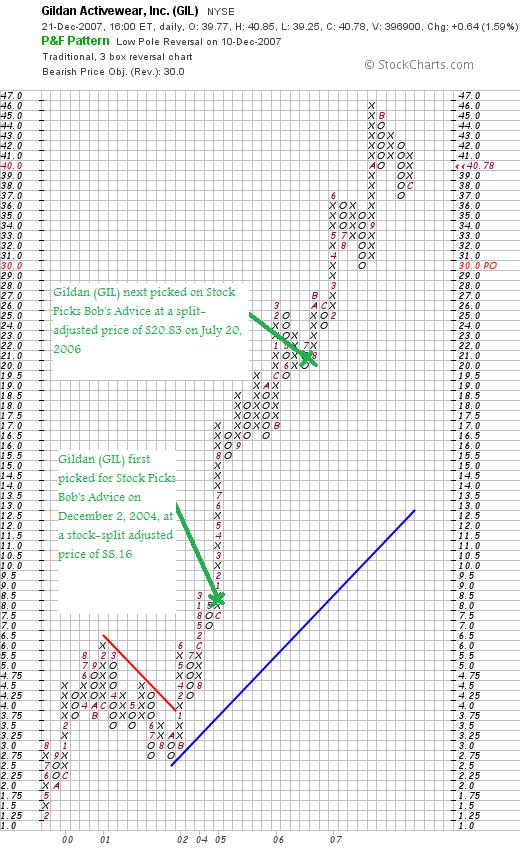
 On July 20, 2006, I posted Gildan (GIL) on Stock Picks Bob's Advice when the stock was trading at $41.65. Adjusted for a 2:1 stock split May 29, 2007, this works out to a price of $20.83.
My 2006 post was actually the second time I have looked at Gilda--I first 'picked' Gildan for the blog on December 2, 2004, when the stock was trading at $32.65, adjusted for a 2:1 stock split June 1, 2005, and the 2:1 stock split on May 29, 2007, this works out to an effective 'pick price' of $32.65 x 1/2 x 1/2 = $8.16.
Gildan (GIL) closed at $40.78 on December 21, 2007, for an appreciation of $19.95 or 95.8% since posting last year. Looking at that 2004 pick, the appreciation to date is $32.62 or 399.8% since posting. I do not currently own any shares or options on this stock.
Let's take a closer look at this stock and see if it still deserves a spot on this blog!
What exactly does this company do?
According to the Yahoo "Profile" on Gildan (GIL), the company
 "...engages in the manufacture and sale of activewear for the wholesale imprinted sportswear markets in the United States, Canada, and Europe. The company also sells socks, and men's and boys' underwear, as well as frequently replenished and non-fashion apparel. It primarily offers activewear, including t-shirts, fleece, and sport shirts under the Gildan brand name to wholesale distributors as undecorated, which are subsequently decorated by screen printers with designs and logos."
How did they do in the latest quarter?
On December 6, 2007, Gildan (GIL) announced 4th quarter 2007 results. For the quarter ended December 30, 2007, sales came in at $254.9 million (U.S.), up 8.4% from $235.2 million in the same quarter last year. Adjusted net earnings came in at $45.8 million up 24.5% from $36.8 million or $.38/diluted share, up 26.7% from $.30/diluted share last year.
The company matched estimates of analysts. The company announced guidance below current estimates for the 1st quarter and year 2008. They predicted earnings of $.21/share in the first year (analysts were looking for $.24/share) and full 2008 fiscal year results of $1.85/share (analysts predict profits of $1.93 for the year). Thus, even with the strong quarterly report, the announcement lowered expectations for 2008. As you know, I prefer to see a company announce strong earnings that beat expectations and then raise guidance.
What about longer-term results?
Reviewing the Morningstar.com "5-Yr Restated" financials page on GIL, we can see that the company continues to report steady revenue growth, steady earnings growth, no dividend, stable outstanding shares, positive and growing free cash flow, and a solid balance sheet.
What about some valuation numbers?
Checking the Yahoo "Key Statistics" on GIL, we see that the company is a mid cap stock with a market capitalization of $4.91 billion. The trailing p/e is moderately high at 38.11, but the forward p/e (fye 30-Sep-09) is 17.28, and estimates for growth continue strong enough for a PEG (5 yr expected) to be calculated at 0.65.
According to the Fidelity.com eresearch website, valuation is a bit rich as measure by the Price/Sales ratio (TTM) which for GIL comes in at 5.09, with an industry average of 3.25. Also, measuring profitability by the Return on Equity (TTM), according to Fidelity, the company comes in a tad shy of the average at 21.66%, with an industry average reported to be 22.15%.
Finishing up with Yahoo, there are 120.43 million shares outstanding with 109.21 million that float. As of 11/9/07, there were 2.61 million shares out short, representing 4.7 trading days of volume (the short ratio). This is a bit heavy of a short interest (at least according to my own '3 day rule'). If he company should repor posiive results this may result in a bit of a squeeze on the shorts.
No dividends are paid and as already noted the last stock split was a 2:1 stock split May 29, 2007.
What does the chart look like?
Looking at the "Point & Figure" chart on Gildan from StockCharts.com, we can see a phenomenally strong chart, which after a slight dip to $2.75/share in September, 2001, the stock has been 'on a tear' moving sharply higher well above support levels without any recent correction.
Summary: What do I think?
First of all this has been an absolutely terrific stock pick for this blog. And unfortunately you will not find it in my trading portfolio today. This only stock pick for the week showed a 95.8% appreciation. Not too shabby at all.
Let's review some of the findings on this blog. First of all, the company reported a terrific quarter. However, they cut guidance slightly on the quarter and the year upcoming. The Morningstar.com report is solid. Valuation-wise, the p/e is a bit rich but the PEG is reported under 1.0. The price/sales is also a bit rich and profitability is just under average for its industry. Finally, the chart is solid with a very strong upward pattern going all the way back to late 2001. However, the stock price does appear to be a tad overextended.
I really like this company. It deserves a spot in the blog. But with the above cautions noted,
GILDAN (GIL) IS RATED A HOLD
Thanks so much for stopping by and visiting! If you have any comments or questions, please feel free to leave them on the blog or email me at bobsadviceforstocks@lycos.com.
Feel free to visit my related websites, including my Covestor Page where my actual trading portfolio is tracked independently of my reporting, my SocialPicks page where my stock picks are reviewed and monitored, my Podcast Website, where I have been recording a few 'radio shows' (in a very amateur fashion) and discussing some of the various stock picks from my blog.
If you are interested in a possibly higher risk venture, I have been investing some funds over at Prosper.com where person-to-person lending in a sort of Dutch Auction, eBay style consortium fashion occurs. That is, you can invest money, usually small amounts, and become part of a larger group of lenders who lend 36 month unsecured loans to individuals with Prosper.com serving as a intermediary. Please be very careful if you participate, do your homework, be aware of the risks, consider sticking with conservative, higher-rated individuals, and good-luck. But it is a fascinating venture and I am intrigued. (Full Disclosure: if you sign up with Prosper.com through these links, we will both earn $25 if you place a loan).
Have a wonderful Christmas and a very happy and healthy New Year! Let's hope 2008 brings us peace, good health, and profits :).
Bob
Friday, 21 December 2007
Matrix Service Co (MTRX)
Hello Friends! Thanks so much for stopping by and visiting my blog, Stock Picks Bob's Advice! As always, please remember that I am an amateur investor, so please remember to consult with your professional investment advisers prior to making any investment decisions based on information on this website.
 I have been spending some time discussing my various trades on this blog and I wanted to see if I could post a stock this afternoon that I don't own yet I still believe deserves a spot on this website.
MATRIX SERVICE COMPANY (MTRX) IS RATED A BUY
There are certainly many different ways to select a stock for a possible purchase. Using Matrix Service (MTRX) as an example, let me once again go through the process that I use to identify possible 'winners' in the stock market.
My first screening device is to utilize the lists of top % gainers. I probably most often screen through the list of gainers on the NASDAQ, but l also will check the NYSE list and the AMEX list as well.
You might ask 'why use this list of all things?' I don't have a very good answer, but it has been my experience that stocks that show up on these top % gainers list, if they have good underlying fundamentals may well be on the way to additional gains.
Anyhow, checking the list of top % gainers today on the NASDAQ, I came across Matrix Service Co (MTRX) which closed today at $24.40, up $3.00 or 14.02% on the day. I do not own any shares of MTRX nor do I have any options.
What exactly does this company do?
According to the Yahoo "Profile" on MTRX, the company

"...together with its subsidiaries, provides construction, and repair and maintenance services primarily to the downstream petroleum and power industries in the United States and Canada. Its construction services include turnkey construction, civil construction, structural steel erection, mechanical installation, process piping, electrical and instrumentation, fabrication, vessel and boiler erection, millwrighting, plant modifications, centerline turbine erection, and startup and commissioning. The company also offers design, engineering, fabrication, and construction of aboveground storage tanks. Matrix Service Company provides its construction services to the downstream petroleum market, which includes refineries, pipelines, terminals, petrochemical plants, gas facilities, and bulk storage facilities."
I don't need to remind any of my readers of the recent ascent of the price of oil which closed at $93.31, up $2.25 on the day today. Intuitively and thus with a sort of Peter Lynch investing approach, I believe that stocks like MTRX that are dependent on investment in refining, storage, and transportation of petroleum products will benefit from the higher price of oil. Even while all of us consumers have to pay at the pump :(.
At this stage of my 'selection process' I have merely identified a stock that has moved higher today and has an interesting business. But that isn't even close to fulfilling all of my criteria, what I call my 'profile' of an 'investable stock'.
My next step is to examine the fundamentals of the company involved. I want to find out how the company did in the latest quarter and if that successful performance has been a continuation of similar financial performance in the past. This is more or less my search for a company with persistence of good results.
How did Matrix do in the latest quarter?
Generally, I am looking for a company with growing earnings, growing revenue, that can possibly beat expectations and raise guidance. That's a lot to ask out of a report. I don't always get it all, but let's see how MTRX did in their latest reported earnings report which was a first quarter 2008 report anounced on October 4, 2007.
In this 1st quarter report, for the quarter ended August 31, 2007 (please note that a company can set its financial year to any month. Many do use the calendar year, but this company obviously starts midway on June 1st for its fiscal year.), the company reported that revenue climbed 27.1% to $161.3 million from $126.9 million in the same quarter last year. Net income came in at $6.3 million, up over 100% from last year's $3.0 million. Fully diluted earnings per share came in at $.23/share up nearly 100% from last year's $.12/share result. These results were to say the least very strong.
As this separate AP Story notes, the company came in at $.23/share for the quarter, and analysts expected $.19/share, thus they did indeed beat expectations. The company, instead of raising guidance, reiterated guidance of $700 to $750 million in revenue for 2008. Still a strong result.
So Matrix had a great latest quarter. But that still is not enough for me.
What has been the longer-term results for this company?
I have found the Morningstar.com "5-Yr Restated" page the most helpful for evaluation of 'persistence' of results. For Matrix, as we often find with relatively small companies, results are slightly erratic, but overall the trend is clear. The company is growing and improving its performance steadily.
Revenue, which jumped from $288.4 million in 2003 to $607.9 million in 2004, otherwise has grown steadily to $639.9 million in 2007 and $674.3 million in the trailing twelve months (TTM).
Earnings have also been a bit erratic, declining from $.37/share in 2002 to $.25/share in 2003 before jumping to $.54/share in 2004. But earnings dipped to $(2.24)/share in 2005, before once again turning profitable at $.35/share in 2006 and $.81/share in the TTM.
I prefer to see stable or declining shares in general, but growth in outstanding shares is acceptable if the company has been otherwise growing its revenue and earnings even faster. In this case outstanding shares have increased from 15 million in 2002 to 20 million in 2006 and 24 million in the TTM. This 60% increase in the float has been accompanied by an almost 400% increase in revenue and an approximately 125% increase in earnings. From my perspective, this is acceptable.
On this page, I also review the free cash flow. This is the amount of cash that is being 'created' by the enterprise. During the tech bubble of the 1990's, it was common to discuss the 'burn rate' of companies, estimating the rate of consumption of available cash before all of the money was used up. In my perfect world of perfect companies :), I would prefer to see positive and growing free cash flow. At a minimum, I insist on positive free cash flow by itself. In the case of MTRX, the cash flow has improved from a negative $(33) million to $3 million in 2005, $30 million in 2006 and $4 million in the TTM.
Finally, when examining this Morningstar.com page, I want to at least briefly examine the balance sheet. I do not pretend to be an expert at this or anything else I have discussed. But this is the process I use to identify my stock picks. Again, keeping it simple, I am looking for stocks that have more assets than liabilities. Now that wasn't too hard was it?
More precisely, I want to find stocks that have more current assets than current liabilities, and possibly more current assets than total liabilities which is the combination of current and long-term liabilities combined. Think of current and long-term as descriptors explaining whether the cash amount in consideration is either available easily in the next twelve months or needs to be paid in the same period of a year.
The comparison of the total current assets to the total current liabilities is called the current ratio. Different authorities have different criteria of identifying what is 'good' or not in this ratio. Generally I have kept to a cut-off of about 1.25 for a 'good' current ratio. Higher ratios are even more financially 'healthy' from my perspective.
In the case of MTRX, Morningstar.com reports them with $7 million in cash and $140.6 million in other current assets. This level of current assets is actually enough to pay off both the $94.1 million in current liabilities and the $21.6 million in long-term liabilities combined. Calculating the Current ratio we have $147.6/$94.1 million = 1.57. A completely adequate level of assets to liabilities from my perspective.
Working through this process, I like to examine some valuation numbers. That is what kind of a value stock does this investment represent?
What about some valuation numbers for this stock?
I once again turn to Yahoo for these numbers. In particular, I utilize the Yahoo Key Statistics which for Matrix is here. Some of the numbers I like to examine include the 'size' of the company in terms of market capitalization. In particular, Matrix is a small cap stock with a market cap of only $649.04 million.
The trailing p/e is reasonable from my perspective at 28.57. Based on estimates, the forward p/e even looks nicer at 16.94. There aren't enough analysts out there making predictions about earnings results long-term to help us determine the PEG ratio (5-yr expected). But certainly, if anything like the current growth rate in earnings continues, this should be well under 1.0.
The Price/Sales ratio is another nice way of looking at a stock. According to the Fidelity.com eresearch website, MTRX is an outstanding value with a Price/Sales (TTM) ratio of only 0.78 compared to the industry average of 3.40. However, according to Fidelity, at least as measured by the Return on Equity (TTM) ratio, Matrix doesn't do quite as well with a ROE (TTM) of 19.51% compared to the industry average of 28.97%.
Finally, returning to Yahoo, we can see that there are only 26.60 million shares outstanding with 26.41 million that float. As of 11/27/07, there were 1.58 million shares out short representing 6% of the float or 4.9 trading days of volume. This days of trading volume is known as the 'short ratio". I have chosen to use 3 days of short interest as my cut-off for significance. I suspect that interest much more than three days may have the potential for a short squeeze which could propel a stock even higher. In the case of Matrix, the short ratio is 4.9 days of volume. A plus in my humble opinion.
Finally, the company doesn't pay any dividends and the last stock split was a 2:1 split in November, 2003.
What about the stock chart?
I am certainly an amateur (if not less) at looking at stock charts. The analysis of stock charting patterns is known as Technical Analysis. Over the last several years, after being presented with "Point & Figure" charts at my stock club by a local broker, I have learned to appreciate these columns of x's and o's.
But on a much more simple level, I am looking for a stock chart which shows that the price has been steadily increasing or at least appears to be doing so in the intermediate past to the present.
Looking at the 'Point & Figure' chart on MTRX from StockCharts.com, we can see that the stock took a steep drop from $20/share in January, 2004, to a low of $3.25 in April, 2005. Since that date, the stock price has steadily increased to as high as $30 in November, 2007, before dipping to $21 and now once again moving higher to the $24.40 level. The chart looks encouraging to me for at least the last year-and-a-half. Recall the dip in revenue and earnings results that ocurred in 2005 and you will understand my strong belief in the close association between financial results and technical performance.

Summary: What do I think?
Needless to say I like this stock (or of course I wouldn't be posting it!). Briefly, they moved strongly higher today, reported very strong results last quarter which beat expectations, have a record of reporting strong results (except for a dip in 2005) with reasonable expansion of outstanding shares, positive free cash flow and a solid balance sheet.
Valuation-wise, the p/e is moderate with a presumed PEG of under 1.0 (my own estimate), a Price/Sales ratio low for its group, but a Return on Equity also a bit under average. There are plenty of shares out short, and the chart looks strong.
Unfortunately, I don't have a signal to be buying anything. (And I already own one stock, SNCR, for a 'trade'). But if I were buying a stock today, this is definitely the kind of stock I would be purchasing.
Thanks again for visiting my blog. I hope my explanations today weren't too lengthy. I want to always make my entries accessable to the most amateur investors like myself who are continuing to try to grasp the nuances of investing.
If you get a chance, be sure and stop by my Covestor Page where my trading portfolio is reviewed, my SocialPicks page where all of my stock picks from the past year are reviewed, and my Podcast Site where you can download mp3's of me discussing some of the same stocks I write about here on the website. Of course, if you have any comments or questions, please feel free to leave them on the blog or email me at bobsadviceforstocks@lycos.com.
Have a great weekend and a very Merry Christmas next week!
Bob
Synchronoss Technologies (SNCR) "Trading Transparency'
Hello Friends! Thanks so much for stopping by and visiting my blog, Stock Picks Bob's Advice! As always, please remember that I am an amateur investor, so please remember to consult with your professional investment advisers prior to making any investment decisions based on my information on this website.
Yesterday I made an 'oversized' purchase of shares in Synchronoss Technologies (SNCR) as a 'trade'. This morning, with the market up strongly, I undid 2/3 of that position, selling 400 of my 600 shares at $37.77. These shares were purchased yesterday (12/20/07) with a cost basis of $35.98. Thus I had a gain of $1.79 or 5% on this purchase. Since I still like the numbers and the stock in general,
SYNCHRONOSS TECHNOLOGIES (SNCR) IS RATED A BUY
Since I generally like this company and the stock is acting well, I didn't sell my entire position and still have 200 remaining shares in my trading account. I am extremely novice (even more amateur than my 'disciplined' trading strategy approach) at these short-term trades and am feeling my way through these. Overall, I have had as many flops as successes with my "trades" and do not claim any expertise at all at this process.
I wanted to update all of you on this as I always want to share with you what and why I am doing. I look forward to hearing some of your comments either here on the blog or email me at bobsadviceforstocks@lycos.com if you have any comments or questions.
Meanwhile, be sure and stop by and visit my Covestor page where my overall trading account continues to be analyzed, my SocialPicks Page where my stock picks are reviewed and my Podcast Page where you can downloan an mp3 of me discussing some of the various stocks and my thinking behind their selection and portfolio management strategies. You might also hear me read a poem :).
Have a great afternoon and a wonderful Christmas and New Year Holiday!
Bob
Thursday, 20 December 2007
Synchronoss Technologies (SNCR) "Trading Transparency"
Hello Friends! Thanks so much for stopping by and visiting my blog, Stock Picks Bob's Advice! As always, please remember that I am an amateur investor, so please remember to consult with your professional investment advisers prior to making any investment decisions based on information on this website.
I wanted to update all of you about my latest 'trade' in my investment account. While the bulk of my portfolio remains as what I refer to as a 'disciplined investment strategy' approach, I continue to reserve the right to dabble in what I would call ultra-short-term trades. I am utilizing essentially the same screening criteria to identify these stocks and am trying to learn about what works and what doesn't. (I am certainly getting experience in 'what doesn't' lately!)
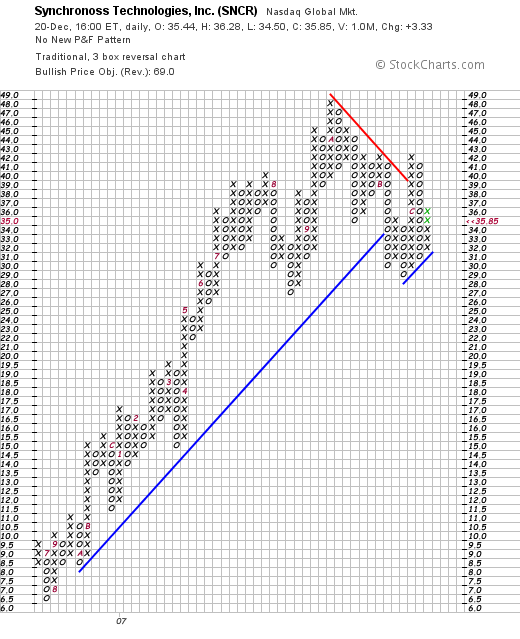
Anyhow, checking the list of top % gainers on the NASDAQ I came across Synchronoss Technologies (SNCR) trading at $36.23 up $3.71 or 11.41% as I write. A few moments ago I purchased 600 shares of SNCR at a cost of $35.96. Let me explain this, and explain why
SYNCHRONOSS TECHNOLOGIES (SNCR) IS RATED A BUY
First of all the stock is showing strong daily momentum today. Looking at some fundamentals, the last quarter was exceptionally strong with revenue increasing 82% year-over year, and 10% sequentially. Net income was also up sharply coming in at $8 million vs. a little over $3 million last year. On a per share basis this was $.25/share up from $.10/share last year.
Longer-term, the Morningstar.com '5-Yr Restated' financials page is also quite strong. The only noticeable blemish was a slight dip in earnings last year which has been more than made up with the recent reports. Also, the company has been increasing its shares outstanding, but revenue and earnings growth far exceeds this dilution.
Finally, the chart from StockCharts.com is quite strong, although recently the stock has pulled back from highs near $49 in October, 2007, and dipped as low as $29 in November, 2007. Most recently, the stock has broken through resistance and appears to be moving higher once more.
Anyhow, I sensed the market firming after earlier weakness this morning and appeared to want to race into the close. I thought I would hop on with this stock which is worthy of consideration in its own right.
Thanks so much for dropping by! If you have any comments or questions, please feel free to leave them on the blog or email me at bobsadviceforstocks@lycos.com. Have a great weekend everyone and a Merry Christmas to all of my friends from this amateur investor in Wisconsin. May Santa bring you everything you have asked for; and may 2008 bring you everything you need and not necessarily everything you want.
Bob
Monday, 17 December 2007
Movado Group (MOV) "Trading Transparency"
Hello Friends! Thanks so much for stopping by and visiting my blog, Stock Picks Bob's Advice! As always, please remember that I am an amateur investor, so please remember to consult with your professional investment advisers prior to making any investment decisions based on information on this website.
Earlier today, in the midst of the continued market correction, my recent purchase of Movado (MOV) was 'undone' and I sold my 210 shares of MOV at an average price of $29.57. I had literally purchased these shares just days ago on 12/11/07 at a cost basis of $32.14. Thus, I had a loss of $(2.57) or (8.0)% since purchase. The 8% level is the loss point which triggers a sale (I use a 'mental stop' and do all of this manually) of a stock after an initial purchase. It doesn't really matter to me how long I have held a stock, how much I like this stock, and whether I think it is the stock market, the stock itself, manipulation in trading, or the price of tea in China. A signal is a signal and out it went.
Furthermore, with a sale on 'bad news' like this, I do not have permission to add a new position to replace Movado. I have to 'sit on my hands' and stay at what now amounts to a portfolio level of 12 positions (below my maximum of 20 and above my minimum of 5). I shall be waiting for some 'good news', whenever that may come, to add a new position. By this means, my portfolio moves in a more-or-less 'automatic' fashion towards cash and away from equities as the bear growls on Wall Street!
With my own sale of Movado, I am reducing my rating:
MOVADO (MOV) IS RATED A HOLD
Thanks so much for stopping by and visiting! I wish I had something more encouraging to greet you with than another gloomy sale. But investing is both about making money in a bull market and preserving your assets during corrections. I work at both of these and shall share with you the results of my efforts---whether they be successful or less than stellar.
If you have any comments or questions, please feel free to leave them on the blog or email me at bobsadviceforstocks@lycos.com. If you get a chance, be sure and visit my Covestor Page where all of my transactions are reviewed from my actual trading account, my SocialPicks Page where my stock picks are analyzed from the blog, and my Podcast Page where you can download an mp3 of me discussing one of the many stocks reviewed on this website.
Wishing you all a successful and happy week trading and investing!
Bob
Sunday, 16 December 2007
A Reader Writes "...write something about margin?"
Hello Friends! Thanks so much for stopping by and visiting my blog, Stock Picks Bob's Advice! As always, please remember that I am an amateur investor, so please remember to consult with your professional investment advisers prior to making any investment decisions based on information on this website.

One of my favorite parts of blogging is to receive comments and emails from readers who range from the novice to the expert. I often learn as much from their questions as they might hope to learn from what I write! If you have any comments or questions, please feel free to leave them on the blog or email me at bobsadviceforstocks@lycos.com.
Recently, Thierry, an avid reader, wrote me a note:
"hello Bob
always a pleasure to read your comments
i wanted to ask you if you can write something about margin
how much are you charged when you are on margin ???????
is it better to try to trade a stock who give you dividends when you are on margin , to try to lower the cost of the margin ?????
sorry for my english ....i am better in french
have a good day
thierry
ps: i did not succeed at leaving a comment ...it does not work , or maybe i do not know how to use it .."
Let me see if I can address Thierry's questions and add anything to the question about margin.
To answer your question, my current margin interest rate (12/14/07) is 9.075% in my Fidelity account. However, margin interest levels on Fidelity vary according to the amount of margin debt in the account. For instance, if your margin or borrowed amount totals $100,000 to $499,999, the rate is currently listed at 8.075%. If you have much less margin (as I do) the rate for a margin balance of $0-$9,999 is currently at 10.075%.. I am also sure that these rates may well vary between brokerage houses.
Your question about dividends is astute. All things being equal it is indeed better to have a stock that pays a dividend to offset the interest charges being accrued by being on margin. But even more important is the wisdom of buying a stock that will appreciate more than the next stock, regardless of dividend status. So in reality, the dividend issue is simply not as important as the price performance of the underlying stock itself.
While I have utilized margin in my own accounts, my goal remains to eliminate this debt which only magnifies the volatility of my own account.
A good explanation of margin comes from the SEC itself in this
website:
"Let's say you buy a stock for $50 and the price of the stock rises to $75. If you bought the stock in a cash account and paid for it in full, you'll earn a 50 percent return on your investment. But if you bought the stock on margin – paying $25 in cash and borrowing $25 from your broker – you'll earn a 100 percent return on the money you invested. Of course, you'll still owe your firm $25 plus interest.
The downside to using margin is that if the stock price decreases, substantial losses can mount quickly. For example, let's say the stock you bought for $50 falls to $25. If you fully paid for the stock, you'll lose 50 percent of your money. But if you bought on margin, you'll lose 100 percent, and you still must come up with the interest you owe on the loan.
In volatile markets, investors who put up an initial margin payment for a stock may, from time to time, be required to provide additional cash if the price of the stock falls. Some investors have been shocked to find out that the brokerage firm has the right to sell their securities that were bought on margin – without any notification and potentially at a substantial loss to the investor. If your broker sells your stock after the price has plummeted, then you've lost out on the chance to recoup your losses if the market bounces back."
I hope that answers you question! If not, please feel free to leave additional comments/questions. Have a great week trading everyone!
Bob
Posted by bobsadviceforstocks at 1:08 PM CST
|
Post Comment |
Permalink
Updated: Sunday, 16 December 2007 5:29 PM CST
Saturday, 15 December 2007
"Looking Back One Year" A review of stock picks from the week of June 12, 2006
Hello Friends! Thanks so much for stopping by and visiting my blog, Stock Picks Bob's Advice! As always, please remember that I am an amateur investor, so please remember to consult with your professional investment advisers prior to making any investment decisions based on information on this website.
Thank goodness for the weekend! We have certainly had a volatile week or two! We have had so many different forces acting upon the market that it is difficult to know which way to turn. Early in the week we had the American stock market moving higher on the news of the Fed injecting liquidity to ease some of the financial challenges facing the economy. But then later in the week we found ourselves faces with inflation data suggesting that the Fed was indeed caught between a rock and a hard place trying to ease liquidity issues without fueling the fires of inflation.
In the midst of all this, I foolishly thought I could do a few 'day-trades'. I am still learning, and still an amateur :). Fortunately, I had the discipline to quickly close out these trades before they did any significant damage to my account. When I write that I am an amateur investor, I think I have convinced all of you that I am honest!
Anyhow, it is the weekend and no use dwelling on things like that. Let's do what I like to do on the weekend which is to review past stock selections from the blog. I have been going a week ahead at a time from a period about a year-and-a-half ago. (This started out as a year-ago review, but after missing a week here and a week there....well you get the picture!)
Last weekend I took a look at the week of June 5, 2006 here on the blog. Let's move ahead a week and examine the week of June 12, 2006, which, fortunately I did review a stock!
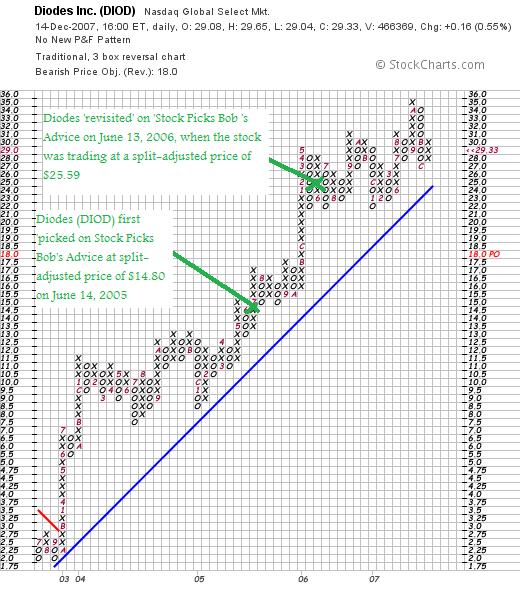
 On June 13, 2006, I posted Diodes (DIOD) on Stock Picks Bob's Advice when the stock was trading at $38.39. This was the second post for me of Diodes, which was first 'picked' on this blog at $33.30/share on June 14, 2005. The stock has split 3:2 on December 1, 2005, and again 3:2 on July 31, 2007, making my first pick in 2005 having an effective pick price of $33.30 x 2/3 x 2/3 = $14.80 and my second pick in June, 2006, having an effective price of $38.39 x 2/3 = $25.59.
Diodes (DIOD) closed at $29.33 on December 14, 2007, representing a gain of $3.74 or 14.6% since my 'pick' last year and a gain of $14.53 or 98.2% since my first 'pick' in 2005. I do not currently own any shares of Diodes (DIOD) nor do I own any options on this stock.
Let's take a closer look at this company and see if it still deserves consideration and a spot on my blog.
DIODES (DIOD) IS RATED A BUY
Since we were discussing the price and appreciation of this stock,
What does the chart look like?
Looking at the "point & figure" chart on DIOD from StockCharts.com, we can see an impressively steady appreciation in this stock from a low of $2.00 in September, 2003, to the recent high at $35 in October, 2007.
What does this company do?
According to the Yahoo "Profile" on DIOD, the company
"...and its subsidiaries engage in the manufacture and distribution of standard semiconductor products to manufacturers in the consumer  electronic, computer, communications, industrial, and automotive markets. Its products include discrete semiconductor products, including performance Schottky rectifiers; performance Schottky diodes; Zener diodes and performance Zener diodes, such as tight tolerance and low operating current types; recovery rectifiers; bridge rectifiers; switching diodes; small signal bipolar transistors; prebiased transistors; MOSFETs; thyristor surge protection devices; and transient voltage suppressors."
How did they do in the latest quarter?
On November 1, 2007, Diodes (DIOD) reported 3rd quarter 2007 results. For the quarter ended September 30, 2007, DIOD reported:
-
- Revenues increased 13.7 percent year-over-year and 9.3 percent sequentially to a record $105.3 million
- Gross profit margin increased 50 basis points sequentially to 32.4 percent
- Net income increased 26.1 percent year-over-year to a record $16.1 million
- Adjusted net income increased to a record $17.1 million, or $0.40 per share, up from $14.2 million, or $0.33 per share on a stock split-adjusted basis, in the third quarter of 2006
This was a solid report! In addition, on December 12, 2007, Diodes raised guidance for the 4th quarter.
What about longer-term results?
Reviewing the Morningstar.com "5-Yr Restated" financials on DIOD, we can see what to me really appears to be a beautiful report. Revenue has steadily increased with $115.8 million reported in 2002 climbing to $343.3 million in 2006 and $388.0 million in the trailing twelve months (TTM). Earnings have increased steadily from $.20/share in 2002 to $1.16/share in 2006 and $1.34/share in the TTM. Total shares are up a bit more than a third during the period in which revenue more than tripled and earnings more than quintupled. This is acceptable.
Free cash flow which was a negative $(5) million in 2004 increased to $28 million in 2005 and $26 million in 2006 and the TTM.
The balance sheet is solid with $45 million in cash and $475 million in other current assets, more than enough to cover both the $83.7 million in current liabilities and the $249.5 million in long-term liabilities. The current ratio works out to approximately 6. (over 1.25 is adquate).
What about valuation?
Looking at the Yahoo "Key Statistics" on DIOD, we see that this is a small cap stock with a market capitalization of $1.18 billion. The trailing p/e is a very reasonable 21.73 with a forward p/e (fye 31-Dec 08) of 16.03. The PEG (5 yr expected) works out to a nice 1.06.
Using the Fidelity.com eresearch website, we can see that this company has a Price/Sales (TTM) of 2.98 compared to the industry average of 4.17. The company is also more 'profitable' than its peers (Fidelity) as measured by the Return on Equity (TTM) ratio which works out to 17.41% for DIOD compared to the industry average of 15.10%.
Finishing up with Yahoo, we can see that there are 40.07 million shares outstanding and the float is 30.62 million. As of 11/27/07, there were 5.88 million shares out short representing 14 trading days of volume or 15.10% of the float. Using my own '3 day rule' for short interest, this appears significant and could be setting the stock up for a short squeeze should good news continue to be announced.
No dividends are paid and as already noted, the last stock split was a 3:2 split on July 31, 2007
Summary: What do I think?
Well, I really like this stock. Perhaps the only possible weakness might be a potential cyclical slowdown in semiconductor stocks, but even this appears remote with the company signalling strong results by raising guidance for the upcoming quarter. Going through some of the things I have just presented, the latest quarter was strong, the longer-term results are gorgeous with steady revenue and earnings growth, positive free cash flow, and a solid balance sheet. Valuation is excellent with a p/e just over 20, a PEG just over 1.0, a Price/Sales ratio low for its industry, and a Return on Equity high for the industry. The chart is gorgeous, and there are lots of naysayers out there who represent a large short interest on the stock.
I don't really like the overall tone of the market. But I like this stock a lot!
Thanks again for visiting my blog! If you have any comments or questions, please feel free to leave them on the blog or email me at bobsadviceforstocks@lycos.com. I cannot respond to every email I receive, but I do read them all and try to respond to comments when posted.
If you get a chance, try to visit some of my related intenet sites: my Covestor Page where Covestor.com reviews my actual trading portfolio and compares it to other investors and how I am doing relative to the S&P; my SocialPicks Page where SocialPicks evaluates my stock picks from the past 12 months, my Podcast Page where I have been podcasting on many of the same stocks I write about on this blog.
Finally, if you are willing to take additional risks and are aware of the potential of loss, check out Prosper.com where if you sign up and initiate a loan both of us receive $25 credit. (Talking about win-win!). But be sure to take into consideration the high risk of loss on non-secured loans, be sure and spread out your loans to reduce that risk, and consider emphasizing higher-rated borrowers in your lending plans. That being said, it is a fascinating website even if you don't end up participating.
I hope you all have a wonderful weekend and a very wonderful Holiday Season. The best gift we can receive is not of the financial type at all. Remember to spend time with family, appreciate your good health if you are fortunate to enjoy good health, and be considerate of others who have less than you--whether it be of the financial or non-material type.
Peace.
Bob
Newer | Latest | Older


