Stock Picks Bob's Advice
Tuesday, 27 March 2012
DXP Enterprises (DXPE)
Hello Friends! Thanks so much for stopping by and visiting my blog, Stock Picks Bob's Advice! As always, please remember that I am an amateur investor, so please remember to consult with your professional investment advisers prior to making any investment decisions based on information on this website.
 This past month I added DXP Enterprises (DXPE) to my Covestor Buy and Hold Model. This stock has shown tremendous technical strength since the purchase on March 16, 2012 at a cost of $42.90. DXPE closed today (3/2712) at $44.47, down $(.68) or (1.51)% on the day.
DXP has been 'strong out of the gate' for me, yet it is not what I would consider a well-known stock. Let's take a closer look at this investment.
According to the Yahoo "Profile" on DXPE, this company
"...engages in distributing maintenance, repair, and operating (MRO) products, equipment, and services to industrial customers in the United States. Its Service Centers segment provides MRO products, equipment and services, including technical design expertise and logistics capabilities to industrial customers with the ability to provide same day delivery. This segment’s product categories comprise rotating equipment, bearing, power transmission, hose, fluid power,  metal working, industrial supply, and safety products; and services consist of field safety supervision, in-house and field repair, and maintenance services. The company’s Supply Chain Services segment manages the supply-chain of its customers from various industries."
and
"DXP Enterprises, Inc. distributes its products and services through service centers and distribution centers to customers in the oil and gas, food and beverage, petrochemical, transportation, mining, construction, chemical, municipal, agriculture, pulp and paper, and other general industrial industries."
On February 29, 2012, DXP Enterprises announced their fourth quarter 2011 results. The company reported net income of $9.2 million or $.61/diluted share for the quarter which represented a sequential increase of 10.9% from the prior quarter when it reported earnings of $.55/share with $8.3 million in net income.
During the prior year 2010 same quarter, the company had $5.9 million of income or $.39/diluted share for a year-over-year increase of 56.4% on a per share basis.
For the full year, the company reported net income of $31.4 million or $2.08/diluted share which was a 57.6% over the prior year's result of net income of $19.4 million and earnings of $1.32/share.
Sales for the fourth quarter 2011 increased 28.7% from $169.7 million in 2010 to $218.4 million in 2011. For the full year,
Sales grew 23.0% to $807 million from $656.2 million the prior year.
These are terrific numbers of growth both for the quarter and the full year. Even more impressive was the fact that the company beat expectations. As Motley Fool reports, expectations for revenue was $209.8 million and the company came in at $218.4 million. In addition, earnings came in at $.61/share ahead of the S&P Capital IQ estimates of $.53/share.
Examining the Morningstar Financials on DXPE, we can see that revenue has grown somewhat unevenly from $445 million in 2007 to $807 million in 2011. Earnings have also been a bit erratic with a big dip to a loss of $(3.24) share in 2009. Otherwise, earnings have grown from $1.36/share in 2007 to $2.08/share in 2011. Diluted outstanding shares have increase from 13 million in 2007 to 15 million in 2011.
Free cash flow has also improved from $(2) million in 2007 to $22 million in 2011. Morningstar shows that the company has $239 million in current assets and only $134 million in current liabilities yielding a healthy current ratio of 1.78.
Yahoo "Key Statistics" on DXPE shows that this is a small cap stock with a market capitalization of only $623.36 million. The company has a moderate P/E of 21.42 with a more reasonable forward P/E of 14.73 (fye Dec 31, 2013). With the company expected to continue to show rapid growth the PEG ratio of 0.64 (5 yr expected) reveals that the valuation relative to growth is quite reasonable.
DXPE has only 14.13 million shares outstanding with only 8.72 million that float. Currently there are 335,950 shares out short (as of 2/29/12) with a short ratio of 4.40 slightly ahead of my own 3 day rule for significance. No dividends are paid and the last stock split was a 2:1 split on October 1, 2008.
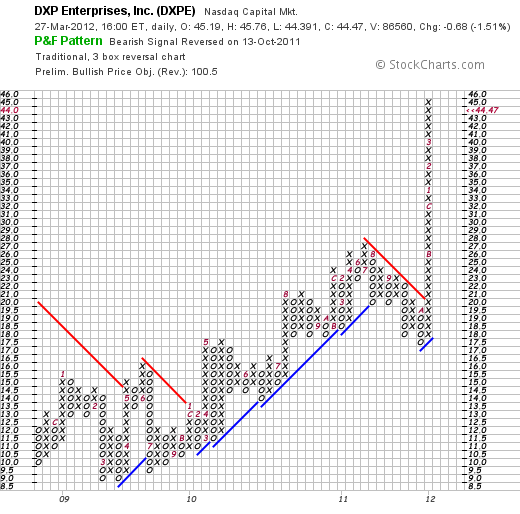
Inspecting the StockChart 'point & figure' chart on DXPE we can see that the company appreciated steadily from a low of $9 in March, 2009 to $27 in July, 2011. After correcting to $17 in October, 2011, the stock price has soared to its current level of $44.47 without any significant pullback. Certainly it appears a bit over-extended but the stock rise is nothing short of incredible.
In summary, I own shares of DXPE that I have recently purchased in light of incredible technical strength, outstanding earnings (although longer-term earnings and sales have been a bit erratic), and valuation that is quite reasonable with a PEG under 1.0. Their balance sheet is solid and the company is generating plenty of free cash flow.
With the sharp rise, I expect a short-term correction as the stock price needs to consolidate. However, as the economy appears to be rebounding (although somewhat weakly), this industrial company appears well-positioned for infrastructure spending as well as spending for equipment for oil pipeline pumping, firewater and potable water pumping.
Thank you again for stopping by and visiting my blog. If you have any comments or questions, please feel free to leave them here and I shall try to respond as able.
Yours in investing,
Bob
Wednesday, 21 March 2012
Liquidity Services (LQDT)
Hello Friends! Thanks so much for stopping by and visiting my blog, Stock Picks Bob's Advice! As always, please remember that I am an amateur investor, so please remember to consult with your professional investment advisers prior to making any investment decisions based on information on this website.
 One of the top performing stocks in my "Buy and Hold" Model on Covestor is Liquidity Services. And I believe I owe it to you the readers of this blog a few words about this holding. Liquidity Service (LQDT) closed at $46.23 today, down $(.07) or (.15)% on the day. Liquidity is a top-ranked stock on the IBD 50 published each Monday by Investor's Business Daily.
According to the Yahoo "Profile" on LQDT, the company
"... operates various online auction marketplaces for surplus and salvage assets in the United States. Its auction marketplaces include liquidation.com, which enables corporations and selected government agencies located in the United States to sell surplus and salvage consumer goods and capital assets...."
Recently Zacks ranked Liquidity Services as a "Buy" based on outstanding earnings reports but pointed out that the stock is far from a 'cheap' selection with PE's in the mid 30's above the industry average in the low teens.
On February 1, 2012, Liquidity Services reported that in the fiscal 2012 first quarter net income came in at $9.1 million or $.28/share, up 550% from $1.4 million or $.05/share the prior year. Revenue climbed 35% to $106 million from $.75.5 million the prior year. The company beat expectations on revenue that was expected by eight analysts polled by S&P at $102.6 million. Similarly the company beat the $.27 expected by analysts for earnings.
Reviewing the longer-term results from Morningstar.com, we can see that except for a dip between 2008 and 2009, revenue has grown strongly from $199 million in 2007 to $327 million in 2011 and $358 million in the trailing twelve months (TTM). Earnings have been erratic with $.39/share reported in 2007, climbing to $.41/share in 2008 before dipping to $.21 in 2009. Earnings rebounded to $.44/share in 2010, dipped to $.29/share in 2011 and climbed again sharply to $.54/share in the TTM. Dilouted shares outstanding has been relatively stable at 28 million shares in 2007 and 30 million in the TTM.
Morningstar reports the company with $171 million in total current assets and $60 million in total current liabilities resulting in a current ratio near 3. Free cash flow has grown nicely from $2 million in 2007 to $35 million in 2011 and $41 million in the TTM.
Looking at Yahoo "Key Statistics" on LQDT for some valuation numbers we first can see that this is a small cap stock with a market capitalization of only $1.42 billion. The stock has a very rich p/e of 86.74 but it so quickly growing that the forward p/e (fye Sep 30, 2013) is estimated at only 28.54. Thus, with the rapid growth in earnings expected, the PEG (5 yr expected) works out to a reasonable value of 1.34 despite the rich current trailing p/e!
Yahoo reports 30.65 million shares outstanding with 21.37 million that float. Currently there are 1.7 million shares out short (as of 2/29/12) yielding a short ratio of 2.90---just under my own 3 day rule for significance of short interest. The company does not pay a dividend and no stock splits are reported.
What is so attractive to me is the price chart of this stock. Like many investors who work hard to identify potential 'winners' I have come to appreciate the beauty of a stock chart like this one that shows a 3 year price appreciation from a low of $4.75/share in February, 2009, to its current levle of $46.23 with nary a correction in the movement. Here is the 'point and figure' chart on Liquidity Services from StockCharts.com:
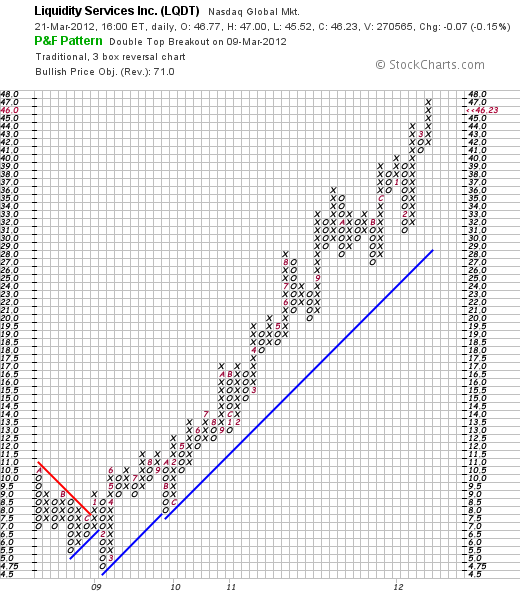
Liquidity Services (LQDT) is a star holding in my portfolio. It is richly priced in terms of trailing p/e but the PEG ratio under 1.5 suggest reasonable valuation for the sharply increasing earnings reported. The balance sheet is sound with the company reporting growing free cash flow and revenues while earnings have been less than consistent. Technically the chart is gorgeous with a 45 degree line that I like to see that starts low on the left side of the chart and higher on the right side!
Thank you again for visiting my blog! If you have any comments or questions, please leave them here. I do not post as often as I would like. But I haven't forgotten about all of you and I appreciate your continued loyalty.
Yours in investing,
Bob
Sunday, 22 January 2012
O'Reilly Automotive (ORLY)
Hello Friends! Thanks so much for stopping by and visiting my blog, Stock Picks Bob's Advice! As always, please remember that I am an amateur investor, so please remember to consult with your professional investment advisers prior to making any investment decisions based on information on this website.
 I have recently written up two auto parts chains: Genuine Parts (GPC) and Autozone (AZO). Genuine Parts is a holding in my Covestor "Buy and Hold" Model, I also have a very small position (2 shares) of Autozone (AZO) but I do not own any shares of O'Reilly (ORLY). ORLY closed at $82.28 on 1/20/12, down $(2.50) or (2.95)% on the day.
Simply put, this entire group of stocks has been doing quite well in the market reflecting, I believe, the underlying strength of their business. People are owning their vehicles longer than ever and they are thus repairing them more often to keep them on the road. As this article points out:
"...the age of the cars and trucks we’re driving has hit an all-time high. Here’s the breakdown
- 2011: 10.8 years vs. 10.6 years in 2010
- Average car in US 11.1 years old vs. 11.0 in 2010
- Average truck in US is 10.4 years old vs. 10.1 in 2010
- There are now 240.5 million vehicles in the US - up nearly 500,000 from 2010"
Since what caught my attention first was the underlying performance of the stock let's take a look at the 'point & figure' chart on O'Reilly from StockCharts.com.
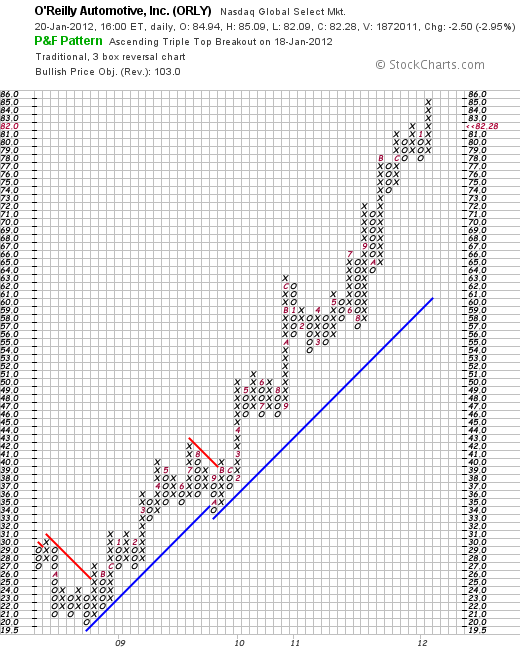
What can you say about such a gorgeous price chart except that the stock may be getting a bit ahead of itself. And no I do not own any shares although I am kicking myself for not buying shares in late 2008 when the stock was trading about $20. Of course, the bigger question is what the stock is likely to do in the future. Let's take a closer look.
 On October 27, 2011, O'Reilly Automotive reported 3rd quarter results. Net income for the company came in at $148.4 million or $1.10/share, up from $116.5 million, or $.82/share the year earlier. Revenue increased 7.7% to $1.54 billion from the year earlier period. These results exceeded analysts expectations of $1.00/share on revenue of $1.51 billion.
In terms of longer-term results, reviewing the Morningstar.com financials on ORLY we can see that revenue has grown steadily from $2.3 billion in 2006 to $5.4 billion in 2010 and $5.7 billion in the trailing twelve months (TTM). Diluted earnings per share have not been quite as consistent increasing from $1.55 in 2006 to $1.67/share in 2007 before dipping to $1.48 in 2008. Earnings climbed to $2.95/share in 2010 and have come in at $3.45/share in the TTM. During this period, the company has increased outstanding shares from 115 million in 2006 to 142 million in 2010 and 141 million in the TTM.
Looking at the balance sheet on Morningstar for O'Reilly, we see that in the latest period the company had $2.3 billion in current assets and only $1.2 billion in current liabilities for a current ratio of nearly 2. From my perspective a current ratio of over 1.5 indicates strong financial health at least for the short-term.
Free cash flow as reported by Morningstar has been relatively unimpressive until recently. The company has $(43) million in free cash flow in 2006, dipped to an even larger negative $(130) million in 2009, came in at $338 million in 2010 and $619 million in the TTM.
Reviewing the Yahoo "Key Statistics" on O'Reilly, we can see that the company is a large cap stock with market capitalization of $10.58 billion. The trailing p/e is a moderate 23.68 with a forward p/e of only 18.79 (fye Dec 31, 2012). The PEG ratio (5 yr expected) comes in at an acceptable 1.33.
Yahoo reports that there are 128.3 million shares outstanding with 123.6 million that float. Currently there are 3.53 million shares out short with a short interest ratio of 4.20 slightly ahead of my own 3 day rule for significance. The company does not pay a dividend and last split its stock June 16, 2005, when it declared a 2:1 split.
What do I think? Well I like this stock and would buy shares if the opportunity arose. Currently I have a position in GPC and a very small holding of AZO. However, Barrons recently gave O'Reilly a nice mention discussing the T. Rowe Price New Horizons Fund, and manager Henry Ellenbogen who has O'Reilly as the largest single holding representing 2.3% of the fund.
The company is sitting in an area that may well continue to resist economic weakness, has terrific technical strength, same store sales growth remains solid at 4.8% in latest reported quarter, valuation is reasonable and financials appear solid with a strong current ratio and growing free cash flow. The only consideration is that the stock may simply be a bit ahead of itself currently and may pull back over the short-term.
Thanks again for visiting! If you have any comments or questions, please feel free to leave them on the blog!
Yours in investing,
Bob
Wednesday, 11 January 2012
Fastenal (FAST)
Hello Friends! Thanks so much for stopping by and visiting my blog, Stock Picks Bob's Advice! As always, please remember that I am an amateur investor, so please remember to consult with your professional investment advisers prior to making any investment decisions based on information on this website.

Fastenal (FAST) is a holding of mine in my Covestor 'Buy & Hold Value' model. I own shares with a cost basis of $41.83. Fastenal closed today (1/11/12) at $45.22, up $.21 or .47% on the day.
I most recently wrote up Fastenal (FAST) on April 12, 2007, when the stock was trading at $38.27, which actually works out to $19.14/share, when adjusted for a 2:1 stock split on May 23, 2011.
Let's take a closer look, one could say I suppose let's get down to 'nuts and bolts' on this company!
According to the Yahoo "Profile" on Fastenal, the company
 "... Is Engaged As A Wholesaler And Retailer Of Industrial And Construction Supplies. The Industrial And Construction Supplies Were Grouped Into Ten Product Lines: Fasteners, Tools And EquipmeNt, Cutting Tools And Abrasives, Hydraulics, Pneumatics, Plumbing And Hvac, Material Handling, Storage And Packaging, Janitorial Supplies, Chemicals And Paints, Electrical Supplies, Welding Supplies, Safety Supplies And Metals, Alloys And Materials."
On October 13, 2011, Fastenal (FAST) announced 3rd quarter results. Sales for the quarter rose 20% to $726.7 million from $603.8 million the year earlier. Earnings came in at $.33/share, up 29% from the prior year's $.25/share result. The company met expectations as analysts had been expecting earnings of $.33/share according to FactSet. The company beat expectations on revenue as analysts had been expecting $721.6 million in sales.
Longer term, reviewing the Morningstar.com "Financials" on Fastenal, we can see that revenue growth was steady between 2006 and 2008 from $1.8 billion to $2.34 billion. However, sales dipped to $1.93 billion in 2009 before once again turning higher and coming in at $2.27 billion in 2010 and $2.64 billion in the trailing twelve months (TTM).
Earnings, similarly, grew from $.66/share in 2006 to $.94 in 2008 before dipping to $.62 in 2009. Earnings rebounded in 2010 at $.90/share and increased to $1.14/share in the TTM.
Outstanding shares have trended lower with 302 million shares in 2006 and 296 million in the TTM.
Briefly examining the Morningstar.com figures on the Fastenal Balance Sheet, we find that the company has $1.09 billion in current assets and only $162 million in current liabilities yielding a very strong current ratio of 6.7. Per Morningstar, Free Cash Flow has grown from $20 million in 2006 to a peak of $254 million in 2009. During the trailing twelve months, the company reported $145 million in free cash flow.
In terms of valuation, examining the Yahoo "Key Statistics" on Fastenal (FAST), we see that the company is a large cap with a market capitalization of $13.35 billion. The trailing p/e is rich at 40.02 with a forward p/e of 32.07. The PEG ratio of 2.19 confirms the price premium being paid for this stock. Generally I prefer to pay for growth only with ratios between 1.0 and 1.5.
According to Yahoo, there are 295.20 million shares outstanding with 23.54 million shares out short as of 12/15/11. This works out to a short interest ratio of 11.50, well above my own '3 day rule' for significance. Thus, there are a lot of shares already sold by short-sellers who are expecting the stock to decline in price. However, if the company outperforms expectations, and the stock rises, these short-sellers might scramble to cover pushing the stock price higher in a 'squeeze'. Just saying.
The company is paying a $.56/share forward dividend yielding 1.2%. The payout ratio is 63% meaning the company is paying out nearly 2/3 of its earnings in the form of dividends to share-holders. As I noted above, the company last split its shares on May 23, 2011, in the form of a 2:1 stock split.
Reviewing the StockCharts.com 'Point & Figure' chart on Fastenal (FAST), we can see that the stock bottomed in March, 2009, about the same time that financials were bottoming, at about $12.50/share. Since that time, the stock has been very strong climing to a recent price of $45.22.
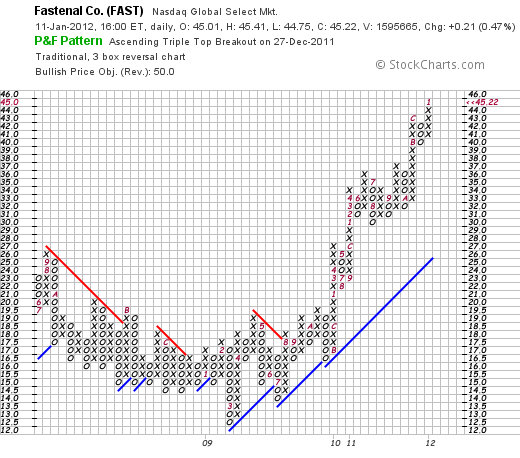
Clearly this has been a very strong stock to own the past several years. And even more so longer-term!
However, the stock is richly priced and one must wonder whether a correction is needed to restore a better balance between earnings, earnings growth, and the stock price. Just today, Bloomberg reported that Fastenal had 21.5 million shares out short as of December 30, 2011, down 1.5 million shares from the December 15th numbers. However, with average trading volume of only 1.5 million shares, this still represents over 6 weeks of volume to cover.
Motley Fool jumped in on the skeptic bandwagon with a recent article listing Fastenal as one of the "5 Great Companies That'll Disappoint Investors" again based on the price/value premium to the market.
However, Zacks last week came out with a "Buy" rating on Fastenal based on the strong price performance and "bullish growth projections". Furthermore, a recent Seeking Alpha article pointed out that at least one insider, a director, made a purchase of about 10,000 shares in December. The Investor's Business Daily explained that with the apparent beginning of a housing rebound in December, housing and construction-related companies might begin to see upturns in their business.
Where do I stand? Well, I own shares of the stock. Valuation is indeed rich, but the track record of this company is hard to beat. Long-term I believe the prospects remain bright for Fastenal (FAST). Shorter-term, I would not be surprised to see increased volatility with profit-taking on perceived bad news as well as short-covering keeping the upward pressure on the stock price.
Thanks so much for stopping by! Please feel free to leave comments or questions right here.
Yours in investing,
Bob
Wednesday, 28 December 2011
Genuine Parts (GPC)
Hello Friends! Thanks so much for stopping by and visiting my blog, Stock Picks Bob's Advice! As always, please remember that I am an amateur investor, so please remember to consult with your professional investment advisers prior to making any investment decisions based on this website.
Like so many of you, I also struggle to find reasonable investments in a very turbulent market. For me reasonable has become an understandable company with understandable products, decent earnings and valuation, good technicals and possibly a dividend to help stabilize the stock price.
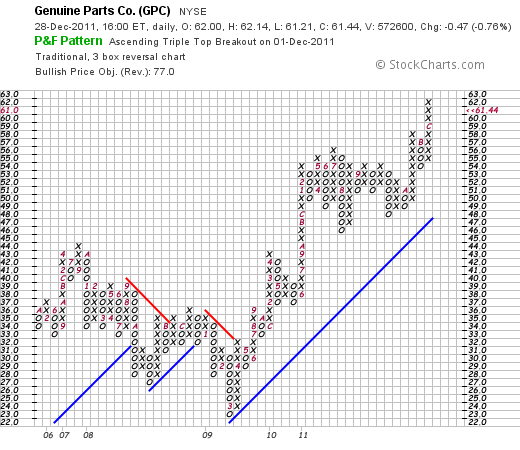
 I recently purchased shares of Genuine Parts (GPC) for exactly those reasons at a cost basis of $58.16. GPC closed today (12/28/11) at $61.44, down $(.47) or (.76)% on the day. This stock is part of my Covestor 'Buy and Hold' Model.
The stock was noted as one of the new "Dividend Aristocrats" by TheStreet.com. According to this article, to make this the company must have:
"... a 10-year history of rising payouts, a 2011 earnings coverage rate of at least 2, and implied coverage rates of at least 2 for 2012 and 2013 based on current consensus earnings estimates."
Richard Shaw, a Seeking Alpha contributor, recently included GPC asone of "5 GARP Stocks With Yield And In An Upward Price Pattern."
Clearly I am not alone in my interest in this particular investment. Let's take a little closer look at this company and shall share with you my own perspective on this apparent favorite.
According to the Yahoo "Profile" on Genuine Parts (GPC), the company
"...distributes automotive replacement parts, industrial replacement  parts, office products, and electrical/electronic materials in the United States, Puerto Rico, Canada, and Mexico. The company operates in four segments: Automotive Parts Group, Industrial Parts Group, Office Products Group, and Electrical/Electronic Materials Group."
Perhaps more importantly, this company"...owns and operates automotive parts distribution centers and automotive parts stores under the NAPA name."
Looking at the latest earnings report, on October 18, 2011, GPC announced 3rd quarter results. Revenue for the quarter came in at $3.3 billion up 18% and ahead of expectations of $3.2 billion according to Thompson Reuters. Net income was $151.8 million or $.97/share ahead of the $131.8 million or $.83/share the prior year same period. Analysts had been expecting earnings of $.94/share.
Review of the financials from Morningstar.com shows that revenue has shown a relatively modest rise from $10.5 billion in 2006 to $11.2 billion in 2010 and $12.2 billion in the trailing twelve months. Similarly diluted earnings per share have increased from $2.76 in 2006 to $3.00 in 2010 and $3.47 in the TTM. The company has been steadily buying back shares with 172 million outstanding in 2006 and only 158 million reported in the TTM.
Morningstar Balance Sheet on GPC shows the company with $4.4 billion in current assets and only $2.0 billion in current liabilities yielding a healthy current ratio of 2.2. In terms of the free cash flow, Morningstar shows GPC with $307 million in free cash flow in 2006 and $593 million in 2010 and $517 million in the TTM. While not steadily increasing, this company spins off over $500 million of free cash flow yearly.
Looking at some valuation numbers from "Key Statistics" on Genuine Parts from Yahoo, we can see that this stock is technically a mid cap stock with a market capitalization of $9.56 billion. The trailing p/e is a moderate 17.71 with a PEG ratio (5 yr expected) of 1.94. The company has 155.65 million shares outstanding. As of 11/30/11 there were 5.17 million shares out short with a short ratio of 6.10, ahead of my own arbitrary '3 day rule' of short interest. While that may mean that there are a lot of investors that are betting against this stock, assuming they don't know more than we do, with the stock price rising, they will need to 'cover their shorts' leading to possibly more buying pressure or a 'short squeeze'.
According to Yahoo, the company has a forward annual dividend of $1.80/share yielding a very healthy 3.00%. The company has a payout ratio of 51% suggesting good coverage of the dividend and the company last split its stock in April, 1997 with a 3:2 stock split.
Looking at the StockCharts.com 'point & figure' chart on GPC, we can see a steady rise in price from a low of $23 in March, 2009, to its current price level of $61.44. The chart appears quite strong but not, in my amateur perspective, getting 'ahead of itself' with a recent period of consolidation from December, 2010 to October, 2011, when it broke out higher in price. I like the chart.
Genuine Parts (GPC) works for me. I appreciate what I like to think of the somewhat added security of an increasing dividend in a stock that appears to have recently been exceeding expectations on earnings and revenue growth, shows reasonable if not cheap valuation, and strong technical performance. In today's difficult market and relatively anemic economy, I can understand an auto parts company that helps support people hanging on to their vehicles longer than ever and looking to repairs instead of a new car purchase.
Thank you so much for stopping by and visiting! If you have any questions or comments please feel free to leave them right here.
Yours in investing,
Bob
Posted by bobsadviceforstocks at 8:16 PM CST
|
Post Comment |
Permalink
Updated: Wednesday, 28 December 2011 10:04 PM CST
Saturday, 19 November 2011
Nu Skin Enterprises (NUS)
Hello Friends! Thanks so much for stopping by and visiting my blog, Stock Picks Bob's Advice! As always, please remember that I am an amateur investor, so please remember to consult with your professional investment advisers prior to making any investment decisions based on information on this website.
I regret that I do not blog quite as often now as I have in the past. I continue to work to write as I really enjoy sharing ideas with all of you. My own strategy for selection remains essentially unchanged. I continue to look for stocks of companies with strong fundamentals and strong price performance. Aren't we all doing that?
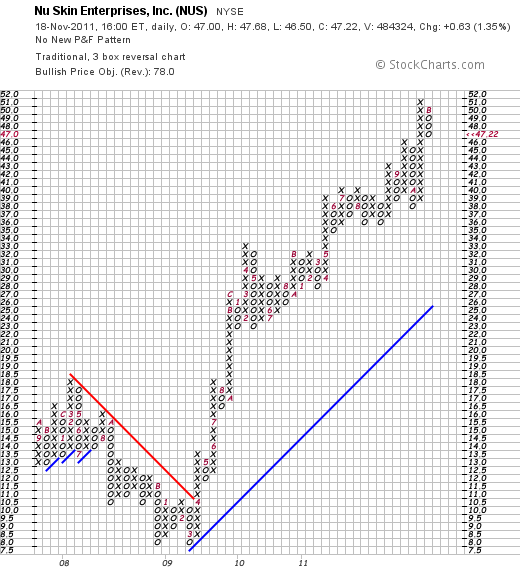
 I recently added Nu Skin (NUS) as a holding in my Covestor "Buy and Hold Value" model. My shares were acquired with a cost basis of $44.47; Nu Skin (NUS) closed at $47.22 onNovember 18, 2011, up $.63 or 1.35% on the day.
According to the Yahoo "Profile" on Nu Skin (NUS), the company
"...develops and distributes anti-aging personal care products and nutritional supplements worldwide. The company sells its personal care products under the Nu Skin brand; and nutritional supplements under the Pharmanex brand. Its personal care product line includes core systems, targeted treatments, total care, cosmetic, and Epoch, a product formulated with botanical ingredients. The company's nutritional supplements product line comprises micronutrient supplements, targeted solution supplements, and weight management products. It also sells Vitameal, which are nutritious meal products for starving children or purchased for personal food storage."
On November 16, 2011, Nu Skin raised guidance on 4th quarter  results with earnings now expected to come in between $.68 and $.72/share above the prior guidance of $.66 to $.70/share. In addition, the company raised 2012 revenue guidance to a range of $1.8 to $1.83 billion. Analysts have been expecting 4th quarter earnings of $.70/share (in line with the new company guidance) and revenue of $1.7 billion, under what the company now believes achievable.
On October 25, 2011, the company reported 3rd quarter results. Net income climbed 32% to $46.8 million or $.72/share from $35.3 million or $.55/share the prior year. This result beat expectations as analysts had been expecting income of $.61/share. Revenue for the quarter increased 12% to $428.4 million ahead of last year's $383.6 million. This result also beat expectations by analysts of revenue of $414.4 million. The strongest region for this company was "Greater China" where revenue climbed 32% to $83.4 million.
Reviewing the Morningstar review of Nu Skin "Financials", we can see that revenue has increased from $1.12 billion in 2006 to $1.54 billion in 2010 and $1.65 billion in the trailing twelve months (TTM). During this same period diluted earnings per share have increased steadily from $.45/share in 2006 to $2.11/share in 2010 and $2.19/share in the TTM. Outstanding shares have declined from 71 million in 2006 to 64 million in the TTM.
In terms of the balance sheet, Morningstar has NUS with total current assets of $423 million, and total current liabilities of $216 million. This yields a very healthy current ratio of 1.96. (Over 1.5 is great from my perspective!)
Morningstar reports that the free cash flow has improved from $38 million in 2006 to $134 million in 2010 and $124 million in the TTM.
In terms of valuation, examining the Yahoo "Key Statistics" on NUS, we can see that the company is a mid cap stock with a market capitalization of $2.94 billion. The trailing p/e is a moderate 21.56 with a forward p/e (fye Dec, 31 2012) estimated at 16.12. With rapid growth in the past and expected in the future, the PEG (5 yr expected) works out to a reasonable 1.30.
Yahoo reports 62.16 million shares outstanding with 54.01 million that float. As of 10/31/11 there were 4 million shares out short with a short interest ratio of 4.5 slightly ahead of my own arbitrary '3 day rule'.
The company pays a forward dividend of $.64/share yielding a not-insignificant 1.4%. The company has a payout ratio of 25%. No prior stock splits are reported on Yahoo.
Reviewing the 'point & figure' chart on Nu Skin (NUS) from StockCharts.com, we can see that the stock declined to a low of $8.00/share in March, 2009, from a recent high of $18/share in March, 2008. Since then the stock has rallied strongly to a recent price of $47.22.
To summarize, Nu Skin Enterprises (NUS) is a stock that I own in my Covestor 'Buy and Hold' model. I own this stock because of its strong technical performance, its recent financial results that exceeded expectations while also raising guidance. The company has a strong more than 5 year record of such performance. In addition, the company is just developing a business presence in 'Greater China' where it is recording much of its outstanding growth. Valuation appears reasonable and the company also pays a small but growing dividend. The chart is gorgeous with a strong price move the past 2 1/2 years. What is there not to like?
Thanks so much again for stopping by and visiting. If you have any comments or questions, please feel free to leave a comment right here.
Yours in investing,
Bob
Wednesday, 16 November 2011
Cardtronics (CATM)
Hello Friends! Thanks so much for stopping by and visiting my blog Stock Picks Bob's Advice! As always, please remember that I am an amateur investor, so please remember to consult with your professional investment advisors prior to making any investment decisions based on information on this website.
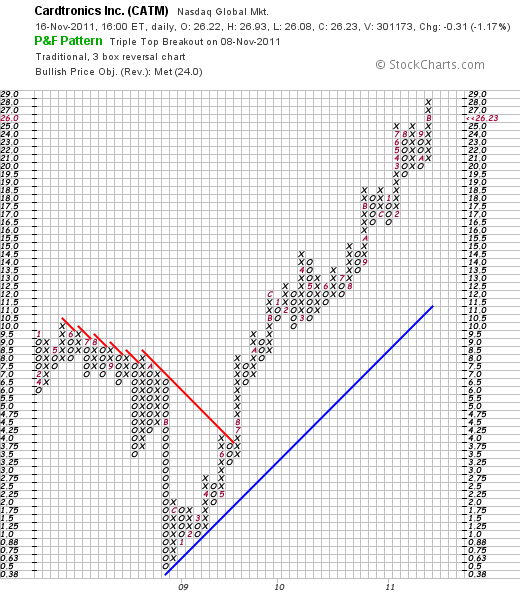
 I have been working very hard to identify strong stocks for inclusion in my "Buy and Hold" model on Covestor. One of my recent purchases and a current holding of mine is Cardtronics (CATM). I wanted to share with you some of my thinking behind this selection and current holding. CATM closed at $26.23 on 11/16/11 down $(.31) or (1.17)% on the day. I have an average cost of $22.22 on this stock.
According to the Yahoo "Profile" on CATM, this company
"... together with its subsidiaries, provides automated consumer financial services through its network of automated teller machines  (ATMs) and multi-function financial services kiosks. As of June 30, 2011, it offered services to approximately 37,800 devices across its portfolio, which included approximately 31,600 devices located in 50 states of the United States, as well as in the U.S. territories of Puerto Rico and the U.S. Virgin Islands; approximately 3,300 devices throughout the United Kingdom; and approximately 2,900 devices throughout Mexico. The company also deployed approximately 2,200 multi-function financial services kiosks in the United States."
On Tuesday, November 8, 2011, Cardtronics (CATM) reported 3rd quarter 2011 results. The company came in with revenue of $165.1 million for the quarter up 20% from the prior year. This exceeded analysts' expectations of revenue of $160.1 million. Earnings came in at $46.88 million up 126% over last year's results. This worked out to an adjusted net income of $.39/share ahead of analysts' expectations of $.37/share. To top off this result, the company went ahead and raised guidance for the full year of adjusted profit of $1.35-$1.38/share, ahead of analysts expectations of $1.31/share and up from prior guidance of $1.26-$1.31/share. To summarize, the company reported results that exceeded expectations on both earnings and revenue and raised guidance going forward. My kind of result!
Reviewing the Morningstar.com financials on Cardtronics for longer-term results we can see that revenue has steadily grown from $294 million in 2006 to $532 million in 2010 and $585 million in the trailing twelve months (TTM). The company turned profitable the last several years after losing $(.46)/share in 2006, increasing that loss to $(4.11)/share in 2007, improving to $(1.81)/share in 2008, then $.13/share in 2009, $.96/share in 2010 and $1.65/share in the TTM.
Outstanding shares have increased from 2 million in 2006 to 40 million in 2009, and have increased only slightly to 43 million in the TTM.
The Morningstar balance sheet on CATM shows the company to have a total of $55 million in current assets and $99 million in current liabilities, with a current ratio of .56. Generally I prefer to see a current ratio of at least 1.0 supporting good financial health. However, with the company rapidly growing and only in the last few years turning profitable, I am willing to accept a sub-par ratio.
Fortunately the 'free cash flow' makes up for this excess of current liabilities and as Morningstar reports has improved from a $(11) million in 2006, decreasing to a $(43) million level before improving to $49 million in 2009, $57 million in 2010 and $56 million in the TTM.
Reviewing the Yahoo "Key Statistics" on Cardtronics for some valuation numbers, we can see that this is a small cap stock with a market capitalization of $1.15 billion. The trailing p/e is a moderate 16.51 with a forward p/e (fye Dec 31, 2012) estimated at 16.50. The PEG ratio works out to an acceptable 1.27 (for me under 1.50 is reasonable).
Yahoo reports that there are currently 43.86 million shares outstanding with 42.73 million of them that float. As of 10/31/11 there were 1.80 million shares out short with a short ratio of 4.90 (slightly ahead of my own 3.0 day ratio for significance---over 3.0 from my perspective may be a bullish indicator).
The company does not pay a dividend and has not split its stock recently.
Examining the 'point & figure' chart on Cardtronics from StockCharts.com, we can see that the stock price, after declining from $10.0 in May, 2008, declined to a low of $.50/share in November, 2008, before starting a sustained increase in price toa recent high of $28.00 this month and the current level of $26.23.
To summarize, Cardtronics (CATM) is a small cap stock that has been growing rapidly both by 'organic' growth as well as acquisitions. It recently reported a terrific quarter that exceeded the analysts' expectations and it raised guidance. It is reasonable valued with a PEG under 1.5 and a p/e under 20. Looking at the financials, we do see that the current ratio is only 0.55 making this a little less solid an investment then I would prefer but the cash flow is positive and growing and the technicals look beautiful.
I am certainly aware of the pressure that financial stocks are under in general with concerns about Greece, Italy, and now other European Union countries. In addition, there is pressure on the ATM business to keep fees as low as possible. However, it appears that Cardtronics (CATM) appears to have their own niche in this business and I am glad to be a shareholder as long as the business continues to hum along!
Thank you so much for stopping by and visiting my blog! If you have any comments or questions, please feel free to leave them right here and I shall try to respond.
Yours in investing,
Bob
Sunday, 9 October 2011
AutoZone (AZO) "Revisiting a Stock Pick"
Hello Friends! Thanks so much for stopping by and visiting my blog, Stock Picks Bob's Advice! As always, please remember that I am an amateur investor, so please remember to consult with your professional investment advisers prior to making any investment decisions based on information on this website.
 There have been many stocks that have been reviewed on this blog. Some of them have been purchased by me in my 'trading account' or more recently into either my Covestor "Buy and Hold Value" model or my Covestor "Healthcare" model that has allowed me to share actual trading strategies and portfolios with my readers. The rest of the posts are either about stocks that didn't do very well since writing them up (yes I have lots of those too) and the stocks that I report on, never purchase, and then later review that they like the great fish on the line, are ones that 'got away'. Autozone (AZO) is definitely a stock that has eluded me and that currently I do not own any shares.
I wrote up AutoZone (AZO) on December 4, 2007, when it had closed at $128.80. AutoZone closed at $324.02 on 10/7/11, up $1.65 on the day.
Let's take a closer look at this stock and see if it still worth including in this blog and possibly adding to an actual portfolio even after this incredible price appreciation!
According to the Yahoo "Profile" on AutoZone (AZO), the company
"...retails and distributes automotive replacement parts and accessories. The  company's stores offer various products for cars, sport utility vehicles, vans, and light trucks....The company also offers commercial sales program that provides the delivery of parts and other products to local, regional, and national repair garages, dealers, service stations, and public sector accounts. In addition, it sells the ALLDATA brand automotive diagnostic and repair software through the Website, alldata.com; and automotive hard parts, maintenance items, accessories, and non-automotive products through the Website, autozone.com. As of May 7, 2011, the company operated 4,467 stores in the United States and Puerto Rico, and 261 stores in Mexico. AutoZone, Inc. was founded in 1979 and is based in Memphis, Tennessee."
As I have written and we all certainly are aware of, the economy in the United States and indeed globally is weak as we all work to get out of the worldwide slowdown. News stories abound how Americans are holding their cars longer and repairing them instead of looking for a replacement vehicle. As expected this bodes well for auto parts stores like AutoZone (AZO).
On September 20, 2011, AutoZone reported 4th quarter 2011 results. For the quarter ended August 27, 2011, the company had a 12.1% increase in profit from $268.9 million the prior year to $301.5 million. Earnings per share grew 26.9% to $7.18 from $5.66 last year exceeding analysts expectations of $6.98.
Revenue for the quarter increased 8.1% to $2.64 billion, ahead of analysts expectations of $2.61 billion. Same store sales in the U.S. increased 4.5% during the quarter.
Reviewing the Morningstar.com financials on AZO, we can see that revenue has steadily increased from $5.95 billion in 2006 to $7.36 billion in 2010 and $7.88 billion in the trailing twelve months (TTM). Earnins have also steadily  increased with $7.50/share reported in 2006 increasing to $14.97/share in 2010 and $18.18/share in the TTM. During this time outstanding shares have decreased from 76 million in 2006 to 49 million in 2010 and 45 million in the TTM.
Briefly examining the Morningstar.com balance sheet figures, we see that the latest numbers find AutoZone with $2.6 billion in current assets as opposed to $3.064 billion in current liabilities a ration under 1.0. However 'free cash flow' has been improving from $559 million in 2006 to $1.02 billion in the TTM suggesting that this deficit in current assets over current liabilities is easily managed. However, I do prefer to see companies with an excess of current assets over current liabilities and maybe AZO would be better off building its balance sheet a bit over the continued share buy back (?).
In terms of valuation, Yahoo "Key Statistics" on AutoZone shows us that the company is a large cap stock with a market capitalization of $13 billion. The trailing p/e is a moderate 16.64 but with solid growth the forward p/e (fye Aug 27, 2013) is estimated at 12.53. The dynamic growth expected from AZO results in a very reasonable PEG of 0.96.
Yahoo reports currently the company has only 40.11 million shares outstanding with a float of 27.96 million. There are 1.47 million shares out short yielding a short interest ratio of 3.70, slightly higher than my own arbitrary '3 day rule' for significance. No dividends are paid and the company last split its stock 4/21/94 when a 2:1 split was distributed.
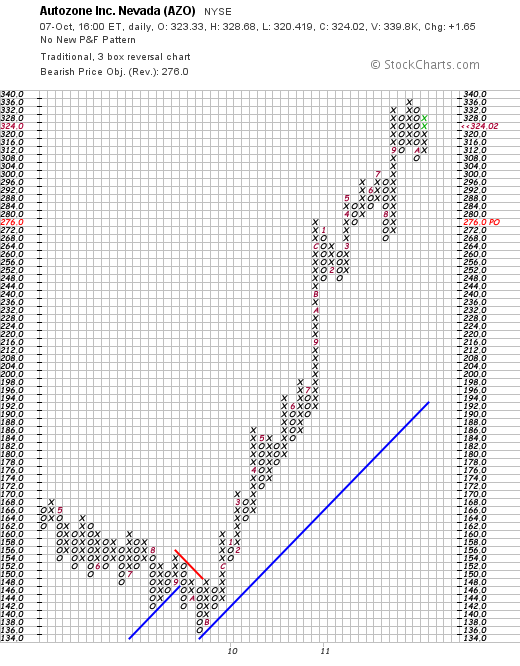
Reviewing the 'point & figure' chart on AZO from StockCharts.com, we can see that the stock declined to a low of $136 in November, 2009, before starting its virtually meteoric climb to its current level of $324.02. If anything the fast rise of this stock suggest that it is 'overextended' but it shows remarkable strength!
To summarize, AutoZone (AZO) has been a terrific stock (if you owned shares) the past couple of years. It may well be a retail area (auto parts) that is recession resistant. It continues to do well with a strong recent quarterly report that exceeded expectations, the stores are reporting sustainable same-store sales growth, and they are buying back shares steadily supporting the per share results as well as the stock price.
On the negative side, the company seems to have a slight dearth of cash vis a vis the current assets vs current liabililties. However, the strong free cash flow growth is easily handling this. Otherwise, technically, I am a bit afraid that I may be a bit late to the party here and would rather see this stock pull back a bit before stepping in myself. Of course, I probably said the same thing back in 2007!
Valuation isn't bad at all with a trailing p/e in the mid-teens and a PEG ration under 1.0.
Thank you again for stopping by and visiting! If you have any comments or questions, please feel free to leave them right here on the blog!
Yours in investing,
Bob
Tuesday, 4 October 2011
Costco (COST)
Hello Friends! Thanks so much for stopping by and visiting my blog, Stock Picks Bob's Advice! As always, please remember that I am an amateur investor, so please remember to consult with your professional investment advisors prior to making any investment decisions based on information on this website.
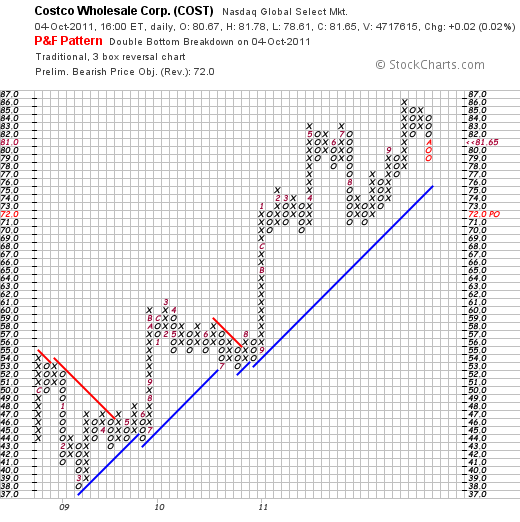
 On September 1, 2011, I purchased shares in Costco (COST) for my "Buy and Hold Value" model in my Covestor account. The shares were purchased with a cost basis of $80.14. Costco (COST) closed today (10/4/11) at a price of $81.65, up $.02 or .02% on the day.
With the economy continuing to teeter on the edge of a 'double-dip' recession, I have along with other investors found a small amount of hoped-for safety in the companies that can do well when times are rough for many Americans. Some of the stocks I hold include Costco (COST) that is a leading warehouse store providing discounted goods to members when bought in bulk, McDonald's (MCD) which remains a staple value fast-food outfit that seems to be recession-resistant, TJMaxx (TJX) which with its occasional high-end brands that it stocks at close-out prices may be competing with Target (TGT) for the distinction of "cheap chic", and Perrigo (PRGO) which provides the cash-strapped consumer an opportunity to buy knock-off products in the form of house brands at cheaper prices at stores like Walgreen (WAG).
September 'same-store sales' results should be released shortly, but the latest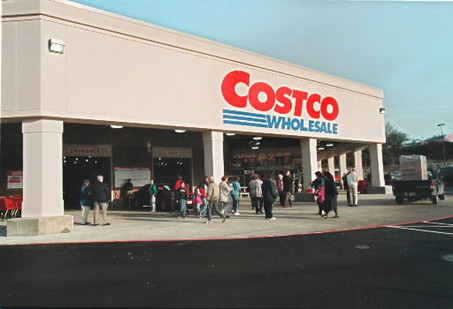 results from August, 2011, found Costco (COST) with same-store sales growth of 6%.
On May 25, 2011, Costco (COST) reported 3rd quarter results with earnings of $324 million or $.73/share compared with earnings of $306 million or $.68/share the prior year. Analysts however, were expecting earnings of $.77/share, but the continued solid reports of same-store sales growth have supported the continued stock price appreciation since.
In terms of valuation, if we look at the Yahoo "Key Statistics" on Costco, we can see that the market cap is a large cap size $35.75 billion. The trailing p/e is a tad rich at 25.51 with a better forward p/e (fye Aug 29, 2012) of 21.26. However, even with this growth, the PEG is a bit rich as well at 1.96.
COST has 437.81 million shares outstanding and has 9.65 million shares out short as of 9/15/11, representing 3.5 trading days, a little bit above my own arbitrary '3 day rule' for short interest.
The company pays a forward dividend of $.96/share yielding 1.2% at its current price. The payout ratio is a modest 27% suggesting plenty of room for continued dividend payment and possible growth in the amount. The company last split its stock 1/14/00 with a 2:1 split at that time.
Reviewing some of the Morningstar.com financials for a longer-term view of this company we can see that revenue, except for a dip in 2009, has grown steadily from $60.1 billion in 2006 to $77.9 billion in 2010 and $84.8 billion in the trailing twelve months (TTM). Similarly, except for a dip in 2009, earnings have also grown steadily from $2.30/share in 2006 to $2.92/share in 2010 and $3.20/share in the TTM. Diluted outstanding shares have been reduced during this perior from 480 million in 2006 to 446 million in 2010 and 443 million in the TTM.
The balance sheet appears adequate with $11.7 billion in most-recent current assets reported, compared to $10.06 billion in current liabilities. During this period free cash flow has soared from $615 million in 2006 to $1.7 billion in 2010 and $1.6 billion in the TTM.
Finally, the Costco (COST) 'point and figure' chart from StockCharts.com is a beautiful chart with a steady increase in price from a dip in 2009 in March when the stock hit $38/share to its most recent high of $86 in September, 2011. The stock has pulled back slightly to its current close at $81.65.
To summarize, I recently purchased shares of Costco (COST) in my own belief that it offered some relative recession-resistance in terms of attracting more value-driven buyers in this difficult economic environment. They continue to report steady and strong same-store sales growth, they pay a dividend, have a long-term record of growing their revenue and earnings and generating a solid free cash flow, and have a great chart as well.
I cannot predict whether we are to be entering into a double-dip recession, whether the deadlock in Congress will continue, whether the Fed will do a "twist" or another round of 'quantitative easing', whether Greece or Italy will resolve their financial problems or any other crisis which may affect the market. However, I shall continue to concentrate on those companies that continue to do well fundamentally as well as technically as we review stocks and the companies they represent.
Thank you again for stopping by and visiting my blog. If you have any comments or questions, please feel to leave them right here.
Yours in investing,
Bob
Sunday, 7 August 2011
IDEXX Laboratories (IDXX)
Hello Friends! Thanks so much for stopping by and visiting my blog, Stock Picks Bob's Advice! As always, please remember that I am an amateur investor, so please remember to consult with your professional investment advisers prior to making any investment decisions based on information on this website.
I am fully aware of the effects of the debt downgrade by S&P on U.S. Government debt. The downgrade may push the already weakly recovering economy back into recession. As I write, stock futures are strongly negative for the opening tomorrow (Monday). Beyond that, I am wise enough to know that it is a fool's game to predict the market beyond what is immediately seen. It is well known that stocks often climb a wall of worry as the negative news becomes quickly 'baked into the cake' and investors and institutions look beyond the immediate future into longer-term possibilities. That being said, I am being quite cautious and am willing to miss a rebound to avoid a large loss with much of my holdings in my Covestor Healthcare and my Covestor Buy and Hold accounts sitting in cash.
Please consult with your own professional investment adivsers regarding the current market environment to assist you in dealing with the tremendous volatility!
With all of that said, I still remain committed to identifying the highest quality companies that might be considered for investing.
 Recently I purchased some shares of IDEXX (IDXX) at $85.79 on 7/22/11 only to sell them just last week on 8/4/11 at a price of $78.02 for a loss of $(7.77) or (9.06)%. As much as possible I try to limit my losses after initial purchases to 8% and also to avoid quickly reinvesting those funds to avoid compounding losses in a market downdraft. I do not currently own any shares of IDEXX (IDXX).
However, I believe that IDEXX (IDXX) is a great company and when the market sorts out, might well be considered for investment once again. Let's take a closer look at this company and see if it is indeed worth a place in my blog and in my portfolio.
 According to the Yahoo "Profile" on IDEXX Laboratories (IDXX), the company
"...develops, manufactures, and distributes products for the veterinary and production animal markets, as well as for the water testing and dairy markets."
Like so many of my amateur stock 'picks' I start with an earnings headline that catches my attention. On July 22, 2011, IDEXX (IDXX) announced 2nd quarter 2011 results. The company reported revenue for the quarter of $317.9 million a 13% increase over the prior year's revenue result. This exceeded expectations of $308 million. Earnings came in at $.83/share up from $.62/share last year. This also exceeded expectations of $.72/share. To top it off the company raised guidance for the full-year to revenue of $1.205 to $1.215 billion and earnings of $2.68 to $2.73/share up from prior guidance of $2.66 to $2.71/share.
Reviewing longer-term results, we can see on the Morningstar.com "Financials" that revenue has increased from $739 million in 2006 to $1103 million in 2010 and $1164 million in the trailing twelve months (TTM). Earnings per share have grown steadily from $1.49/share in 2006 to $2.45/share in 2010 and $2.72/share in the TTM. The outstanding shares have actually been reduced from 66 million in 2006 to 60 million in 2010 and 59 million in the TTM.
Examining a few numbers from the Morningstar.com "Balance Sheet" on IDXX, we can find that the total current assets are listed as $461 million compared to the total current liabilities of $285 million. This yields a current ratio of 1.62.
The Morningstar.com "cash flow" analysis on IDXX shows free cash flow improving from $38 million in 2006 to $140 million in 2010 and $144 million in the TTM.
In terms of valuation, using the Yahoo "Key Statistics" on IDXX, we find that this is a mid cap stock with a market capitalization of $4.23 billion. The trailing p/e is a moderate 28.09, and the PEG also is a tad rich at 1.88.
According to Yahoo there are 56.8 million shares outstanding with 56.28 million of them that float. As of 7/15/11 there were 3.95 million shares out short representing a short interest ratio of 14.5. This appears quite significant as my own arbitrary cut-off on this is 3.0 days.
The company does not pay a dividend and last split its stock November 27, 2007, when it split 2:1.
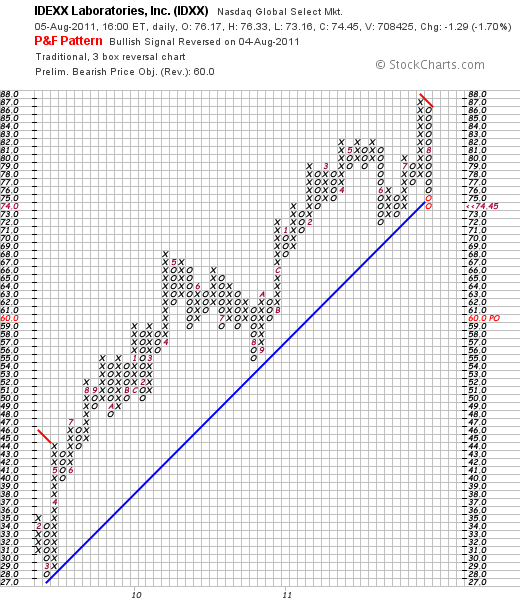
Reviewing the IDEXX Laboratories 'point & figure' chart from StockCharts.com, we can see that the stock has moved strongly higher since March, 2009, when it was trading as low as $28 to its recent peak at $87 in July, 2011. The stock has recently sold off sharply down to $74.45, breaking through the plotted support line.
To summarize IDEXX Laboratories (IDXX) recently caught my attention with an outstanding earnings report that beat expectations on both the revenue and earnings side. This veterinary supply/equipment company also raised guidance for the full year. They have a record of steadily growing revenue and earnings for the past five or more years and have a solid balance sheet with growing free cash flow and diminishing outstanding shares.
Value-wise, the p/e ratio is a bit rich at 28 and the PEG is also a bit rich at 1.88. The short-sellers apparently agree as quite a few shares are out short with a short-interest ratio of 14.5. I do believe that as the market settles down from its recent volatility, this might be a good place to revisit for a possible investment. Meanwhile, I also am battening the hatches waiting for this financial storm to pass by.
Thank you again for stopping by and visiting my blog! If you have any questions or comments, please feel free to leave them right here on the website.
Yours in investing,
Bob
Newer | Latest | Older


