Stock Picks Bob's Advice
Sunday, 15 April 2012
McKesson (MCK)
Hello Friends! Thanks so much for stopping by and visiting my blog, Stock Picks Bob's Advice! As always, please remember that I am an amateur investor, so please remember that I am an amateur investor, so please remember to consult with your professional investment advisers prior to making any investment decisions based on information on this website.
I wanted to share with you what I call a 'swap' in my Covestor Healthcare Model last week. Centene (CNC) shares swooned last week after they lost a contract for the Ohio Department of Job and Family Services. I sold my shares at $43.49 and the stock already has bounced back to a slightly higher level!
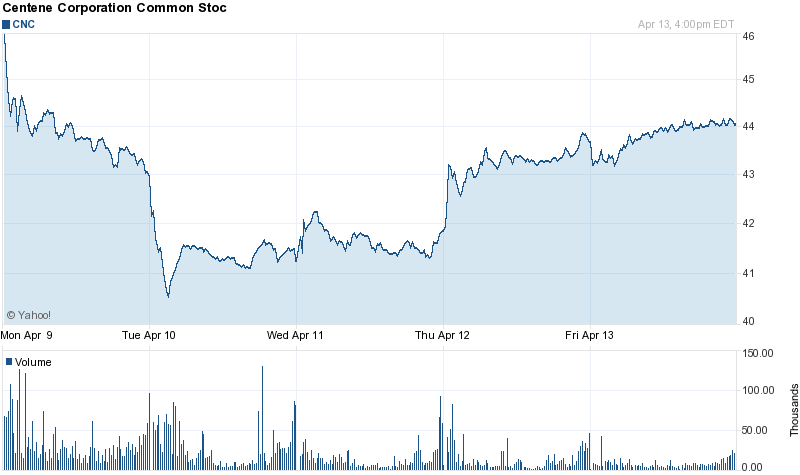
I cannot deny that I have a little seller's remorse, but I have also noticed that stocks after a sharp decline often have a bounce higher, but way once again move lower into the future.
 Anyhow, I picked up some shares of McKesson (MCK) with the proceeds. One of the first times I reviewed McKesson was back on January 1, 2004, literally over 8 years ago right here on this blog! (The years have really flown by here!)
At that time the stock was trading at $32.16. MCK closed at $90.48 on 4/13/12, so the stock really has done very well since that post.
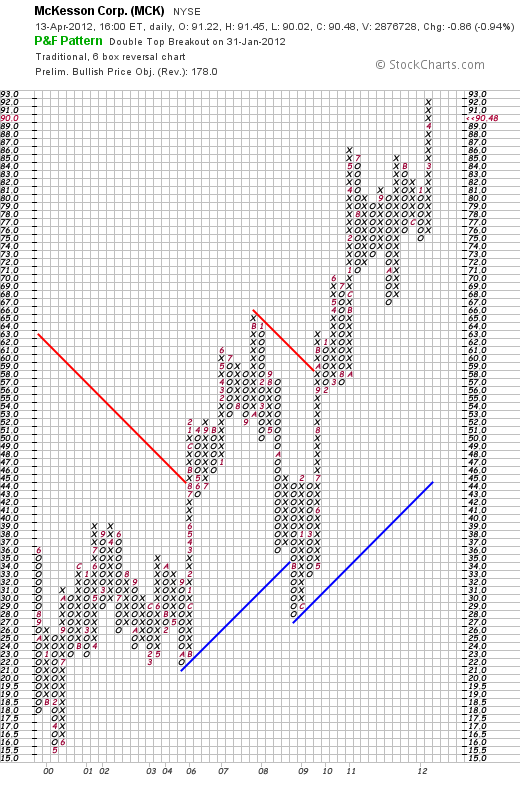
Let's take a closer look at MCK and let's see if it is still was wise to pick up shares now that the stock has nearly tripled in price since I first visited it!
According to the Yahoo "Profile" on McKesson, the company
 "...delivers medicines, pharmaceutical supplies, information, and care management products and services for the healthcare industry."
Unlike Centene (CNC) which suffered from a loss of a contract, McKesson (MCK) has been strong recently due to a continuance of a contract with the Department of Veteran affairs (VA).
In terms of its latest quarter, McKesson reported their 3rd fiscal quarter (ended December 31, 2011) on January 30, 2012. As Motley Fool pointed out on January 31, 2012, they had strong results with revenue growth of 9.2% coming in at $30.84 billion ahead of last year's $28.20 billion and exceeding analysts' expectations of $30.19 billion.
The company reported earnings of $1.40 ahead of estimates of $1.38 on same basis. GAAP earnings of $1.20 were 100% higher than the prior year's $.60/share result.
In terms of longer-term results, reviewing the Morningstar.com "Financials" on McKesson, we can see that revenue has steadily grown from $93.0 billion in 2007 to $112.1 billion in 2011 and $119.9 billion in the trailing twelve months (TTM). Earnings have grown but somewhat less consistently from $2.99/share in 2007 to $4.57 in 2011 and $5.13/share in the TTM.
The company has been retiring shares through buybacks with 305 million shares outstanding in 2007, 263 million shares in 2011 and 254 million in the TTM. The company announced another $650 million in stock repurchases on January 31, 2012.
Morningstar reports McKesson with $22.4 billion in current assets and $18.7 billion in current liabilities for a current ratio of 1.20. The company has also grown its free cash flow which has increased from $1.2 billion in 2007 to $2.0 billion in 2011 and $2.3 billion in the trailing twelve months.
Examining the valuation of the stock, we can see from the Yahoo "Key Statistics" page, that McKesson is a large cap stock with a market capitalization of $22.27 billion.
The trailing P/E is reported at 17.64 with a forward P/E of 12.57. With solid growth expected the PEG Ratio (5 yr expected ) works out to a very reasonable 0.95 indicating reasonable valuation.
Yahoo reports 246.10 million shares outstanding with 245.30 million that float. As of March 30, 2012, there were 1.88 million shares out short with a very modest short interest ratio of 1.00 (well below my own arbitrary 3 day rule for significance).
McKesson pays a modest dividend with a forward dividend yield of 0.90%. The company last split its stock in January, 1998, when it declared a 2:1 stock split.
McKesson is a solid stock for my portfolio and belongs in this blog. Summarizing a few findings here, the stock recently reported a renewal of a very significant pharmaceutical contract with the Veterans Administration, the latest quarterly report was strong with growth in revenue and earnings that both exceeded expectations. Technically the stock has a strong chart going back for at least eight years. They have steadily grown their revenue, earnings (not quite as steady), and grown their free cash flow the past five years. Meanwhile they have bought back shares reducing the float and increasing shareholder value while maintaining a dividend and a strong balance sheet. The stock is modestly priced and considering estimated growth, the PEG is under 1.0 which is not a common finding in the stocks that I review on this blog.
My hand isn't as steady when bad news derails one or more of my holdings. I am relatively quick to sell on this news and even though Centene (CNC) may turn out to be a terrific stock long term, it appears that McKesson (MCK) is also a good choice. I shall be keeping Centene on my 'watch list' and may well revisit this holding in the future!
Thanks again for visiting here. If you have any comments or questions, please feel free to leave them right here.
Yours in investing,
Bob
Wednesday, 11 April 2012
Which Auto Parts Stock Should my Stock Club Buy?
Hello Friends! Thanks so much for stopping by and visiting my blog, Stock Picks Bob's Advice! As always, please remember that I am an amateur investor, so please remember to consult with your professional investment advisers prior to making any investment decisions based on information on this website.
 In about 2 1/2 hours my Grounded Investment Club (named after the Coffee Shop where most of the members hang out) shall be meeting. Last month I suggested that the club take a look at the auto parts stores. I have some shares in my Covestor Buy and Hold Model in Genuine Auto Parts (GPC), and have smaller positions in Autozone (AZO), O'Reilly Automotive (ORLY), and Advance Auto Parts (AAP) in my personal trading account. But the Secretary of the club, Rick A. tasked me to pick one for the club and now at 3:17 pm (with the meeting starting at 5:30) I haven't done so yet. So with the Club and my readers in mind let's take a quick look at these four companies and let's see if I can narrow this down in any rational fashion.
For ease of this, let's concentrate on the parameters of value, fundamentals and technicals. From my perspective all of these companies have virtually been 'on fire' demonstrating very strong price appreciation this past year.
For value, to keep things simple (It is now 3:20 and getting later!), we shall use the p/e, price/sales and the PEG ratio to consider value in terms of price compared to the earnings as well as the PEG which allows us to adjust for future earnings. I will throw in the Dividend Yield into this section which is generally attractive to any value investor.
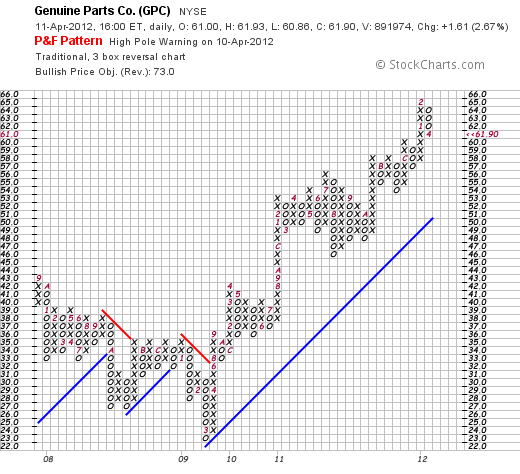
GENUINE PARTS: P/E of 17.29, p/s of 0.75, PEG of 1.86, forward yield 3.2%
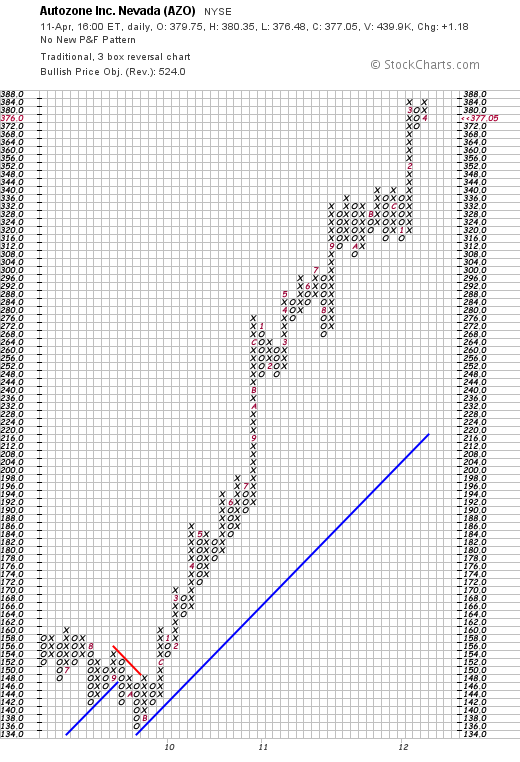
AUTOZONE: P/E of 17.59, p/s of 1.75, PEG of 1.06, no dividend
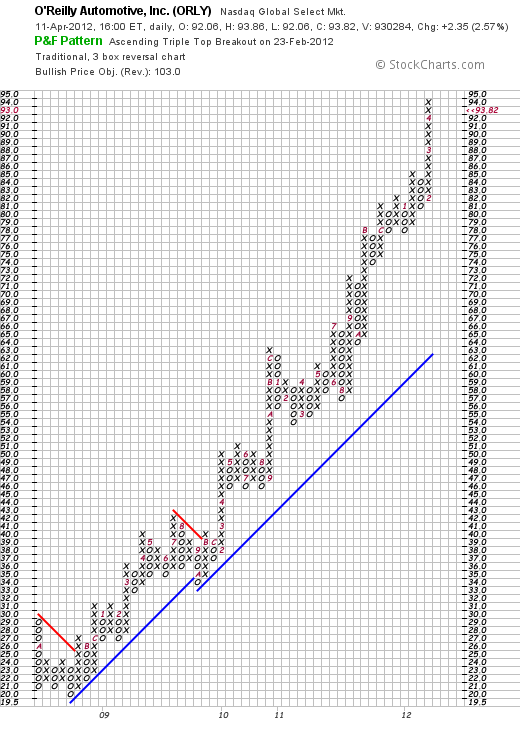
O'REILLY: P/E of 25.29, p/s of 2.01, PEG of 1.23, no dividend
ADVANCE AUTO PARTS: P/E of 17.55, p/s of 1.04, PEG of 1.05, forward yield of 0.3%
In this comparison, I would have to vote for Genuine Parts (GPC) which has the lowest p/e, the best price/sales, and the best yield. However, you pay a bit more for the growth with the PEG being higher than the others in this group. From my perspective, the investor makes up for that with a real dividend.
OK it is 3:35 and I have about an hour and a half to finish the other comparisons....
Fundamentals. Let's take a look at the latest quarterly report for each, the Morningstar trend on revenue and earnings growth, free cash flow trends, and current ratios. That's a lot, but I think I have the time to do this. So no more delays....First of all, the latest quarterly earnings:
GENUINE PARTS: GPC reported on 2/21/12--revenue came in at $3.01 billion, this was actually under the $3.05 billion expected but 7.4% ahead of last year's $2.81 billion. Earnings came in at $.86, ahead of the expected $.83/share and 15% higher than last year.
AUTOZONE: AutoZone reported on 2/28/12 with sales increasing 9% to $1.8 billion, in line with estimates. Earnings came in up 24% to $4.15/share from $3.34/share the prior year and $.11 ahead of estimates.
O'REILLY: ORLY reported on 2/13/12 with revenue of $1.39 billion, under estimates of $1.41 billion but 6.2% ahead of prior year's $1.31 billion result. GAAP earnings of $.94 (and non-GAAP eps of $.93) were ahead of the single estimate of $.86/share and 29% higher than the prior year.
ADVANCE AUTO PARTS: AAP reported on 2/23/12 a 58% increase in profit to $.90/share up from $.57/share. This exceeded estimates by $.16/share. Sales grew 4.5% to $1.33 billion from $1.27 billion the prior year. This news story also reported that margins deteriorated 39 basis points to 49% from 49.4% from the prior year same period.
In terms of the latest quarter AUTOZONE would have to be my selection with strong sales growth and earnings growth.
It is now 3:58 and I have about an hour.
Let's see if we can look at Morningstar.com and get some figures on consistent revenue growth, earnings growth, free cash flow, and current ratios.
GENUINE PARTS: Revenue has grown from $10.8 billion in 2007 to $12.46 billion in the TTM. Revenue had a dip in 2009. Earnings in 2007 $2.98/share dipped to $2.92 in 2008, $2.50 in 2009, before climbing to $3.00 in 2010 and $3.58 in 2011. Free cash flow $526 million in 2007 and up and down to 2011 when it came in at $521 million. Current ratio 2.53.
AUTOZONE: Revenue shows steady growth from $6.17 billion in 2007 to $8.34 billion in TTM. Earnings show steady growth from $8.53/share in 2007 to $21.44/share in the TTM. Free cash flow has grown from $621 million in 2007 to $966 million in the TTM. AZO has a current ratio of .814.
O'REILLY: Revenue of $2.52 billion in 2007 increasing steadily to $5.79 billion in 2011. Earnings increahttp://financials.morningstar.com/income-statement/is.html?t=AAP®ion=USA&culture=en-ussed from $1.67/share in 2007, dipped to $1.48 in 2008, then increased steadily to $3.71 in 2011. Free cash flow has been a bit erratic coming in at $17 million in 2007, dipped all the way to $(130) million in 2009, then increased to $338 million in 2010 and $791 million in 2011. Morningstar reports a current ratio of 1.65 for 2011.
ADVANCE AUTO PARTS:Revenue growth from $4.8 billion in 2007 to $6.2 billion in 2011. Earnings growth from $2.28/share in 2007 to $5.11/share in 2011. Free cash flow increasing from $200 million in 2007 to $561 million in 2011. Current ratio works out to 1.05.
My nod would have to go to O'Reilly (ORLY) in terms of fundamentals with an outstanding record of revenue growth, earnings growth, free cash flow, and a solid balance sheet.
It's now 4:34 and with about 40 minutes to go, let's try to get some charts up here and see if we can find an obvious 'winner'.
GENUINE PARTS:
AUTOZONE:
O'REILLY:
ADVANCE AUTO PARTS:
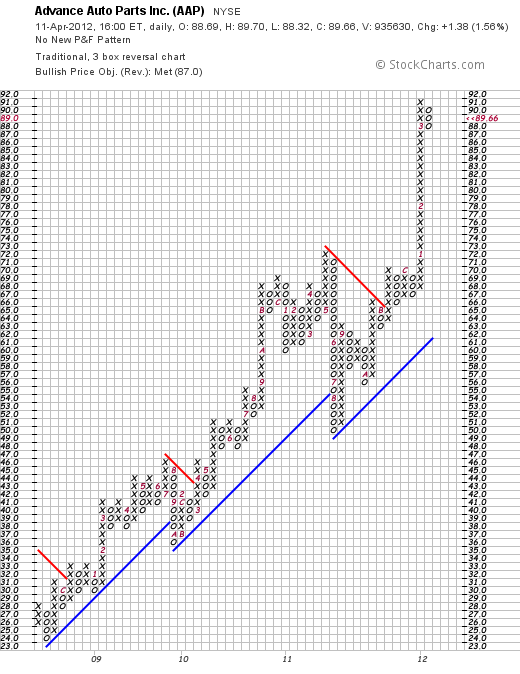
OK maybe I am reading these charts wrong, but for me GENUINE PARTS wins this competition. ALL of the charts look terrific, but the others appear a bit over-extended. What's your take?
It's now 4:45 and I need to wrap this entry up and get down to Java Vino where I will likely have my full order of Lox and Cream Cheese on an everything bagel holding the onions. OK forget the food. What's the conclusion?
I shall be reporting back to my stock club that Genuine Parts (GPC) is my choice with the best value, and most reasonable stock chart. Autozone (AZO) wins on the latest quarter report, and O'Reilly best on fundamentals. Heck they all look terrific. If I could, I would buy a 'basket' of all four.
Looks like I made it. Now 4:50 and club starts at 5:30. I have time to finish up my coffee at Starbucks (SBUX) and publish this blog entry.

Thanks so much for stopping by and visiting with me as I get ready for my Stock Club.
Yours in investing,
Bob
-------------
P.S. I got to my club by 5:25 (Central Time of course) and found we had a little cash in the till. My club dipped their toes into the water and purchased 10 shares of Genuine Parts to start us out.
Here is a picture of the guys: Michael, yours truly, Rick, Steve, and Jerry. Great friends and fellow investors who aren't quite sure why the world would care about seeing them or I suppose reading about them in my blog. I don't know why either. But it is part of my world and that's what blogging is about.

I asked if they wanted to wait while I got this posted but they are off now back to their real world where I shall be rejoining in a sec. Have a great week my friends!
Posted by bobsadviceforstocks at 4:19 PM CDT
|
Post Comment |
Permalink
Updated: Wednesday, 11 April 2012 7:20 PM CDT
Sunday, 1 April 2012
W.W. Grainger (GWW)
Hello friends! Thanks so much for stopping by and visiting my blog, Stock Picks Bob's Advice! As always, please remember that I am an amateur investor, so please remember to consult with your professional investment advisers prior to making any investment decisions based on information on this website.
I am now approaching my 3rd anniversary of my "Buy and Hold" model on Covestor which had its inception on April 15, 2009. Similarly I am approaching my 9th anniversary of my first entry on this blog on May 12, 2003. I would like to thank all of my readers and everyone at Covestor and Seeking Alpha who have supported me and encouraged my blogging.
 This past month I picked up shares of W.W. Grainger (GWW) for my Covestor Buy and Hold Model on March 12, 2012, at a cost of $212.98/share. GWW closed at $214.81 on March 30, 2012, down $(2.74) or (1.26)% on the day, slighly ahead of my own purchase price. Let's take a closer look at the business, the fundamentals of performance, some of the valuation figures and finally the technicals of the price chart.
According to the Yahoo "Profile" on W.W. Grainger (GWW), the company
"... provides material handling equipment, safety and  security supplies, lighting and electrical products, power and hand tools, pumps and plumbing supplies, cleaning and maintenance supplies, forestry and agriculture equipment, building and home inspection supplies, vehicle and fleet components, fasteners, instruments, welding and shop equipment, and various other items for facilities maintenance market; and services comprising inventory management and energy efficiency solutions. Its customers include small and medium-sized businesses to large corporations, government entities, and other institutions."
How is the business doing? On March 12, 2012, GWW reported strong February, 2012 sales, with an 18% increase aided by an additional selling day (21), higher prices, and higher volumes.
Examining their latest quarterly report, Grainger (GWW) reported 4th quarter results on January 25, 2012. Revenue came in at $2.08 billion, ahead of the $2.07 billion analysts were expecting according to FactSet Research, and earnings came in at $148.5 million or $2.04/share, or an adjusted $2.13/share ahead of last year's $132.2 million or $1.83/share while also exceeding expectations of $2.11/share. The company maintained guidance of $9.90 to $10.6/share for the 2012 fiscal year.
Longer-term, Grainger, according to the Morningstar.com 'Financials' has increased its revenue from $6.4 billion in 2007 to $8.07 billion in the trailing twelve months (TTM). During the same period earnings have increased from $4.94/share in 2007 to $9.07/share in the TTM. Outstanding shares have decreased from 85 million in 2007 to 71 million shares outstanding in the TTM as the company bought back shares steadily during this period.
As of December, 2011, GWW had $2.7 billion in total current assets $.87 billion in total current liabilities for a healthy current ratio of 3.1. Free cash flow has grown from $271 million in 2007 to $549 million in 2011.
In terms of valuation, using the Yahoo 'Key Statistics' on W.W. Grainger (GWW), we can see that this is a large cap stock with a market capitalization of $15.06 Billion. The trailing P/E is a bit rich at 23.68 but with continued growth, the forward P/E is estimated (fye Dec 31, 2013) at 17.84 with a PEG Ratio (5 yr expected) working out more reasonable at 1.55.
The company has 70.1 million shares outstanding with 60.32 million that float. As of 3/15/12, there were 1.49 million shares out short ahead of my own arbitrary '3 day rule' at 5.60 days or short interest. The company pays a dividend estimated going forward at $2.64 yielding 1.20%. The company has a payout ratio of 28% and last had a stock split in 1988 when it split its shares 2:1.
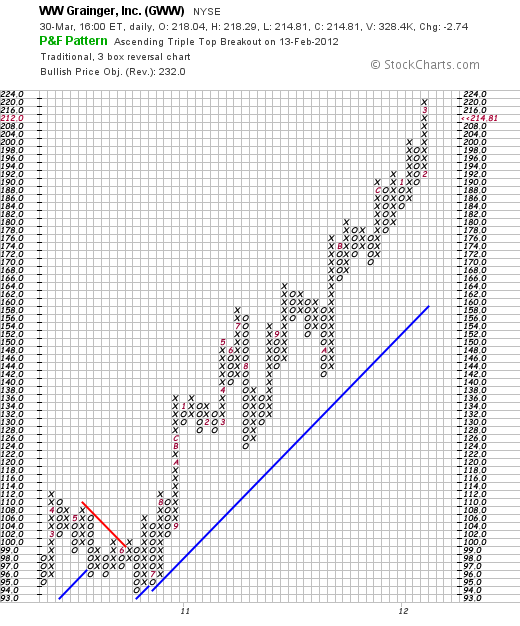
There is little to explain about the technicals on GWW. Looking at the 'point & figure' chart on Grainger from StockCharts.com, we can see a chart of impressive strength. After a small correction in April, 2010, from $112/share to a level of $94/share in June, 2010, the stock has soared steadily to its current level of $214.81. If anything, the chart suggests the stock may well be a bit ahead of itself and ripe for a retesting of support levels at the $170 level.
Recently, the IBD reported how W.W. Grainger (GWW) and Fastenal (FAST) as well as Home Depot and Tractor Supply (TSCO) could well benefit from an economic rebound as they are all involved in the 'nuts and bolts' of business growth.
While the economic recovery in America is far from certain, there are signs that America is turning around from recession at least into slow growth. With things picking up, I would have to second the idea that Grainger (GWW) might be a good place to put one's investment dollars. That certainly was what I did in my own portfolio.
Grainger has a broad range of products serving multiple industries, reported strong February sales figures, came in with a very healthy quarterly report that exceeded expectations and has a track record of growth going back several years at least. They have a solid balance sheet and are generating increasing free cash flow while reducing their outstanding shares. These factors generally bode well for shareholders.
Valuation-wise, the company is priced a bit rich with a P/E north of 23, but if growth continues as expected (or perhaps exceeding expectations), this will work out to a PEG just over 1.5 for a relatively reasonable valuation. The company has a lot of shares out short possibly setting itself up for a squeeze if they continue to do well.
Technically, the shares have been extremely strong without even a suggestion of weakness for the past 2+ years. That enough should make you a little cautious. But I would rather invest in stocks showing persistence of price momentum than the alternative.
Thanks again for stopping by and visiting my blog! If you have any comments or questions, please feel free to leave them right here.
Yours in investing,
Bob
Wednesday, 28 March 2012
A Reader Writes "Is it time to take some profits on Costco?"
Hello Friends! Thanks so much for stopping by and visiting my blog, Stock Picks Bob's Advice! As always, please remember that I am an amateur investor so please remember to consult with your professional investment advisers prior to making any investment decisions based on information on this website.
I received an interesting series of questions today from a reader of mine who wrote:
 "Noticed that Costco is flirting with a new 52-week high and has delivered about 22% over the last year and 7% or so YTD. It's a hugely important stock to a lot of investors. Is it time to take some profits on Costco? If no, why not? How does the stock look from a valuation basis at this point? What new initiatives does management have underway that warrant watching? How does Costco stack up with its competitive set at this point? What does Costco's strong performance say about consumer sentiment?"
That is quite a few questions at once! But let's take a look at some of these and let's see if I can address them.
Let's first look at the stock chart. Here is the 'point & figure' chart from Stockcharts.com on Costco (COST):
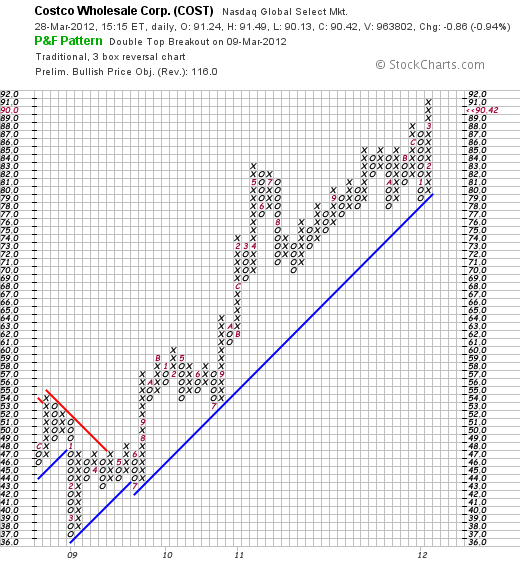
One of the things that leads me to sell a stock is technical weakness which for me is a chart that looks like it is breaking its presumed upward trend. There is nothing in the Costco chart above to my amateur eyes that appears to demonstrate anything except continued upward price momentum since bottoming at around $37 in March, 2009. As I write, COST is trading at $90.42 down $(.87) or (.95)% on the day. The stock appears to be trading well within its trading range on the chart above.
 Costco was just recently added to my Covestor 'Buy & Hold' portfolio on March 7, 2012, at a price of $87.30, just a couple of points below its current price of $90.42. In general, I do not start 'taking profits' until I have a significant gain resulting in an oversized position within a portfolio. For me, a significant gain, which I do not have yet, is in the ballpark of a 30% price appreciation.
The reader asks about 'valuation'. According to Yahoo, Costco (COST) currently has a P/E of 26.35, a PEG of 1.79, and a Price/Sales ratio of 0.42. Over the past 5 years, Costco has carried a P/E ranging from 15.62 to 27.51 with an average p/e of 23.06. Thus at least historically, the P/E is a bit rich but not wildly overvalued.
In absolute terms, we can utilize the PEG ratio (called the "Fool Ratio" on Motley Fool) to determine if we are overpaying for a growth stock. This can also help us determine if we might wish to sell some of our Costco stock if it appears 'overvalued'. In this case the PEG is 1.79, above my own preferred range of 1.0 to 1.5. (Motley Fool even suggests we consider shorting a stock at this level!)
Another way to consider valuation is in terms of the Price/Sales ratio. Each 'industrial group' of stocks may have its own way of valuing sales. Back in 2005, Paul Sturm wrote a great article on valuing companies by their relative P/S ratio.
As Sturm wrote:
"Price/sales analysis can be particularly useful when comparing companies in the same industry. Take supermarkets. P/E ratios are all over the aisle. But the big three (Albertsons, Kroger, Safeway) sell for nearly identical P/S ratios of 0.24."
But what are the competitors to Costco?
According to the NASDAQ website, Costco's competitors include Amazon (AMZN), Big Lots (BIG), Dollar General (DG), Dollar Tree (DLTR), Family Dollar (FDO), Kohl's (KSS), Target (TGT) and Wal-Mart Stores (WMT) among other.
Recalling that Costco (COST) has a P/E of 26.35, and a P/S of .42, the others have--
Amazon (AMZN): P/E of 147.14, P/S of 1.94
Big Lots (BIG): P/E of 15.37, P/S of 0.58
Dollar General (DG): P/E of 20.79, P/S of 1.04
Dollar Tree (DLTR): P/E of 23.42, P/S of 1.67
Family Dollar (FDO): P/E of 18.07, P/S of 0.79
Kohl's (KSS): P/E of 11.35, P/S of 0.64
Target (TGT): P/E of 13.58, P/S of 0.56
Wal-Mart (WMT): P/E of 13.52, P/S of 0.47
Certainly, from the Price/Sales ratio perspective Costco (COST) is the least expensive of the group even though the P/E and the PEG are a bit rich.
In terms of the company's prospects, Zacks Equity Research recently commented on Costco's "Steady Start in 2012". Pointing out that even removing the effects of higher gas prices and currency fluctuations, the company is reporting same store sales growth of 7%, a very strong performance.
As the Zacks report concludes:
"Given the pros and cons, we maintain our long-term “Neutral” recommendation on the stock. However, Costco holds a Zacks #2 Rank that translates into a short-term “Buy” rating."
The company operates
"...600 warehouses, including 433 in the United States and Puerto Rico, 82 in Canada, 32 in Mexico, 22 in the United Kingdom, 13 in Japan, 8 in Taiwan, 7 in Korea, and 3 in Australia."
Certainly, there are opportunities for growth internationally as well as domestically with both same store improvements and new locations for new warehouse operations.
On the latest quarter conference call, Costco management pointed out some of their initiatives including a greater presence on the internet with Costco.com, an app for the smartphones, and the opening of 17 new units this year.
 At least in the United States, the consumer is 'alive' and if not 'well' at least recovering as these latest numbers report with US retail sales posting their biggest gain in five months in February, 2012.
Costco (COST) with their upscale warehouse sales appeals to the middle class consumer who is still looking for value to stretch their still-limited dollars.
To summarize, personally I never know when a stock is overpriced as stocks tend to trade much higher than arbitrarily set 'true value'. Similarly, many stocks will trade much lower than values would suggest. While COST appears a bit rich in valuation in terms of P/E and PEG at least historically, in terms of Price/Sales it is a great value relative to its competitors. The company is performing well and growing its sales with same store sales in the high single digits being reported this year.
Technically the stock appears strong with no evidence of deterioration at least from my amateur perspective looking at the 'point & figure' chart.
I do believe that it is wise to take portions of oversized profits 'off the table' when they are present. In other words, it is prudent to sell your gaining stocks slowly and partially and your losing stocks quickly and completely. I do not have a large gain in this stock as my current holding is only literally days old. As the economy continues to recover I suspect that Costco will also continue to grow its business as it appears to be in a relatively recession-resistant position in the retail category.
I hope that I have addressed some of the issues you were considering with your questions on Costco (COST). If not, let me know if you have further thoughts on 'what to do'. I cannot predict the future nor know when a long-term peak in a stock price has been reached, when it is time to sell a position, and when it is necessarily the right time to keep holding. I do my best to assemble a group of stocks in a portfolio with charts that look optimistic, fundamentals that appear promising and valuation that is at least reasonable.
Yours in investing,
Bob.
Posted by bobsadviceforstocks at 3:34 PM CDT
|
Post Comment |
Permalink
Updated: Wednesday, 28 March 2012 7:27 PM CDT
Tuesday, 27 March 2012
DXP Enterprises (DXPE)
Hello Friends! Thanks so much for stopping by and visiting my blog, Stock Picks Bob's Advice! As always, please remember that I am an amateur investor, so please remember to consult with your professional investment advisers prior to making any investment decisions based on information on this website.
 This past month I added DXP Enterprises (DXPE) to my Covestor Buy and Hold Model. This stock has shown tremendous technical strength since the purchase on March 16, 2012 at a cost of $42.90. DXPE closed today (3/2712) at $44.47, down $(.68) or (1.51)% on the day.
DXP has been 'strong out of the gate' for me, yet it is not what I would consider a well-known stock. Let's take a closer look at this investment.
According to the Yahoo "Profile" on DXPE, this company
"...engages in distributing maintenance, repair, and operating (MRO) products, equipment, and services to industrial customers in the United States. Its Service Centers segment provides MRO products, equipment and services, including technical design expertise and logistics capabilities to industrial customers with the ability to provide same day delivery. This segment’s product categories comprise rotating equipment, bearing, power transmission, hose, fluid power,  metal working, industrial supply, and safety products; and services consist of field safety supervision, in-house and field repair, and maintenance services. The company’s Supply Chain Services segment manages the supply-chain of its customers from various industries."
and
"DXP Enterprises, Inc. distributes its products and services through service centers and distribution centers to customers in the oil and gas, food and beverage, petrochemical, transportation, mining, construction, chemical, municipal, agriculture, pulp and paper, and other general industrial industries."
On February 29, 2012, DXP Enterprises announced their fourth quarter 2011 results. The company reported net income of $9.2 million or $.61/diluted share for the quarter which represented a sequential increase of 10.9% from the prior quarter when it reported earnings of $.55/share with $8.3 million in net income.
During the prior year 2010 same quarter, the company had $5.9 million of income or $.39/diluted share for a year-over-year increase of 56.4% on a per share basis.
For the full year, the company reported net income of $31.4 million or $2.08/diluted share which was a 57.6% over the prior year's result of net income of $19.4 million and earnings of $1.32/share.
Sales for the fourth quarter 2011 increased 28.7% from $169.7 million in 2010 to $218.4 million in 2011. For the full year,
Sales grew 23.0% to $807 million from $656.2 million the prior year.
These are terrific numbers of growth both for the quarter and the full year. Even more impressive was the fact that the company beat expectations. As Motley Fool reports, expectations for revenue was $209.8 million and the company came in at $218.4 million. In addition, earnings came in at $.61/share ahead of the S&P Capital IQ estimates of $.53/share.
Examining the Morningstar Financials on DXPE, we can see that revenue has grown somewhat unevenly from $445 million in 2007 to $807 million in 2011. Earnings have also been a bit erratic with a big dip to a loss of $(3.24) share in 2009. Otherwise, earnings have grown from $1.36/share in 2007 to $2.08/share in 2011. Diluted outstanding shares have increase from 13 million in 2007 to 15 million in 2011.
Free cash flow has also improved from $(2) million in 2007 to $22 million in 2011. Morningstar shows that the company has $239 million in current assets and only $134 million in current liabilities yielding a healthy current ratio of 1.78.
Yahoo "Key Statistics" on DXPE shows that this is a small cap stock with a market capitalization of only $623.36 million. The company has a moderate P/E of 21.42 with a more reasonable forward P/E of 14.73 (fye Dec 31, 2013). With the company expected to continue to show rapid growth the PEG ratio of 0.64 (5 yr expected) reveals that the valuation relative to growth is quite reasonable.
DXPE has only 14.13 million shares outstanding with only 8.72 million that float. Currently there are 335,950 shares out short (as of 2/29/12) with a short ratio of 4.40 slightly ahead of my own 3 day rule for significance. No dividends are paid and the last stock split was a 2:1 split on October 1, 2008.
Inspecting the StockChart 'point & figure' chart on DXPE we can see that the company appreciated steadily from a low of $9 in March, 2009 to $27 in July, 2011. After correcting to $17 in October, 2011, the stock price has soared to its current level of $44.47 without any significant pullback. Certainly it appears a bit over-extended but the stock rise is nothing short of incredible.
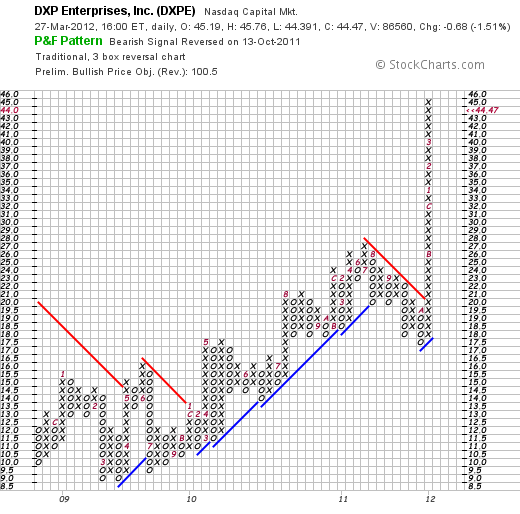
In summary, I own shares of DXPE that I have recently purchased in light of incredible technical strength, outstanding earnings (although longer-term earnings and sales have been a bit erratic), and valuation that is quite reasonable with a PEG under 1.0. Their balance sheet is solid and the company is generating plenty of free cash flow.
With the sharp rise, I expect a short-term correction as the stock price needs to consolidate. However, as the economy appears to be rebounding (although somewhat weakly), this industrial company appears well-positioned for infrastructure spending as well as spending for equipment for oil pipeline pumping, firewater and potable water pumping.
Thank you again for stopping by and visiting my blog. If you have any comments or questions, please feel free to leave them here and I shall try to respond as able.
Yours in investing,
Bob
Wednesday, 21 March 2012
Liquidity Services (LQDT)
Hello Friends! Thanks so much for stopping by and visiting my blog, Stock Picks Bob's Advice! As always, please remember that I am an amateur investor, so please remember to consult with your professional investment advisers prior to making any investment decisions based on information on this website.
 One of the top performing stocks in my "Buy and Hold" Model on Covestor is Liquidity Services. And I believe I owe it to you the readers of this blog a few words about this holding. Liquidity Service (LQDT) closed at $46.23 today, down $(.07) or (.15)% on the day. Liquidity is a top-ranked stock on the IBD 50 published each Monday by Investor's Business Daily.
According to the Yahoo "Profile" on LQDT, the company
"... operates various online auction marketplaces for surplus and salvage assets in the United States. Its auction marketplaces include liquidation.com, which enables corporations and selected government agencies located in the United States to sell surplus and salvage consumer goods and capital assets...."
Recently Zacks ranked Liquidity Services as a "Buy" based on outstanding earnings reports but pointed out that the stock is far from a 'cheap' selection with PE's in the mid 30's above the industry average in the low teens.
On February 1, 2012, Liquidity Services reported that in the fiscal 2012 first quarter net income came in at $9.1 million or $.28/share, up 550% from $1.4 million or $.05/share the prior year. Revenue climbed 35% to $106 million from $.75.5 million the prior year. The company beat expectations on revenue that was expected by eight analysts polled by S&P at $102.6 million. Similarly the company beat the $.27 expected by analysts for earnings.
Reviewing the longer-term results from Morningstar.com, we can see that except for a dip between 2008 and 2009, revenue has grown strongly from $199 million in 2007 to $327 million in 2011 and $358 million in the trailing twelve months (TTM). Earnings have been erratic with $.39/share reported in 2007, climbing to $.41/share in 2008 before dipping to $.21 in 2009. Earnings rebounded to $.44/share in 2010, dipped to $.29/share in 2011 and climbed again sharply to $.54/share in the TTM. Dilouted shares outstanding has been relatively stable at 28 million shares in 2007 and 30 million in the TTM.
Morningstar reports the company with $171 million in total current assets and $60 million in total current liabilities resulting in a current ratio near 3. Free cash flow has grown nicely from $2 million in 2007 to $35 million in 2011 and $41 million in the TTM.
Looking at Yahoo "Key Statistics" on LQDT for some valuation numbers we first can see that this is a small cap stock with a market capitalization of only $1.42 billion. The stock has a very rich p/e of 86.74 but it so quickly growing that the forward p/e (fye Sep 30, 2013) is estimated at only 28.54. Thus, with the rapid growth in earnings expected, the PEG (5 yr expected) works out to a reasonable value of 1.34 despite the rich current trailing p/e!
Yahoo reports 30.65 million shares outstanding with 21.37 million that float. Currently there are 1.7 million shares out short (as of 2/29/12) yielding a short ratio of 2.90---just under my own 3 day rule for significance of short interest. The company does not pay a dividend and no stock splits are reported.
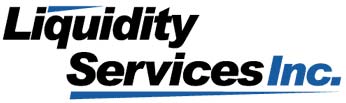
What is so attractive to me is the price chart of this stock. Like many investors who work hard to identify potential 'winners' I have come to appreciate the beauty of a stock chart like this one that shows a 3 year price appreciation from a low of $4.75/share in February, 2009, to its current levle of $46.23 with nary a correction in the movement. Here is the 'point and figure' chart on Liquidity Services from StockCharts.com:
Liquidity Services (LQDT) is a star holding in my portfolio. It is richly priced in terms of trailing p/e but the PEG ratio under 1.5 suggest reasonable valuation for the sharply increasing earnings reported. The balance sheet is sound with the company reporting growing free cash flow and revenues while earnings have been less than consistent. Technically the chart is gorgeous with a 45 degree line that I like to see that starts low on the left side of the chart and higher on the right side!
Thank you again for visiting my blog! If you have any comments or questions, please leave them here. I do not post as often as I would like. But I haven't forgotten about all of you and I appreciate your continued loyalty.
Yours in investing,
Bob
Sunday, 22 January 2012
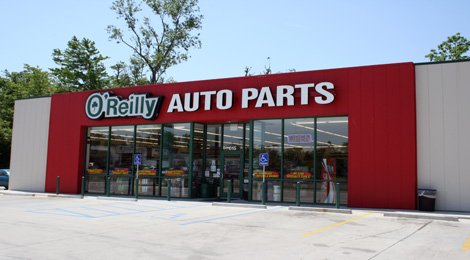
O'Reilly Automotive (ORLY)
Hello Friends! Thanks so much for stopping by and visiting my blog, Stock Picks Bob's Advice! As always, please remember that I am an amateur investor, so please remember to consult with your professional investment advisers prior to making any investment decisions based on information on this website.
 I have recently written up two auto parts chains: Genuine Parts (GPC) and Autozone (AZO). Genuine Parts is a holding in my Covestor "Buy and Hold" Model, I also have a very small position (2 shares) of Autozone (AZO) but I do not own any shares of O'Reilly (ORLY). ORLY closed at $82.28 on 1/20/12, down $(2.50) or (2.95)% on the day.
Simply put, this entire group of stocks has been doing quite well in the market reflecting, I believe, the underlying strength of their business. People are owning their vehicles longer than ever and they are thus repairing them more often to keep them on the road. As this article points out:
"...the age of the cars and trucks we’re driving has hit an all-time high. Here’s the breakdown
- 2011: 10.8 years vs. 10.6 years in 2010
- Average car in US 11.1 years old vs. 11.0 in 2010
- Average truck in US is 10.4 years old vs. 10.1 in 2010
- There are now 240.5 million vehicles in the US - up nearly 500,000 from 2010"
Since what caught my attention first was the underlying performance of the stock let's take a look at the 'point & figure' chart on O'Reilly from StockCharts.com.
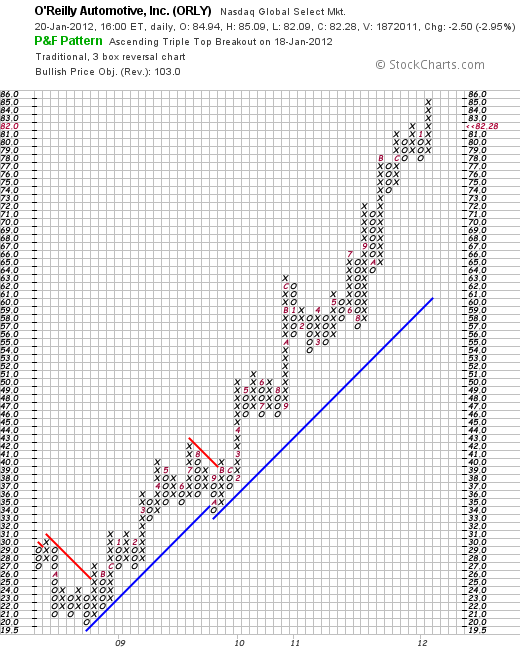
What can you say about such a gorgeous price chart except that the stock may be getting a bit ahead of itself. And no I do not own any shares although I am kicking myself for not buying shares in late 2008 when the stock was trading about $20. Of course, the bigger question is what the stock is likely to do in the future. Let's take a closer look.
 On October 27, 2011, O'Reilly Automotive reported 3rd quarter results. Net income for the company came in at $148.4 million or $1.10/share, up from $116.5 million, or $.82/share the year earlier. Revenue increased 7.7% to $1.54 billion from the year earlier period. These results exceeded analysts expectations of $1.00/share on revenue of $1.51 billion.
In terms of longer-term results, reviewing the Morningstar.com financials on ORLY we can see that revenue has grown steadily from $2.3 billion in 2006 to $5.4 billion in 2010 and $5.7 billion in the trailing twelve months (TTM). Diluted earnings per share have not been quite as consistent increasing from $1.55 in 2006 to $1.67/share in 2007 before dipping to $1.48 in 2008. Earnings climbed to $2.95/share in 2010 and have come in at $3.45/share in the TTM. During this period, the company has increased outstanding shares from 115 million in 2006 to 142 million in 2010 and 141 million in the TTM.
Looking at the balance sheet on Morningstar for O'Reilly, we see that in the latest period the company had $2.3 billion in current assets and only $1.2 billion in current liabilities for a current ratio of nearly 2. From my perspective a current ratio of over 1.5 indicates strong financial health at least for the short-term.
Free cash flow as reported by Morningstar has been relatively unimpressive until recently. The company has $(43) million in free cash flow in 2006, dipped to an even larger negative $(130) million in 2009, came in at $338 million in 2010 and $619 million in the TTM.
Reviewing the Yahoo "Key Statistics" on O'Reilly, we can see that the company is a large cap stock with market capitalization of $10.58 billion. The trailing p/e is a moderate 23.68 with a forward p/e of only 18.79 (fye Dec 31, 2012). The PEG ratio (5 yr expected) comes in at an acceptable 1.33.
Yahoo reports that there are 128.3 million shares outstanding with 123.6 million that float. Currently there are 3.53 million shares out short with a short interest ratio of 4.20 slightly ahead of my own 3 day rule for significance. The company does not pay a dividend and last split its stock June 16, 2005, when it declared a 2:1 split.
What do I think? Well I like this stock and would buy shares if the opportunity arose. Currently I have a position in GPC and a very small holding of AZO. However, Barrons recently gave O'Reilly a nice mention discussing the T. Rowe Price New Horizons Fund, and manager Henry Ellenbogen who has O'Reilly as the largest single holding representing 2.3% of the fund.
The company is sitting in an area that may well continue to resist economic weakness, has terrific technical strength, same store sales growth remains solid at 4.8% in latest reported quarter, valuation is reasonable and financials appear solid with a strong current ratio and growing free cash flow. The only consideration is that the stock may simply be a bit ahead of itself currently and may pull back over the short-term.
Thanks again for visiting! If you have any comments or questions, please feel free to leave them on the blog!
Yours in investing,
Bob
Wednesday, 11 January 2012
Fastenal (FAST)
Hello Friends! Thanks so much for stopping by and visiting my blog, Stock Picks Bob's Advice! As always, please remember that I am an amateur investor, so please remember to consult with your professional investment advisers prior to making any investment decisions based on information on this website.

Fastenal (FAST) is a holding of mine in my Covestor 'Buy & Hold Value' model. I own shares with a cost basis of $41.83. Fastenal closed today (1/11/12) at $45.22, up $.21 or .47% on the day.
I most recently wrote up Fastenal (FAST) on April 12, 2007, when the stock was trading at $38.27, which actually works out to $19.14/share, when adjusted for a 2:1 stock split on May 23, 2011.
Let's take a closer look, one could say I suppose let's get down to 'nuts and bolts' on this company!
According to the Yahoo "Profile" on Fastenal, the company
 "... Is Engaged As A Wholesaler And Retailer Of Industrial And Construction Supplies. The Industrial And Construction Supplies Were Grouped Into Ten Product Lines: Fasteners, Tools And EquipmeNt, Cutting Tools And Abrasives, Hydraulics, Pneumatics, Plumbing And Hvac, Material Handling, Storage And Packaging, Janitorial Supplies, Chemicals And Paints, Electrical Supplies, Welding Supplies, Safety Supplies And Metals, Alloys And Materials."
On October 13, 2011, Fastenal (FAST) announced 3rd quarter results. Sales for the quarter rose 20% to $726.7 million from $603.8 million the year earlier. Earnings came in at $.33/share, up 29% from the prior year's $.25/share result. The company met expectations as analysts had been expecting earnings of $.33/share according to FactSet. The company beat expectations on revenue as analysts had been expecting $721.6 million in sales.
Longer term, reviewing the Morningstar.com "Financials" on Fastenal, we can see that revenue growth was steady between 2006 and 2008 from $1.8 billion to $2.34 billion. However, sales dipped to $1.93 billion in 2009 before once again turning higher and coming in at $2.27 billion in 2010 and $2.64 billion in the trailing twelve months (TTM).
Earnings, similarly, grew from $.66/share in 2006 to $.94 in 2008 before dipping to $.62 in 2009. Earnings rebounded in 2010 at $.90/share and increased to $1.14/share in the TTM.
Outstanding shares have trended lower with 302 million shares in 2006 and 296 million in the TTM.
Briefly examining the Morningstar.com figures on the Fastenal Balance Sheet, we find that the company has $1.09 billion in current assets and only $162 million in current liabilities yielding a very strong current ratio of 6.7. Per Morningstar, Free Cash Flow has grown from $20 million in 2006 to a peak of $254 million in 2009. During the trailing twelve months, the company reported $145 million in free cash flow.
In terms of valuation, examining the Yahoo "Key Statistics" on Fastenal (FAST), we see that the company is a large cap with a market capitalization of $13.35 billion. The trailing p/e is rich at 40.02 with a forward p/e of 32.07. The PEG ratio of 2.19 confirms the price premium being paid for this stock. Generally I prefer to pay for growth only with ratios between 1.0 and 1.5.
According to Yahoo, there are 295.20 million shares outstanding with 23.54 million shares out short as of 12/15/11. This works out to a short interest ratio of 11.50, well above my own '3 day rule' for significance. Thus, there are a lot of shares already sold by short-sellers who are expecting the stock to decline in price. However, if the company outperforms expectations, and the stock rises, these short-sellers might scramble to cover pushing the stock price higher in a 'squeeze'. Just saying.
The company is paying a $.56/share forward dividend yielding 1.2%. The payout ratio is 63% meaning the company is paying out nearly 2/3 of its earnings in the form of dividends to share-holders. As I noted above, the company last split its shares on May 23, 2011, in the form of a 2:1 stock split.
Reviewing the StockCharts.com 'Point & Figure' chart on Fastenal (FAST), we can see that the stock bottomed in March, 2009, about the same time that financials were bottoming, at about $12.50/share. Since that time, the stock has been very strong climing to a recent price of $45.22.
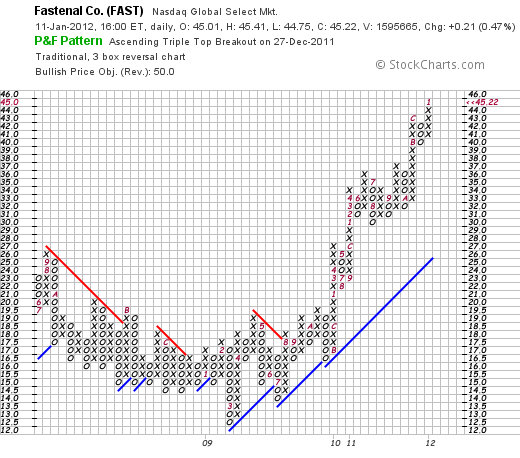
Clearly this has been a very strong stock to own the past several years. And even more so longer-term!
However, the stock is richly priced and one must wonder whether a correction is needed to restore a better balance between earnings, earnings growth, and the stock price. Just today, Bloomberg reported that Fastenal had 21.5 million shares out short as of December 30, 2011, down 1.5 million shares from the December 15th numbers. However, with average trading volume of only 1.5 million shares, this still represents over 6 weeks of volume to cover.
Motley Fool jumped in on the skeptic bandwagon with a recent article listing Fastenal as one of the "5 Great Companies That'll Disappoint Investors" again based on the price/value premium to the market.
However, Zacks last week came out with a "Buy" rating on Fastenal based on the strong price performance and "bullish growth projections". Furthermore, a recent Seeking Alpha article pointed out that at least one insider, a director, made a purchase of about 10,000 shares in December. The Investor's Business Daily explained that with the apparent beginning of a housing rebound in December, housing and construction-related companies might begin to see upturns in their business.
Where do I stand? Well, I own shares of the stock. Valuation is indeed rich, but the track record of this company is hard to beat. Long-term I believe the prospects remain bright for Fastenal (FAST). Shorter-term, I would not be surprised to see increased volatility with profit-taking on perceived bad news as well as short-covering keeping the upward pressure on the stock price.
Thanks so much for stopping by! Please feel free to leave comments or questions right here.
Yours in investing,
Bob
Wednesday, 28 December 2011
Genuine Parts (GPC)
Hello Friends! Thanks so much for stopping by and visiting my blog, Stock Picks Bob's Advice! As always, please remember that I am an amateur investor, so please remember to consult with your professional investment advisers prior to making any investment decisions based on this website.
Like so many of you, I also struggle to find reasonable investments in a very turbulent market. For me reasonable has become an understandable company with understandable products, decent earnings and valuation, good technicals and possibly a dividend to help stabilize the stock price.
 I recently purchased shares of Genuine Parts (GPC) for exactly those reasons at a cost basis of $58.16. GPC closed today (12/28/11) at $61.44, down $(.47) or (.76)% on the day. This stock is part of my Covestor 'Buy and Hold' Model.
The stock was noted as one of the new "Dividend Aristocrats" by TheStreet.com. According to this article, to make this the company must have:
"... a 10-year history of rising payouts, a 2011 earnings coverage rate of at least 2, and implied coverage rates of at least 2 for 2012 and 2013 based on current consensus earnings estimates."
Richard Shaw, a Seeking Alpha contributor, recently included GPC asone of "5 GARP Stocks With Yield And In An Upward Price Pattern."
Clearly I am not alone in my interest in this particular investment. Let's take a little closer look at this company and shall share with you my own perspective on this apparent favorite.
According to the Yahoo "Profile" on Genuine Parts (GPC), the company
"...distributes automotive replacement parts, industrial replacement  parts, office products, and electrical/electronic materials in the United States, Puerto Rico, Canada, and Mexico. The company operates in four segments: Automotive Parts Group, Industrial Parts Group, Office Products Group, and Electrical/Electronic Materials Group."
Perhaps more importantly, this company"...owns and operates automotive parts distribution centers and automotive parts stores under the NAPA name."
Looking at the latest earnings report, on October 18, 2011, GPC announced 3rd quarter results. Revenue for the quarter came in at $3.3 billion up 18% and ahead of expectations of $3.2 billion according to Thompson Reuters. Net income was $151.8 million or $.97/share ahead of the $131.8 million or $.83/share the prior year same period. Analysts had been expecting earnings of $.94/share.
Review of the financials from Morningstar.com shows that revenue has shown a relatively modest rise from $10.5 billion in 2006 to $11.2 billion in 2010 and $12.2 billion in the trailing twelve months. Similarly diluted earnings per share have increased from $2.76 in 2006 to $3.00 in 2010 and $3.47 in the TTM. The company has been steadily buying back shares with 172 million outstanding in 2006 and only 158 million reported in the TTM.
Morningstar Balance Sheet on GPC shows the company with $4.4 billion in current assets and only $2.0 billion in current liabilities yielding a healthy current ratio of 2.2. In terms of the free cash flow, Morningstar shows GPC with $307 million in free cash flow in 2006 and $593 million in 2010 and $517 million in the TTM. While not steadily increasing, this company spins off over $500 million of free cash flow yearly.
Looking at some valuation numbers from "Key Statistics" on Genuine Parts from Yahoo, we can see that this stock is technically a mid cap stock with a market capitalization of $9.56 billion. The trailing p/e is a moderate 17.71 with a PEG ratio (5 yr expected) of 1.94. The company has 155.65 million shares outstanding. As of 11/30/11 there were 5.17 million shares out short with a short ratio of 6.10, ahead of my own arbitrary '3 day rule' of short interest. While that may mean that there are a lot of investors that are betting against this stock, assuming they don't know more than we do, with the stock price rising, they will need to 'cover their shorts' leading to possibly more buying pressure or a 'short squeeze'.
According to Yahoo, the company has a forward annual dividend of $1.80/share yielding a very healthy 3.00%. The company has a payout ratio of 51% suggesting good coverage of the dividend and the company last split its stock in April, 1997 with a 3:2 stock split.
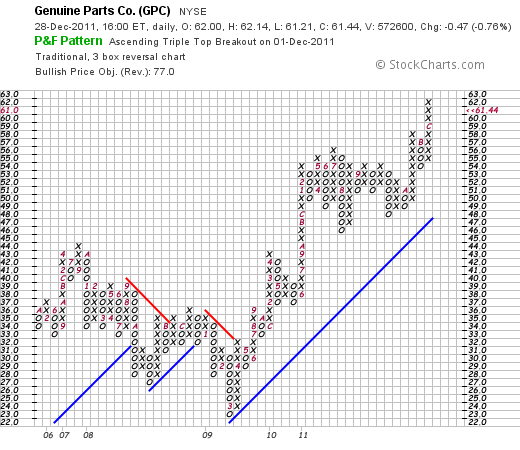
Looking at the StockCharts.com 'point & figure' chart on GPC, we can see a steady rise in price from a low of $23 in March, 2009, to its current price level of $61.44. The chart appears quite strong but not, in my amateur perspective, getting 'ahead of itself' with a recent period of consolidation from December, 2010 to October, 2011, when it broke out higher in price. I like the chart.
Genuine Parts (GPC) works for me. I appreciate what I like to think of the somewhat added security of an increasing dividend in a stock that appears to have recently been exceeding expectations on earnings and revenue growth, shows reasonable if not cheap valuation, and strong technical performance. In today's difficult market and relatively anemic economy, I can understand an auto parts company that helps support people hanging on to their vehicles longer than ever and looking to repairs instead of a new car purchase.
Thank you so much for stopping by and visiting! If you have any questions or comments please feel free to leave them right here.
Yours in investing,
Bob
Posted by bobsadviceforstocks at 8:16 PM CST
|
Post Comment |
Permalink
Updated: Wednesday, 28 December 2011 10:04 PM CST
Saturday, 19 November 2011
Nu Skin Enterprises (NUS)
Hello Friends! Thanks so much for stopping by and visiting my blog, Stock Picks Bob's Advice! As always, please remember that I am an amateur investor, so please remember to consult with your professional investment advisers prior to making any investment decisions based on information on this website.
I regret that I do not blog quite as often now as I have in the past. I continue to work to write as I really enjoy sharing ideas with all of you. My own strategy for selection remains essentially unchanged. I continue to look for stocks of companies with strong fundamentals and strong price performance. Aren't we all doing that?
 I recently added Nu Skin (NUS) as a holding in my Covestor "Buy and Hold Value" model. My shares were acquired with a cost basis of $44.47; Nu Skin (NUS) closed at $47.22 onNovember 18, 2011, up $.63 or 1.35% on the day.
According to the Yahoo "Profile" on Nu Skin (NUS), the company
"...develops and distributes anti-aging personal care products and nutritional supplements worldwide. The company sells its personal care products under the Nu Skin brand; and nutritional supplements under the Pharmanex brand. Its personal care product line includes core systems, targeted treatments, total care, cosmetic, and Epoch, a product formulated with botanical ingredients. The company's nutritional supplements product line comprises micronutrient supplements, targeted solution supplements, and weight management products. It also sells Vitameal, which are nutritious meal products for starving children or purchased for personal food storage."
On November 16, 2011, Nu Skin raised guidance on 4th quarter  results with earnings now expected to come in between $.68 and $.72/share above the prior guidance of $.66 to $.70/share. In addition, the company raised 2012 revenue guidance to a range of $1.8 to $1.83 billion. Analysts have been expecting 4th quarter earnings of $.70/share (in line with the new company guidance) and revenue of $1.7 billion, under what the company now believes achievable.
On October 25, 2011, the company reported 3rd quarter results. Net income climbed 32% to $46.8 million or $.72/share from $35.3 million or $.55/share the prior year. This result beat expectations as analysts had been expecting income of $.61/share. Revenue for the quarter increased 12% to $428.4 million ahead of last year's $383.6 million. This result also beat expectations by analysts of revenue of $414.4 million. The strongest region for this company was "Greater China" where revenue climbed 32% to $83.4 million.
Reviewing the Morningstar review of Nu Skin "Financials", we can see that revenue has increased from $1.12 billion in 2006 to $1.54 billion in 2010 and $1.65 billion in the trailing twelve months (TTM). During this same period diluted earnings per share have increased steadily from $.45/share in 2006 to $2.11/share in 2010 and $2.19/share in the TTM. Outstanding shares have declined from 71 million in 2006 to 64 million in the TTM.
In terms of the balance sheet, Morningstar has NUS with total current assets of $423 million, and total current liabilities of $216 million. This yields a very healthy current ratio of 1.96. (Over 1.5 is great from my perspective!)
Morningstar reports that the free cash flow has improved from $38 million in 2006 to $134 million in 2010 and $124 million in the TTM.
In terms of valuation, examining the Yahoo "Key Statistics" on NUS, we can see that the company is a mid cap stock with a market capitalization of $2.94 billion. The trailing p/e is a moderate 21.56 with a forward p/e (fye Dec, 31 2012) estimated at 16.12. With rapid growth in the past and expected in the future, the PEG (5 yr expected) works out to a reasonable 1.30.
Yahoo reports 62.16 million shares outstanding with 54.01 million that float. As of 10/31/11 there were 4 million shares out short with a short interest ratio of 4.5 slightly ahead of my own arbitrary '3 day rule'.
The company pays a forward dividend of $.64/share yielding a not-insignificant 1.4%. The company has a payout ratio of 25%. No prior stock splits are reported on Yahoo.
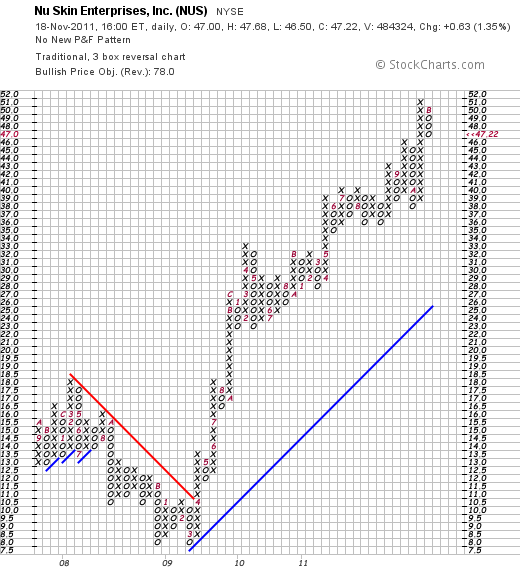
Reviewing the 'point & figure' chart on Nu Skin (NUS) from StockCharts.com, we can see that the stock declined to a low of $8.00/share in March, 2009, from a recent high of $18/share in March, 2008. Since then the stock has rallied strongly to a recent price of $47.22.
To summarize, Nu Skin Enterprises (NUS) is a stock that I own in my Covestor 'Buy and Hold' model. I own this stock because of its strong technical performance, its recent financial results that exceeded expectations while also raising guidance. The company has a strong more than 5 year record of such performance. In addition, the company is just developing a business presence in 'Greater China' where it is recording much of its outstanding growth. Valuation appears reasonable and the company also pays a small but growing dividend. The chart is gorgeous with a strong price move the past 2 1/2 years. What is there not to like?
Thanks so much again for stopping by and visiting. If you have any comments or questions, please feel free to leave a comment right here.
Yours in investing,
Bob
Newer | Latest | Older


