Stock Picks Bob's Advice
Thursday, 22 September 2005
"Revisiting a Stock Pick" Comtech Telecommunications (CMTL)
Hello Friends! Thanks so much for visiting my blog,
Stock Picks Bob's Advice. As always, please remember that I am an amateur investor, so please remember to consult with your professional investment advisors prior to making any investment decisions based on information on this website.
Prior to getting to the stock pick, I must share with you my growing alarm about the horrendous damage Katrina and the imminent approach of hurricane Rita, a second category 4-5 hurricane! I find it hard to believe a mega-city like Houston could possibly be evacuated.

"Thomas, whose family was forced from home by Hurricane Katrina, at the shelter at Southern University in Baton Rouge. (Photo: Courtesy of Robert Terrell, flickr.com/photos/ratterrell/) "
Please consider a donation to the International Rescue Committee, an organization working to assist displaced peoples since 1933. For more information on the IRC, visit their website. While many of us are searching for great Katrina Stock Picks or Rita Stock Picks, let's not forget the people who are victims of these disasters, while we also consider the opportunities that redevelopment will provide!
Back to stocks!
 I was looking through the list of top % gainers on the NASDAQ today and I saw that Comtech Telecommunications (CMTL) had made the list. I do not own any shares nor do I have any options on this stock. CMTL closed at $40.65, up $3.37 or 9.04% on the day.
 According to the Yahoo "Profile" on Comtech, the company "...engages in the design, development, production, and marketing of products, systems, and services for communications solutions. It operates through three segments: Telecommunications, Transmission, Mobile Data Communications, and RF Microwave Amplifiers."
I first posted Comtech on Stock Picks on December 9, 2003, when CMTL was trading at $30.89. CMTL split 3:2 on 4/5/05, making my effective stock pick price actually $20.59. Thus, with the stock closing today at $40.65, that represents a gain of $20.06 or 97.4%.
What drove the stock higher today was the 4th quarter 2005 earnings report which was announced today just prior to the opening of trading. For the quarter ended July 31, 2005, net sales climed $39.2 million or 66.3% to $98.3 million from $59.1 million last year same quarter. Net income came in at $11.0 million or $.42/diluted share, up strongly from $6.1 million or $.25/diluted share in the previous year.
 Looking at the Morningstar.com "5-Yr Restated" financials, we can see the rapid growth in revenue from $66.4 million in 2000 to $268.7 million in the trailing twelve months (TTM).
Earnings have improved from a loss of $(.31) in 2000 to $1.28 in the trailing twelve months.
Free cash flow has also grown nicely from $6 million in 2002 to $59 million in the TTM.
Looking at the Morningstar-presented balance sheet, we can see that the company is quite solvent with $205.3 million in cash--enough to cover both the $72.4 million in current liabilities and the $110.4 million in long-term liabilities combined, with cash left over. In addition, the company has $95.1 million in other current assets.
 Looking at Yahoo "Key Statistics" on CMTL, we can see that this company is a mid-cap stock with a market capitalization of $883.04 million.
The trailing p/e is a bit rich at 31.22. Forward p/e (fye 31-Jul-06) is slightly better at 27.10. The PEG ratio is a bit steep as well at 1.80.
According to the Fidelity.com brokerage research, CMTL is a member of the "Communications Equipment" industrial group, and is priced midway in the group. At the top of the group, Qualcomm (QCOM) sports a price/sales ratio of 14.1. This is followed by Adtran (ADTN) at 5.4 and Comtech (CMTL) at 3.8. Tellabs (TLAB) comes in at 2.7, Nokia (NOK) at 1.7, and Motorola (MOT) is actually listed at "0".
Referring back to Yahoo, CMTL has 21.72 million shares outstanding. There are 2.22 million shares out short representing 10.7% of the float or 7.2 trading days worth of volume. This is significant imho using my arbitrary "3-Day" rule of short interest.
No cash dividend and the latest stock split, as noted earlier, was a 3:2 split on 4/5/05.
Looking at the Stockcharts.com "Point & Figure" chart on CMTL:
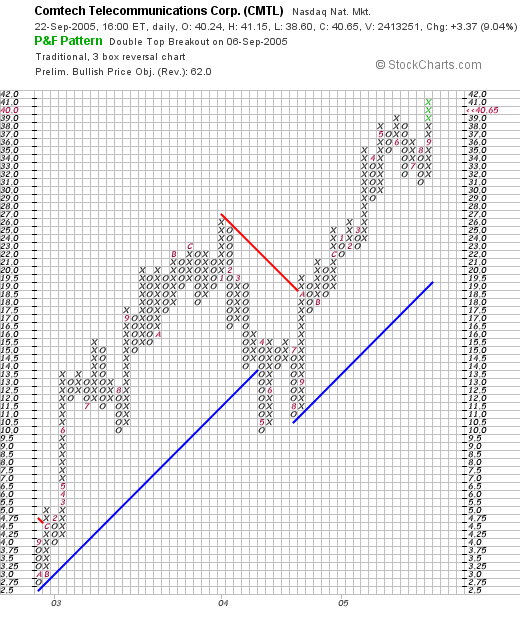
, we can see that Comtech (CMTL) has had an exceptionally strong chart, with a sharp rise from $2.75/share in April, 2002, to a peak of $26 in February, 2004. The stock sold off in May, 2004, but has traded higher since. Really a very strong stock chart!
So what do I think? Well I wish I had bought it the first time I posted it :). Otherwise, the company issued a superb earnings report today, the past five years have been quite strong, valuation appears reasonable, the company is spinning off free cash flow, and the balance sheet looks solid. Finally, the chart looks great!
Now, if I only had some cash to be buying stock :). Oh well.
Thanks so much for visiting! If you have any comments or questions, please feel free to email me at bobsadviceforstocks@lycos.com.
By the way, if you do get back to New Orleans, be sure to visit City Park where you can ride on the carousel and take in the sights and sounds of City Park.
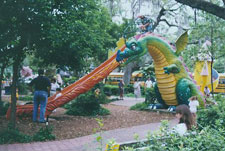
Of couse there is always Storyland for the kids!
Bob
Wednesday, 21 September 2005
September 21, 2005 FedEx (FDX)
Hello Friends! Thanks so much for stopping by and visiting my blog,
Stock Picks Bob's Advice. As always, please remember that I am an amateur investor, so please remember to consult with your professional investment advisors prior to making any investment decisions based on information on this website!
Before talking about FedEx (FDX) I wanted to share with you one more memory of mine about New Orleans that makes the City so special. These details are the small things that add up to make the New Orleans experience so special!
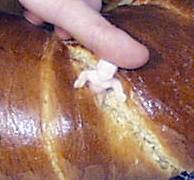
Have you ever had a piece of a King Cake?
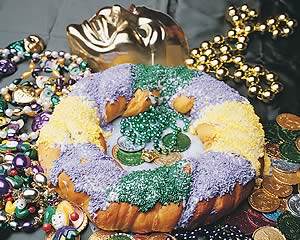
Gambino's Bakery is a major creator of King Cakes around the time of Mardi Gras. A common sight around 'break-rooms' at offices, the cake has a little plastic baby buried in the midst of the green, yellow, and purple decorated pastry. If you are unlucky enough to get the "baby", well then it is your turn to buy the next cake! Pick one up on your next visit to the 'Big Easy'!
Back to stocks.
It was not a very good day in the market today. My only stocks really bucking the trend in my Trading Portfolio, were Giant Industries (GI), the independent petroleum refiner, and Cal Dive (CDIS), the offshore salvage operator. I think you can see the picture.
 FedEx (FDX), however, moved significantly higher, making the list of top % gainers on the NYSE. I do not own any shares of FDX nor do I have any options on this stock. FDX closed at $83.15 at the close, up $6.15 or 7.99% on the day.
According to the Yahoo "Profile" on FedEx, the company "...provides a portfolio of transportation, e-commerce, and business services under the FedEx brand. The company operates in four segments: FedEx Express, FedEx Ground, FedEx Freight, and FedEx Kinko's."
 What drove the stock higher today, was the company's 1st quarter 2006 earnings report. For the quarter ended August 31, 2005, revenue came in at $7.71 billion, up 10% from $6.98 billion last year first quarter. Net income was $339 million, up 3% from $330 million last year. This worked out to $1.10/diluted share, up from $1.08/diluted share last year, a 2% increase. In addition, the company raised second quarter earnings guidance to $1.30 to $1.45/diluted share, and for the year, increased guidance to $5.25 to $5.50/diluted share. This combined news was enough to push the stock higher today in an otherwise weak market for stocks.
Looking longer-term at the Morningstar.com "5-Yr Restated" financials, we can see the nice, steady revenue growth from $19.6 billion in 2001 to $29.4 million in the trailing twelve monts (TTM).
Earnings have increased in an uninterrupted fashion from $1.99/share in 2001 to $4.72 in the TTM. The company started paying a dividend in 2003 at $.20/share and have increased that dividend in 2004 and in the TTM to $.28/share.
Free cash flow, while a bit erratic, has increased from $360 million in 2003 to $881 million in the TTM.
The balance sheet is adequate, with $1.04 billion in cash and $4.23 billion in other current assets. This is enough to cover the $4.73 billion in current liabilities, with a bit left over to help offset the $6.08 billion in long-term liabilities.
 Looking at Yahoo "Key Statistics" on FDX, we can see that the market cap of this company is a large cap level $25.16 billion. The trailing p/e is moderate at 17.62 with a forward p/e (fye 31-May-07) even nicer at 14.00. Thus, with steady growth and a reasonable p/e we have a (5 yr expected) PEG under 1.0, at 0.90.
Checking the Fidelity.com website for research for the price/sales ratio, we can see that FDX is also reasonably priced in the context of other companies in the "Air Delivery/Freight Svcs" industrial group. Leading off this group is United Parcel Service (UPS) with a price/sales ratio of 1.9, Expeditors International of Washington (EXPD) follows at 1.7, C.H.Robinson Worldwide (CHRW) is at 1.1, and FedEx (FDX) is at 0.8. Only EGL (EAGL) is cheaper at 0.4.
Reviewing some additional statistics on FDX from Yahoo, we can see that there are 302.63 million shares outstanding. As of 7/12/05, there were 4.17 million shares out short, representing 1.50% of the float or 1.5 trading days of volume. This doesn't appear too significant to me, as I arbitrarily use a 3 days worth of short interest for significance.
As noted earlier, the company does pay a dividend currently estimated for the year at $.32/share yielding 0.40%. The last stock split was a 2:1 split in May, 1999.
And what does the "Point & Figure" chart from Stockcharts.com on FDX look like?
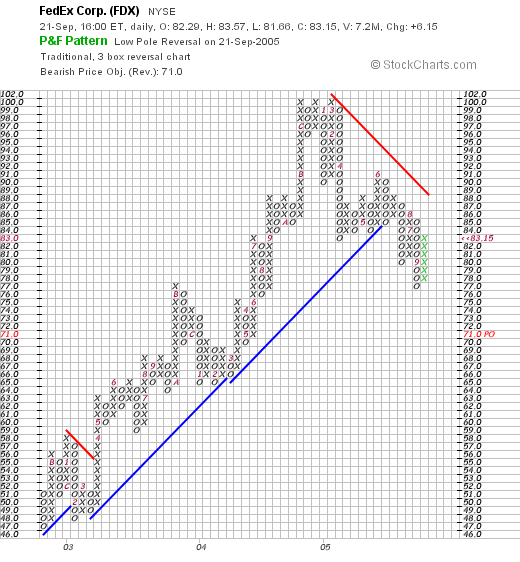
Looking at this price chart, we can see what starts out as what I would call a "gorgeous" chart, with the price moving steadily higher from $47 in July, 2002, to $102 in March, 2004. However, since that point, it really appears the stock may have "rolled over", especially when the support line (the blue line on the graph) was violated in June, 2005, when the stock slipped below $86/share. This stock needs to move above $89 to convince me that the price is truly moving higher once again!
Of concern as I write, is the climbing oil prices that has to put a damper on margins of this freight delivery company. It is interesting that the financial picture may easily be affected by persistence of these elevated fuel prices. It was reported:
Graf, the CFO, cautioned during the call that Hurricane Rita -- now a Category 4 storm -- might derail FedEx's forecast if it wreaks havoc on refining facilities and drives up fuel costs. Following close on the heels of Katrina, Rita has rolled into the Gulf of Mexico with sustained winds of 135 mph.
Unlike the beleaguered airline industry, FedEx and rival UPS (UPS:NYSE - commentary - research - Cramer's Take) so far have been able to weather fuel price increases by passing them on to customers in the form of surcharges.
So what do I think? Well, FedEx is an interesting investment idea. I do not like the current chart short-term, as some weakness is definitely being demonstrated. I also am intuitively concerned about any company so tied to fuel prices, but apparently this has not yet interfered with growth in revenue and earnings.
Otherwise, the recent quarter looks solid, valuation is nice with a PEG under 1.0, and a Price/Sales low within its industrial group. The company even pays a dividend. But I am not in the market for a stock, and even if I were, I probably would be a bit cautious around this one.
By the way,
If you get down to New Orleans during the Mardi Gras, be careful when you bite into that King Cake. You wouldn't want to have to buy another cake for the rest of your friends, and you certainly don't want to choke or swallow the plastic baby!
Bob
Saturday, 17 September 2005
"Weekend Trading Portfolio Analysis" American Medical Systems (AMMD)

Hello Friends! Thanks so much for stopping by and visiting my blog,
Stock Picks Bob's Advice. As always, please remember that I am an amateur investor, so please remember to consult with your professional investment advisors prior to making any investment decisions based on information on this website.
A few weeks ago, I decided to start reviewing the actual stocks in my
Current Trading Portfolio. On this website, I discuss many different stocks that I view as potential investments based on my own perspective on evaluating stocks that I have discussed elsewhere. Of these stocks, I have purchased 25 different companies (the maximum # of positions in my trading portfolio) and whenever I trade a stock, I try as soon as possible to post an entry called "Trading Transparency". In this way, I can share with you my actual trading decisions along with many other stock investment candidates.

Going alphabetically through my portfolio, I am still in the 'A's', and am up to American Medical Systems (AMMD). I first
posted American Medical Systems (AMMD) on Stock Picks on January 9, 2004 when it was trading at $25.96. Shortly after writing the entry, I
posted again and reported my purchase of 200 shares at $25.78. AMMD had a 2:1 stock split on 3/5/05 so my effective stock purchase price was $12.89.
On June 24, 2004, I made my first partial sale at $32.08 for a gain of $6.30 or 24.5%. That was 1/4 of my holdings, leaving 150 shares. My next sale was on December 21, 2004, when I sold 35 shares (approximately 1/4 of my 150 share position) at $40.92, for a gain of $15.17/share or 58.8%. That left 115 shares, which subsequently split 2:1 giving me my current 230 share position.
AMMD closed at $18.79 on 9/16/05, which represents a gain of $5.88 (post-split), over my cost basis of $12.91/share (including transaction costs). This is a 45.5% appreciation over the stock purchase. The stock
has retraced some of its gain since the last partial sale. If the stock continues to decline, I shall be selling all remaining shares when it reaches a 30% gain (approximately $16.78/share), or selling another 1/4 position at a 90% gain (approximately $24.53/share).
On July 28, 2005, AMMD
reported 2nd quarter 2005 results. Sales for the quarter ended July 2, 2005, grew 34% to $65.6 million, up from $49.1 million in the same quarter in 2004. Net income for the quarter was $12.0 million, up 42% from the prior year's $8.4 million, or $.17/share, up from $.12/share last year. All-in-all a solid performance for AMMD!
What about the chart? Taking a look at the
"Point & Figure" chart for AMMD from Stockcharts.com:
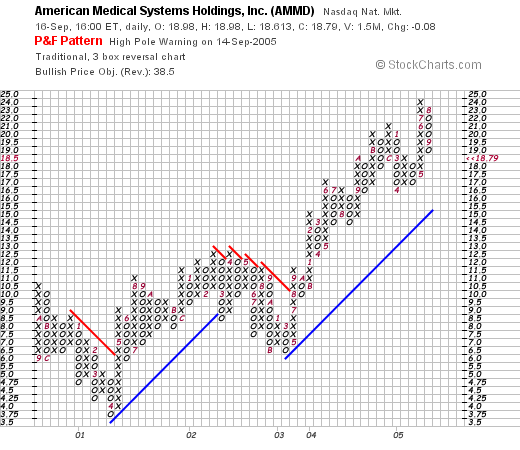
We can see that the chart looks quite strong with the price moving higher just above the blue "support line".
American Medical Systems (AMMD) appears to be a solid part of my 25 stock trading portfolio! My future action on this stock will depend on the price movement. If you have any comments or questions, please feel free to leave them right here on the blog or email me at bobsadviceforstocks@lycos.com.
Bob
"Looking Back One Year" A review of stock picks from the week of July 12, 2004

Hello Friends! Thanks so much for stopping by and visiting my blog,
Stock Picks Bob's Advice. As always, please remember that I am an amateur investor, so please consult with your professional investment advisors prior to making any investment decisions based on information on this website.
One of the things I like to do on weekends is to take a look back at past "picks" on this website and see how they would have done if I did buy them when I "picked" them. Indeed, virtually all of the stocks in my trading portfolio come from the stocks discussed on this blog.
For review purposes, I shall assume a "buy and hold" strategy for these picks. In reality, I sell my stocks quickly if they are losing money for me (an 8% loss is the sale point), and slowly at predetermined points (30%, 60%, 90%, 120%, 180% etc.) if they are making money for me. I cannot overemphasize this. The bias in selling losing stocks quickly and gaining stocks slowly is probably the most important "take-home" lesson on this blog. Regardless of how you decide to pick stocks.

On 7/13/04, I
posted Option Care (OPTN) on Stock Picks when it was trading at $17.39 OPTN split 3:2 on 4/1/05, making my effective stock pick price actually $11.59. OPTN closed at $13.63 on 9/16/05 for a gain of $2.27 or 19.6%.

On August 9, 2005, OPTN
announced 2nd quarter 2005 results. For the quarter ended June 30, 2005, revenues climbed 21% to $119 million from $99 million in the same quarter last year. Net income rose 15% to $5.4 million vs. $4.7 million last year same quarter. Diluted earnings per share increased to $.16/share for the quarter up from $.14/diluted share last year.

On July 14, 2004, I
posted Genzyme (GENZ) on Stock Picks at $50.06/share. GENZ closed at $72.83 on September 16, 2005, for a gain of $22.77 or 45.5%.
July 14, 2005, GENZ
announced 2nd quarter 2005 results. Revenue for the quarter ended June 30, 2005, increased 22% to $668.1 million from $549.6 million in the same quarter last year. GAAP net income came in at $123.6 million or $.46/diluted share, up from GAAP net income of $78.2 million or $.33/diluted share last year same period. In addition, the company also boosted guidance for 2005 revenue to $2.6-$2.8 billion, up from $2.5-$2.7 billion. It also raised guidance for GAAP EPS to $1.75 to $1.80 from $1.72 to $1.78. The combined strong earnings report with increased guidance 'going out' was enough to push the stock price higher!

On July 15, 2004, I
posted SanDisk (SNDK) on Stock Picks when it was trading at $24.96. SNDK closed at $45.71 on 9/16/05, for a gain of $20.75 or 83.1%.

On July 21, 2005,
SanDisk announced 2nd quarter earnings. Revenue jumped 19% to $515 million up from $433 million last year. Net income came in at $70.5 million, down from $71.8 million or $.37/diluted share, down from $.38/diluted share last year same quarter. This was ahead of estimates and the stock moved higher. I give it a "thumbs down" only because the net income and diluted EPS are down year-over-year. However, the "street" liked the report and the stock has appreciated nicely.

On July 15, 2004, I
posted Carlisle Companies (CSL) on Stock Picks at $66.58. CSL closed at $63.50 on 9/16/05, for a loss of $(3.08) or (4.6)%.
On July 19, 2005, CSL
reported 2nd quarter 2005 results. Net sales grew 9% to $645.9 million, for the quarter ended June 30, 2005, from $590.3 million in the same quarter last year. Net income for the three months was $34.7 million or $1.11/diluted share, down from $37.4 million or $1.19/diluted share last year.

Finally, on July 17, 2004, I
posted Masonite (MHM) on Stock Picks at a price of $24.99. MHM was acquired by Kohlberg Kravis Roberts & Co (KKR) on 4/6/05 at a price of $42.25/share (Canadian). Since as of 9/14/05, when one Canadian Dollar traded at $.8469, the buyout can be converted into $35.78, for a gain of $10.79 (US) or 43.2%.
So how did I do picking stocks that week? Actually quite good, with four winners and one stock with a small loss. The average change since posting for the five stocks works out to a gain of 37.4% since posting. Now
that was a good week picking stocks! (Please remember that past performance is
no guarantee of future performance!)
Thanks again for stopping by! If you have any questions, or comments, please feel free to leave them on the blog or email me at bobsadviceforstocks@lycos.com.
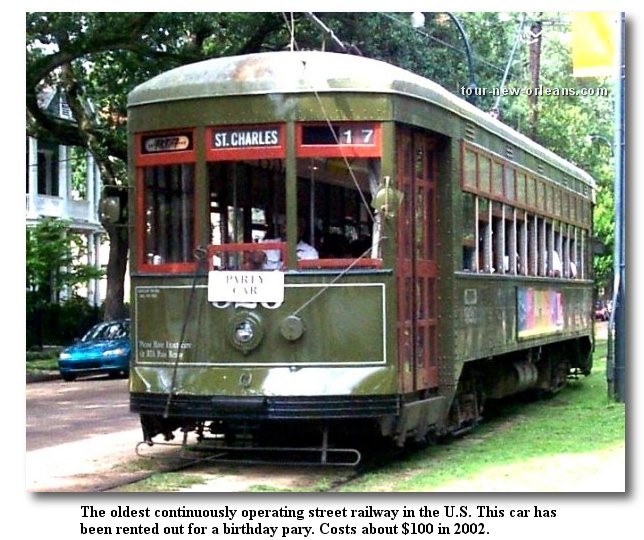
By the way, when you get down to visit New Orleans, be sure to ride on one of those famous street cars. This
streetcar is a St. Charles car that has apparently been rented out for a party!
Bob
A Reader Writes "I would be worried about the price of gas..."
Checking my mail box this morning, I was delighted to receive a note from Bob K. who wrote:
Hi Bob,
I have never been to New Orleans, but your ongoing remembrances have me eager to visit there when it is possible. Keep up the good work of keeping this region in our thoughts.
About MPX , I would be worried about the price of gas depressing the pleasure boat market. As I drive about La Crosse, I see used boats and motor homes for sale at very low prices....yet MPX numbers look promising. Perhaps there are parts of the country (such as the eastern sea board) more dependant on boats that are in need of replacement. This should be interesting to watch.
Bob
 Winslow Homer Painting
Thanks so much for stopping by and visiting! You have made an excellent point over fuel prices and their possible effect on sales of pleasure boats. It is interesting that the point & figure chart on MPX there is indeed a drop in the price that I mentioned on the post...as the stock has fallen from the $20 level to the $12 level recently. Is this a result of the climbing gas prices? Perhaps.
I did a bit of a
Google search and found
this article from the Miami Herald (9/16/05) that reported:
Finding people willing and able to pay $10.5 million for a new yacht is the easy part of Mac McLaughlin's job.
The hard part: finding people willing and able to make the yachts.
McLaughlin is the chief financial offer of Broward Marine, a yacht manufacturing and repair business in Fort Lauderdale.
A declining dollar against the euro and an aging population with lots of disposable income make these busy times for Broward Marine and others in South Florida's marine industry. ''There's a heck of a lot of millionaires out there,'' McLaughlin said.
He says he'll have to triple or quadruple his workforce over the next nine months to keep up with increased demand.
However, a local Midwestern paper (Chicago "Northwest Herald" 9/6/05) reported
this:
At the other end of the spectrum, Jim Galway, sales manager at Watertower Marina Inc. in McHenry, said soaring temperatures, skyrocketing fuel prices and low water levels had hurt summer business.
"It has not been a terrible year, but we definitely are not up to par as far as people buying, using and servicing their boats," Galway said. "It might have been too hot for some people to bother coming out.
"Gas prices have hurt. When some people starting hearing rumors of how high prices were going to go, and did go, they did not bother to come out to buy a boat and use the boat they already had.
"Some canals were low, so people were worried about damage to their boats. We have not fixed a lot of boats. Either there has not been much damage or people have yet to fix their boats."
At Fox 14 Marina near the Fox River in Fox River Grove, manager Garry Zack said business this summer has been "very good."
"We were closed until the Fourth of July in 2004 because we had so much rain they had to close the river," Zack said. "Last year was bad. This year is much better.
"The boaters love the hot weather. For those of us working in the shop all day with no air conditioning, it was brutal."
The high cost of gas has not deterred boaters at Fox 14 Marina, Zack said.
"More people commented about gas prices last year, even though they are higher this year," he said. "When we finally rolled to $3 a gallon in mid-August, only one customer complained.
"Gas prices are 10 to 15 cents higher on the waterway because we do not buy in bulk. We have kept our prices as low as we could. I think the boaters understood the situation."
Even with the summer boating season winding down, Watertower Marina has not dropped anchor on its business prospects just yet.
"Just recently boat sales started picking up," Galway said late last month. "Hopefully that will continue to make up for some of the slow periods we had earlier in the season that we should not have had.
"And maybe some people are waiting for the fall to service some of their boats that might have been damaged by the low canals."
Thus, I am not sure whether the price of gas has definitely impacted boat sales overall. Certainly in some areas of the country where the local economy may not be as strong and the disposable income may not be as great, sales may be impacted. However, since many boats, especially the more expensive boats and yachts, may have upper-income purchasers who are less affected by fuel prices, this may not be a factor for those sales.
Thanks so much for the note. Time will tell whether the gas prices will be affecting sales at a company like MPX. You have made some excellent points and we may be seeing this in the future.
Bob
Friday, 16 September 2005
"Revisiting a Stock Pick" Marine Products (MPX)
Hello Friends! Thanks so much for stopping by and visiting my blog,
Stock Picks Bob's Advice. As always, please remember that I am an amateur investor, so please remember to consult with your professional investment advisors prior to making any investment decisions based on information on this website.
Before I discuss Marine Products (MPX), I wanted to continue my discussion of things that I feel make New Orleans special. As we consider the cost of reconstruction and rehabilitation of the city, let us recall the many things that make this imperative. Needless to say, music and Jazz are an essential ingredient to the New Orleans experience.
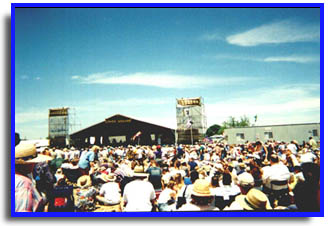
A photo of the New Orleans Jazz & Heritage Festival.
As reported in the Baton Rouge "Louisiana Lagniappe" page:
If you love jazz, gospel, cajun, zydeco, rythm and blues or just about any type of music, a great time to visit New Orleans is during the last week of April and the first week of May. This is the time the annual New Orleans Jazz & Heritage Festival is held. Second only in size and fame to Mardi Gras, in a city that hosts a great number of parties, the Jazz Fest has become both a major international musical and cultural event. The festival takes place at the New Orleans Fairgrounds horse racing track and includes not only performances by hundreds of top musicians, but an enormous display and offering of South Louisiana and New Orleans crafts and food. If anything is able to rival jazz and the music of New Orleans in popularity, its the incredible selection of creole, cajun and crescent city cuisine.
So be sure to visit New Orleans, and if you can, take in the Jazz & Heritage Festival as soon as it gets going once again!
Well, back to stocks!

Looking through the
list of top % gainers on the NYSE this afternoon, I came across Marine Products, which as I write, is trading at $12.10, up $1.23 or 11.32% on the day. I do not currently own any shares or options on this company.

I first
posted Marine Products (MPX) on Stock Picks on February 18, 2004, when it was trading at $20.00/share. MPX had a 3:2 split March 11, 2004, and another 3:2 split on March 11, 2005. Thus, the effective pick price was actually $8.89. With the current price at $12.10, this represents a gain of $3.21 or 36.1% since the original post.
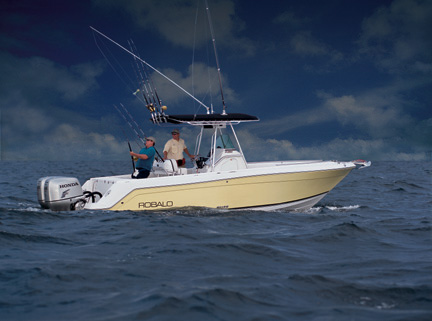
According to the
Yahoo "Profile" on Marine Products, the company "...engages in the design, manufacture, and sale of fiberglass motorized boats in the United States. The company's product offerings include sterndrive and inboard-powered sportboats, deckboats, and cruisers, as well as outboard sport fishing boats."
On July 27, 2005, MPX
reported 2nd quarter 2005 results. For the quarter ended June 30, 2005, net sales grew 19.7% to $77.6 million from $64.8 million last year. Net income for the quarter came in at $8.0 million, up 24.4% from the $6.4 million the prior year same quarter. On a diluted earnings per share basis this came at $.20, a 25% increase over the $.16 reported the prior year same quarter.
Looking longer-term at a
"5-Yr Restated" financials from Morningstar.com, we can see the nice, steady picture of revenue growth (except for a dip between 2000 and 2001) from $148 million in 2000 to $276 million in the trailing twelve months (TTM).
Earnings have increased from $.33/share in 2002 to $.64/share in the TTM. Since 2001, the company has been paying a small dividend, increasing
each year from $.01 in 2001 to $.13/share in the TTM. Free cash flow has been positive, growing from $8 million in 2002 to $23 million in the TTM.
As reported by Morningstar, the balance sheet for MPX is gorgeous with $46.7 million in cash, more than enough to pay off both the $22.6 million in current liabilities
and the $5.7 million in long-term liabilities with $14 million or so still left over! In addition, the company has reported $42.2 million in
other current assets.
Looking at
Yahoo "Key Statistics" on Marine Products, we can see that this is a small mid-cap stock with a market capitalization of $459.32 million. The p/e is downright reasonable at 18.41, with a forward (fye 31-Dec-06) p/e even nicer at 14.94. Confirming the nice value of this stock, the PEG (5 yr expected) is under 1.0 at 0.82.

MPX is in the "Recreational Vehicles" industrial group according to my Fidelity.com research. Within this group, they are midway priced in valuation insofar as the price/sales ratio is concerned. Harley-Davidson (HDI) tops the group with a price/sales ratio of 2.8. This is followed my Marine Products (MPX) at 1.6, Polaris (PII) at 1.2, Winnebago (WGO) at 1.0, Thor (THO) at 0.8 and Monaco Coach (MNC) at 0.4.
Looking again at Yahoo, we can see that there are 38.44 million shares outstanding with 446,490 shares out short as of 7/12/05. This is a bit significant due to the relatively low trading volume of this stock, and these shares represent 3.50% of the float or 7.1 trading days of volume.
As noted earlier, the company pays a small dividend of $.16/share yielding 1.50%. And as I also discussed, the stock split last 3/11/05 when a 3:2 split was declared.
How about a chart? Looking at the
"Point & Figure" chart on MPX from Stockcharts.com:
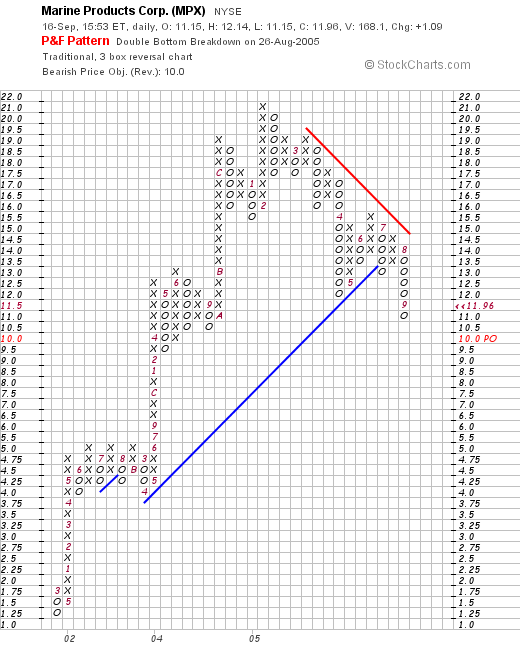
We can see that the stock has traded sharply higher from February, 2001, when it was at the $1.25 level, and hit a peak in February, 2005, at the $21 level. The stock actually broke through resistance at $13.50 in July, 2005, and now is moving higher, but still below the "resistance" line. The graph gives me some pause at least short-term!
So what do I think? Well, I wish I bought some of these shares the last time I discussed this company :). However, at this time, the last quarterly report was solid, the past five years, while not perfect, were quite strong, valuation is reasonable with a PEG under 1.0, and the price/sales is also moderate. There are a lot of shares out short which may add a possible upward price pressure to this stock.
On the downside, the chart is a bit weak. The company has just announced a stock buy back which may change the picture significantly. And I am not sure of the impact hurricane Katrina may have on this company, as presumably, damaged boats are replaced with new purchases (?).
And if you do get down to New Orleans for the Jazz & Heritage Festival, please remember to pick up a poster for me!

Bob
Monday, 12 September 2005
September 12, 2005 Oakley (OO)
Hello Friends! Thanks so much for stopping by and visiting my blog,
Stock Picks Bob's Advice. As always, please remember that I am an amateur investor, so please remember to consult with your professional investment advisors prior to making any investment decisions based on information on this website.
Before I get to stocks, I want to share with you another gem of New Orleans that you will want to visit next time you make the trip.
Pat O'Brien's is a destination bar and entertainment center in the French Quarter.

This is the entrance to Pat O'Brien's.
Back to stocks :).
 Looking through the list of top % gainers on the NYSE today, I came across Oakley (OO), which closed at $18.16, up $.71 or 4.07% on the day. I do not own any shares nor any options on this company.
 According to the Yahoo "Profile" on OO, Oakley "...engages in the design, manufacture, and distribution of consumer products, including eyewear, footwear, watches, apparel, and accessories."
On July 20, 2005, Oakley announced 2nd quarter 2005 results. Net sales jumped 10.8% to $170.5 million compared with $153.8 million last year same quarter. Net income came in at $20.3 million or $.30/diluted share, up from $16.0 milllion, or $.23/diluted share in the same quarter in 2004. In addition, the company guided full year earnings higher to an increased range of 25 to 30% growth over 2004.
 Looking at the "5-yr Restated" financials on Morningstar.com, we can see the steady growth in revenue from $363.5 million in 2000 to $615.3 million in the trailing twelve months (TTM).
Earnings have grown more erratically, dropping from $.73/share in 2000 to $.56 in 2003. However, earnings have improved since then with $.71/share reported in the TTM.
In addition, the company initiated a dividend in 2003 at $.14/share, and have increased it to $.15/share in the TTM.
Free cash flow has remained positive with $55 million reported in 2002, and $25 million reported in the TTM.
The balance sheet, as reported by Morningstar, is solid with $60.8 million in cash and $253.8 million in other current assets, easily covering the $90.7 million in current liabilities and the $20.2 million in long-term liabilities, almost three times over.
 Looking at Yahoo "Key Statistics", we can see that this is a mid-cap stock with a market capitalization of $1.25 billion. The trailing p/e isn't too high at 25.40 with a forward p/e (fye 31-Dec-06) of 19.96. The PEG is a tad rich at 1.47.
Looking at the price/sales ratio, we can see that this stock is also richly priced in the "Sporting Goods" Industrial Group. Oakley (OO) leads the list with a price/sales ratio of 1.9, followed by Nautilus (NLS) at 1.5, Callaway Golf (ELY) at 1.3, Brunswick (BC) at 0.8 and K2 (KTO) at 0.5.
 Looking at some other Yahoo statistics on OO, we find that there are 68.72 million shares out short and as of 7/12/05, there were 2.53 million shares out short, representing 10% of the float and 7 days of average volume. This appears to be a significant short interest, if we use my arbitrary 3 days of volume as a cut-off. Any upward pressure on this stock might (imho) result in a bit of a squeeze.
As mentioned earlier, the company pays a small dividend of $.15/share yielding 0.90%. The last stock split was a 2:1 split in October, 1996.
What about a chart? If we look at a "Point & Figure" chart on OO from Stockcharts.com:
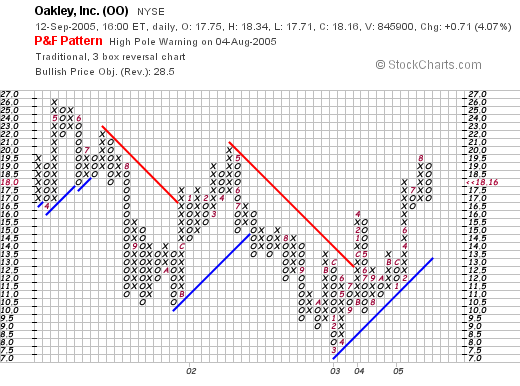
We can see that the stock only relatively recently broke its downward trend from $26 to a low of $7.50 in March, 2003. The stock broke through resistance in August, 2003, at around $12.50 and has been trading higher recently.
This graph activity coincides with the weak earnings trends until the last couple of years as noted on the Morningstar.com "5-Yr Restated" financials discussion above. The stock appears to be headed higher, and does not appear over-extended.
So what do I think? Well, this is almost a Peter Lynch kind of pick :). I mean everyone knows about Oakley's don't they? Great sunglasses! And the latest quarterly report looks nice, the past few years have been good for revenue growth and earnings have also fallen into line the last couple of years. Free cash flow is positive, but not growing, the balance sheet is solid, and the chart looks nice.
On the downside, the valuation doesn't look cheap with a price/sales ratio at the 'top of the class' and a PEG closer to 1.5 than 1.0. Otherwise, the stock looks attractive, and I would be putting it on my short list to purchase, except of course, I am not in the market to buy anything being at the full 25 position complement.
Thanks so much for stopping by and visiting my blog. If you have any questions or comments, please feel free to leave them here on the blog or email me at bobsadviceforstocks@lycos.com.
By the way,

when you do get to New Orleans, be sure to try one of those fancy hurricanes (drinks!) at Pat O'Brien's.
Bob
Posted by bobsadviceforstocks at 6:50 PM CDT
|
Post Comment |
Permalink
Updated: Monday, 12 September 2005 9:36 PM CDT
Sunday, 11 September 2005
"Weekend Trading Portfolio Analysis" American Healthways (AMHC)
Hello Friends! Thanks so much for stopping by and visiting my blog,
Stock Picks Bob's Advice. As always, please remember that I am an amateur investor, so please consult with your professional investment advisors prior to making any investment decisions based on information on this website.
A few weeks ago I started something new here on Stock Picks :). A review each weekend of a stock in my actual trading portfolio. These are stocks that are picked from among stocks discussed on this blog, and are investments that I actually
do make and which I try to report on this blog under the entries "Trading Transparency".
That is what I mean by that term!
I am going alphabetically through my 25 position trading portfolio and reviewing each investment, when I first purchased, sold, etc., and sharing with you my thoughts on those investments as well.

This week I am up to American Healthways (AMHC). I currently own 128 shares of AMHC which closed at $46.40 on 9/8/05. On June 18, 2004, I
posted American Healthways (AMHC) on Stock Picks when it was trading at $24.11/share. Earlier that same day, June 18, 2004, I
posted my purchase of AMHC: 300 shares at $23.50. I have now sold AMH three times. I sold 75 shares on 11/03/04, at $32.65, for a gain of $9.15 or 38.9%, slightly higher than my first targeted sale at a 30% gain. This left 225 shares in the account.
On April 25, 2005, I sold 55 shares at a net price of $39.69 for a gain of $16.19/share or 68.9%, leaving 170 shares of AMHC in the account.
On July 28, 2005, I sold 42 shares at $44.86 net, for a gain of $21.36 or 90.9%, leaving my 128 shares I currently own. At the current closing price of $46.40, they have an unrealized gain of $22.90/share or 97.4%. My next targeted sale on the upside will be at the 120% gain level, or on the downside, since I have sold at the 90% level, I shall sell all remaining shares if the stock retraces back to a 45% gain.
On June 20, 2005, AMHC
announced 3rd quarter 2005 results. Revenue climbed 20% to $78,357,000 for the quarter ended May 31, 2005, up from $65,354,000 the same quarter last year. Net income came in at $8.5 million or $.24/diluted share, up from $7.8 million or $.22/diluted share in the prior year.
If we look at an
American Healthways Point & Figure Chart:
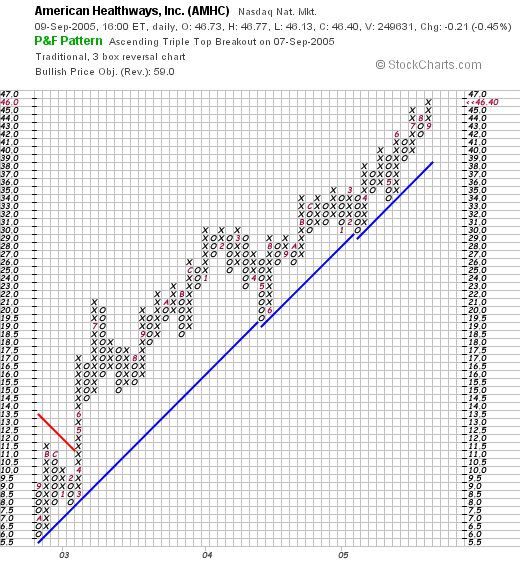
we can see a GORGEOUS graph, with an almost uninterrupted ascent after the stock broke through resistance in April, 2003, at about $11.00, to its current level in the high $40's.
In conclusion, AMHC has been a terrific stock for me. I have sold it three times at my price targets, and the chart looks solid, and latest earnings appear right on the mark.
Thanks so much for visiting. Please feel free to leave comments on the blog or email me at bobsadviceforstocks@lycos.com if you have any questions.
Bob
Posted by bobsadviceforstocks at 1:39 PM CDT
|
Post Comment |
Permalink
Updated: Sunday, 11 September 2005 1:41 PM CDT
A Reader Writes: "...how you use the graph and where to get these graph on the net?"
Hello Friends! Thanks so much for stopping by and visiting my blog,
Stock Picks Bob's Advice. As always, please remember that I am an amateur investor so please remember to consult with your professional investment advisors prior to making any investment decisions based on information on this website.

Yesterday, while checking my Xanga "sister blog", I saw that I had an interesting comment from Kok K. who wrote:
Hi, I have to say, your site is one of the most impressive I have seen so far. The most amount of information and relatively in depth analysis. However, I am not very familiar in the graph you use often in the blog. If you do not mind, could you send me an email to roughly explains how you use the graph and where to get these graph on the net? It might be a hassle for you, but I would greatly appreciate if you could explain to me.
Sincerely
Kok K.
Thank you for writing! The graph I use is called a "Point & Figure" chart. These charts can be found in many places on the net, but I like to use
Stockcharts.com. This is a free site and you can find a variety of different charts there. I do not receive any compensation for my recommendations of websites, nor do I pay any fees for their use.
Stockcharts.com has a fairly good
tutorial on Point & Figure charting where, if I may give you an excerpt they explain:
On a P&F chart price movements are combined into either a rising column of X's or a falling column of O's. If you are familiar with standard chart analysis, you can think of each column as representing either an uptrend or a downtrend. Each X or O occupies what is called a box on the chart. Each chart has a setting called the Box Size that is the amount that a stock needs to move above the top of the current column of X's (or below the bottom of the current column of O's) before another X (or O) is added to that column. Each chart has a second setting called the Reversal Amount that determines the amount that a stock needs to move in the opposite direction (down if we are in a rising column of X's, up for a column of O's) before a reversal occurs. Whenever this reversal threshold is crossed, a new column is started right next to the previous one, only moving in the opposite direction.
It sounds much more complex than it is, trust me!
In a nutshell, as long as a stock is in an uptrend and it doesn't move down more than the 'reversal distance' (i.e., the box size multiplied by the reversal amount), the P&F chart will show a growing column of X's. Similarly, a stock in a downtrend will cause a descending column of O's to appear. Only when the stock changes direction by more than the reversal distance will a new column be added to the chart.
Basically, when a stock is rising in price, you will see a column of 'x's', and a column of 'o's' if the stock price is declining.
I do not get into the esoteric signals created by this charting process. I try to keep it simple and just ask whether the stock appears to be continuing to rise, is going sideways, or is declining. In addition, so-called "support" and "resistance" lines are added to these charts at 45 degree angles to the horizontal. These lines are perpendicular and give some assumed significance to the overall price movement.
I hope this explanation is helpful to you! If you would like to read more, you might wish to read this
book by Thomas J. Dorsey on Point & Figure charting to give you the entire picture!
Regards, and thanks for commenting here!
Bob
Friday, 9 September 2005
September 9, 2005 Global Payments (GPN)
Hello Friends! Thanks so much for stopping by and visiting my blog,
Stock Picks Bob's Advice. As always, please remember that I am an amateur investor so please consult with your professional investment advisors prior to making any investment decisions based on information on this website.
Before I talk about stocks, I want to continue to celebrate New Orleans. Some have you may arrived to this blog looking for Katrina hurricane-related stock picks. But more importantly, we need to remember the things that made New Orleans special, and to work to support the people, the place, and the culture of the City.

I spent three years of my life in New Orleans. I met my wife there and my first son was born at Ochsner Clinic, the only Hospital/Clinic functioning through the hurricane.
One of the sites seen throughout New Orleans, especially in the Uptown area, was the Roman Candy Truck. For 50 cents you could get a long stick of this taffy candy. Just something Special I guess.
The story of the Roman Chewing Candy truck follows:
The Roman Candy Company began as a family treat with a recipe that dates back at least four generations. My great grandmother, Angelina Napoli Cortese, made the candy for family and friends at social and special events like Christmas and St. Joseph's Day. Her son, Sam Cortese, who was a street vendor by trade since the age of 12, would on occasion bring the left over candy on his fruit and vegetable wagon to sell the next day.
Roman Candy always sold very well and people began to ask for it, so Sam decided to try to sell candy on a regular basis. The problem however was that his mother didn't have time to make candy everyday and still tend to her other children and do all the things that mothers do.
Sam realized he would have to find a way to make his Roman Candy as he rolled along and sold it. In 1915, he went to a wheelwright named Tom Brinker and together they designed the wagon that is still used today.
The Roman Candy gourmet taffy initially sold for 5 cents a stick and stayed at that price until 1970. After his death in 1969, Sam's grandson took over the business and it continues to this day. The wagon and mule can be seen rolling through the streets of New Orleans, uptown, downtown and occasionally even in the suburbs on an almost daily basis.
Let us celebrate the small special things about New Orleans!
Now back to stocks!

The stock market is continuing to rally today, after the small profit-taking session yesterday. Looking through the
list of top % gainers on the NYSE today, I came across Global Payments (GPN) which is trading at $68.89, up $3.89 or 5.98% on the day. I do not own any shares nor do I have any options in this company.
According to the
Yahoo "Profile" on Global Payments, the company "...provides electronic transaction processing services to consumers, merchants, independent sales organizations, restaurants, universities, financial institutions, government agencies, and multinational corporations in the United States, Canada, Latin America, and Europe."
On July 20, 2005, GPN
announced 4th quarter 2005 results. Revenue climbed 14% to $207.7 million, up from $181.8 million for the same quarter last year. Net income grew 44% to $25.9 million, up from $18.0 million last year. Diluted eps climbed 39% to $.64/share, up from $.46/share in the same period last year.
Looking longer-term at the
"5-Yr Restated" financials on Morningstar.com for GPN, we can see a pretty picture of steady revenue growth from $340 million in 2000 to $759 million in the trailing twelve months (TTM).
Earnings are reported since 2002 at $.63/share, climbing steadily to $2.13/share in the TTM.
In addition, the company pays a small dividend of $.16/share.
Free cash flow has been positive but has fluctuated with $138 million reported in 2002, dropping to $11 million in 2003 and coming in at $174 million in the TTM.
The balance sheet is fair with $58.2 million in cash and $107.4 million in other current assets. This is outweighed slightly by the current liabilities of $179.2 million and the $96.5 million in long-term liabilities. With the $174 million in free cash flow, this shortfall should not (imho) be a problem.
Looking at
Yahoo "Key Statistics" on GPN for some valuation parameters, we can see that the company is a large cap stock with a market cap of $2.7 billion. The trailing p/e is a tad rich at 29.63 with a better forward p/e (fye 31-May-07) of 21.91. The PEG ratio is a bit high at 1.45.
Using
Fidelity brokerage for information, I found that this company is in the "Business Services" industrial group. Within this group, the price/sales ratio of GPN puts it near the top. Leading the group is Equifax (EFX) at 3.3 price/sales, followed by Global Payments (GPN) at 3.2, Cintas (CTAS) at 2.2, Certegy (CEY) at 1.9 and IPAYMENT (IPMT) at 1.2.
Other statistics from Yahoo reveal that there are only 39.12 million shares outstanding with 6.97 million shares out short (as of 7/12/05) representing 18.10% of the float or 25.6 trading days. This is a
LOT of shares out short (I use 3 trading days of volume as my own cut-off for this statistic), and may explain the upward pressure of the stock as short-sellers scramble to cover.
As noted earlier, the company pays an annual dividend of $.16/share yielding 0.20%. No stock splits are reported on Yahoo.
What about the chart? Taking a look at the
"Point & Figure" chart on GPN:
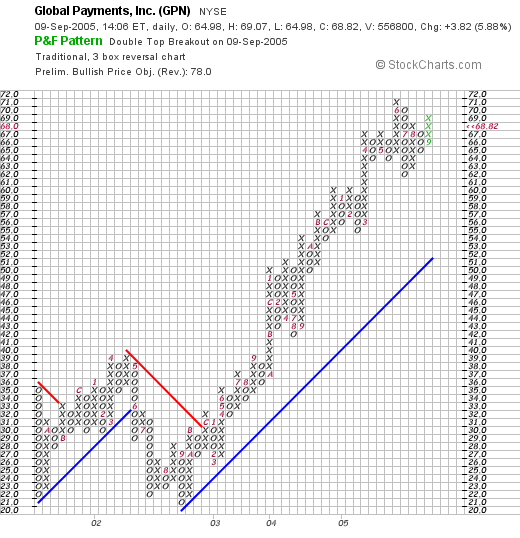
We can see that the stock traded sideways between 2001 and 2002 between a trading range of $20 and $39. In November, 2002, the stock broke through resistance at the $30 level, and has traded higher since to the current $69 level. The stock looks quite strong to me.
So what do I think? Well, I am not in the market for any stocks sitting on my full complement of 25 positions. However, this stock looks nice with a strong recent quarter, a good five year record of earnings and revenue growth, and a strong chart. Valuation is a tad rich and the balance sheet could show a little more in the current assets department. Otherwise, things look nice for this stock!
Thanks again for stopping by! If you have any comments, or questions, please feel free to email me at bobsadviceforstocks@lycos.com, or leave your thoughts right here on the blog!
Bob
Newer | Latest | Older


