Stock Picks Bob's Advice
Saturday, 5 May 2007
A Reader Writes "BEZ revenue figures--Dig a little deeper..."
Hello Friends! Thanks so much for stopping by and visiting my blog, Stock Picks Bob's Advice! As always, please remember that I am an amateur investor, so please remember to consult with your professional investment advisers prior to making any investment decisions based on information on this website.
 I received an excellent comment from Doug S. who wrote about my recent write-up on Baldor (BEZ). Doug wrote:
"Dig a little deeper and I think you'll discover that those revenue
figures are not what they appeared. The revenue from the two acquistions were included and not calculated on a preadjusted basis.
The true revenue growth was 10% not 100%. I called the company Friday morning the the person I spoke with after being transfered about five times pretty much confirmed my suspicions. If you will notice after the initial premarket pop and the conference call the stock went nowhere on huge volume."
Doug, you have made some excellent points in your letter.
If we take a look at the press release from the company we can see what you are writing. The company reports:
'John McFarland, Chairman and CEO, commented on the Company's results, "We are pleased to report our first quarterly results following our acquisition of Dodge and Reliance. Sales of $396 million were up 106%, earnings at $21 million were up 84%, and earnings per share were up 47% to $0.50. Operating margin for the quarter was 13.2%. Earnings per share were reduced by $0.02 for non-recurring purchase accounting adjustments related to the acquisition. Diluted average shares outstanding increased to 41.6 million in the first quarter."'
You can see that in the same line as writing about the big increase, the Chairman and CEO clearly includes the comment "...following our acquisition of Doge and Reliance." I don't think there is any subterfuge with the news, or attempt to mislead anyone.
Furthermore, on questioning about the business during the quarter, Mr. McFarland stated, as reported in the same release:
"Q ... How was business during the first quarter?
Sales for the quarter ended March 31, 2007 increased 8%. This comparison is based on 13 weeks of Baldor sales and 9 weeks of Dodge/Reliance sales during the first quarter of 2006. Industrial motor sales (63% of revenue) were up 13%, power transmission products (23% of revenue) were flat, drives sales (8% of revenue) were down slightly, and generator sales (3% of revenue) were up 13%.
International sales (13% of revenue) were up 8% for the quarter, with the highest growth in Latin America and Europe.
We saw sales growth across most industries, including the farm machinery, HVAC, aggregate and oil and gas markets, particularly in oil sands development in Canada. We also saw some softening in the mining industry."
Again, he states that sales '...increased 8%.' And he details the time period in which the big acquisition was involved.
But certainly you make an excellent point. The growth in revenue is related to the acquisition. But just as important, was the acquisition helpful to the bottom line? Was the share dilution that occurred after the acquisition made up for by the acquisition itself. In the 'lingo', I believe the question is whether the acquisition was accretive to earnings? Or was it dilutive?
Certainly, we cannot fault a management team that can make wise acquisitions that result in greater earnings, can we?
In this particular case, diluted earnings per share grew 47% to $.50/share from $.34/share. In addition, the company was able to raise the dividend 6% from $.16/share to $.17/share. Overall, I do not think that there is any gross mis-step of management in this particular acquisition. The bottom line is after all the bottom line, isn't it?
I have no great loyalty to Baldor. I do own shares now, after-all, and I appreciate your input on this stock. I will sell my shares in a heart-beat if I hit my 8% loss. On the other hand, I feel comfortable with this acquisition, even if you rightly point out, that the incredible growth in revenue is due to an acquisition. The rest of the story appears intact.
Thanks again for writing, and if you or anyone else has comments or questions on this topic or on anything that I write, please do feel free to leave your comments on the blog or email me at bobsadviceforstocks@lycos.com.
Bob
Friday, 4 May 2007
Baldor Electric (BEZ)
Hello Friends! Thanks so much for stopping by and visiting my blog, Stock Picks Bob's Advice! As always, please remember that I am an amateur investor, so please remember to consult with your professional investment advisers prior to making any investment decisions based on information on this website.
 As I wrote up earlier today, after my sale of a portion of my Universal Electronics (UEIC) at a gain, I had the "permission slip" to add a new position to my trading portfolio. Earlier today, I purchased 140 shares of Baldor (BEZ) at $44/share to fill out my portfolio. I promised I would let you briefly know why I chose Baldor and how it fit into my portfolio and why
BALDOR (BEZ) IS RATED A BUY
What exactly does Baldor (BEZ) do?
 According to the Yahoo "Profile" on BEZ, the company
"...designs, manufactures, and sells electric motors, drives, and generators to original equipment manufacturers and independent distributors worldwide. The company�s motor products include AC and DC electric motors; drives consist of inverter, vector, and servo drives, as well as linear and rotary servo motors and motion control products; and generator products comprise portable generators, as well as industrial towable, mobile light towers, emergency and standby, prime power, and peak-shaving generators."
How did they do in the latest quarter?
The company reported 1st quarter results today and reported revenue growth up nearly 100% to $395.7 million from $192.3 million, and earnings increasing 84% to $11.4 million or $.34/share (or $.52/share excluding 'items'). This beat expectations of analysts on both revenue and earnings, who were expecting profit of $.37/share on revenue of $388.5 million.
How about longer-term results?
Checking the Morningstar.com "5-Yr Restated" financials on BEZ, we can see steady revenue growth, steady earnings growth, steady dividend growth, but with a slight expansion of outstanding shares from 33 million in 2006 to 46 million in the trailing twelve months (TTM). Free cash flow is positive and the balance sheet is solid from my perspective.
What about valuation?
Checking Yahoo "Key Statistics", this is a mid cap stock with a market capitalization of $2.01 billion. The trailing p/e is moderate at 30.14, but the forward p/e is estimates (fye 30-Dec-08) at 19.30. Thus, with rapid growth the PEG comes in at a nice 1.12.
Baldor, according to the Fidelity.com eresearch website, has a nice Price/sales ratio of only 1.60 (TTM) compared to the industry average of 22.35. However, Baldor's Return on Equity (TTM) is at 15.84%, somewhat below the industry average reported at 20.30%.
There are 45.74 million shares outstanding with 41.20 million that float. As of 4/10/07, there were 2.69 million shares out short representing 10.5 trading days of volume (the short ratio) well ahead of my own 3 day rule for significance. The company has already traded 1.2 million shares, well ahead of the average volume of 357,000, and also well behind the probably residual level of short shares outstanding. This may well be part of a 'squeeze' of the shorts.
The company pays a forward dividend of $.68/share yielding 1.7%. The company, per Yahoo, last split its stock 4:3 in December 1997.
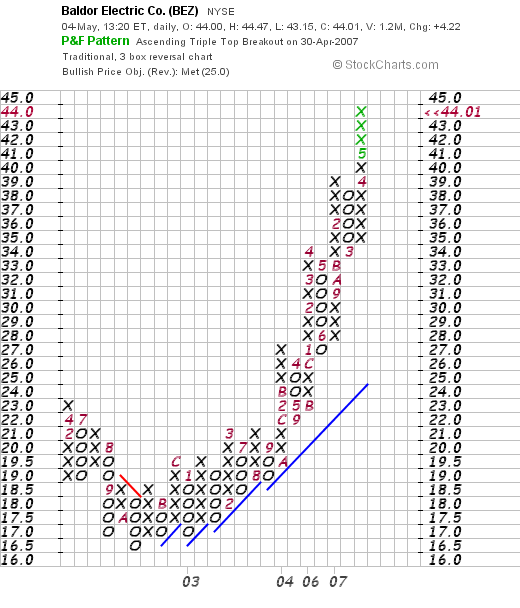
What about the chart?
If we look at the "Point & Figure" chart on Baldor from StockCharts.com, we can see that the stock, which actually traded lower from $23/share in April, 2002, dipped as low as $16.50 in October, 2002, before starting to trade higher to the current $44 level today. The chart looks strong to me.
Summary: What do I think?
Well, I certainly liked this stock enough to buy some shares! Seriously, the company reported very strong earnings beating expectations, they have grown nicely the last several years increasing both revenue, earnings and dividends, the balance sheet is solid and valuation is reasonable. Finally, the chart looks nice. On top of this, there are lots of shares out short which will need to be covered as the stock appreciates, adding to the buying pressure.
Thanks so much for stopping by and visiting! If you have any comments or questions, please feel free to leave them on the blog or email me at bobsadviceforstocks@lycos.com. If you get a chance, be sure and visit my Stock Picks Podcast Website where I discuss some of the many stocks I write about here on the website.
Have a great weekend everyone!
Bob
Baldor Electric (BEZ) "Trading Transparency"
Hello Friends! Thanks so much for stopping by and visiting my blog, Stock Picks Bob's Advice! As always, please remember that I am an amateur investor, so please remember to consult with your professional investment advisers prior to making any investment decisions based on information on this website.
I never let that nickel sit in my pocket very long! In fact, a few moments ago, with my 'permission slip' to add a new position in hand, I checked the list of top % gainers on the NYSE and came across Baldor Electric (BEZ), which as I write, is trading at $44.25, up $4.46 or 11.21%. I quickly checked the latest quarter, which as I suspected they announced 1st quarter 2007 results today. They reported great numbers and exceeded expectations on both earnings and revenue. I took a look at the Morningstar.com "5-Yr Restated" financials on BEZ (isn't it neat how quick you can do this stuff after awhile!), and everything appeared to be just beautiful except for a jump in the outstanding shares recently. (That doesn't appear to be a problem). The company even pays a dividend and has been increasing it annually!
Anyhow, I took the plunge and bought 140 shares at $44.00/share a few moments ago. With my new strategy of selling 1/7th of my holdings at appreciation targets, I am trying, not that it makes a real difference, to start out with positions that are divisible by 7. Actually, as I write it up, that is a pretty silly way to pick a number of shares to buy isn't it?
Wish me luck! I am back to my 20 position status. I am not going to my old goal of 25 positions until I get that margin balance down. At that point, maybe will go to 25 (?). If you have any comments or questions please feel free to leave them on the blog or email me at bobsadviceforstocks@lycos.com. I shall try to do a more thorough write-up of Baldor if I get a chance later today or this weekend.
Regards to all of you!
Bob
Posted by bobsadviceforstocks at 9:21 AM CDT
|
Post Comment |
Permalink
Updated: Friday, 4 May 2007 9:26 AM CDT
Universal Electronics (UEIC) "Trading Transparency"
Hello Friends! Thanks so much for stopping by and visiting my blog, Stock Picks Bob's Advice! As always, please remember that I am an amateur investor, so please remember to consult with your professional investment advisers prior to making any investment decisions based on information on this website.
A few moments ago I noticed that my Universal Electronics Stock (UEIC) had passed my first appreciation target of a 30% gain. At each of these appreciation targets, my current strategy is to sell 1/7th of my holding. Owning 180 shares, I sold 25 shares of UEIC at $33.39. These shares were purchased 2/23/07 at a cost basis of $25.24, so this represented a gain of $8.15 or 32.3% since purchase.
My next sale on the upside would be at an appreciation target of 60% at which time I plan on selling 1/7th of my remaining shares, or 22 shares at 1.6 x $25.24 = $40.38. On the downside, after a single sale, my targeted sale point would be at break-even or at a price of $25.24.
Anyhow, the other thing about my strategy is that now at 19 positions, under my new maximum of 20 positions, this sale is a 'signal' or a 'permission slip' to look for a new holding! That nickel is already burning a hole in my pocket!
Thanks so much for dropping by! If you have any comments or questions, please feel free to leave them on the blog or email me at bobsadviceforstocks@lycos.com. I shall be on the lookout for that new position and I shall keep you posted!
Bob
Wednesday, 2 May 2007
Buffalo Wild Wings (BWLD) "Revisiting a Stock Pick"
Hello Friends! Thanks so much for stopping by and visiting my blog, Stock Picks Bob's Advice! As always, please remember that I am an amateur investor, so please remember to consult with your professional investment advisers prior to making any investment decisions based on information on this website.
 Earlier today I was looking through the list of top % gainers on the NASDAQ and was pleased to see an "old favorite" of mine, Buffalo Wild Wings (BWLD) on the list. BWLD closed at $74.20, up $9.36 or 14.44% on the day.
I use the term "old favorite" to describe stocks that I have reviewed here previously. As much as possible, I try to wait about a year before revisiting them when the opportunity arises. In fact, I wrote up Buffalo Wild Wings (BWLD) on Stock Picks Bob's Advice on May 26, 2006, when the stock was trading at $39.42. With today's close at $74.20, this represents a gain of $34.78 or 88.2% since posting just under a year ago! (Unfortunately, I did not buy any shares last year and I still do not own any shares or have any options on this stock!) In light of all of this and the following information,
BUFFALO WILD WINGS (BWLD) IS RATED A BUY
Let's take another look at this stock and I will show you why I still believe it deserves a spot on the blog and a place in my "vocabulary". If I were buying a stock today, this would be the kind of stock I would be looking to purchase!
What exactly does this company do?
 According to the Yahoo "Profile" on Buffalo Wild Wings (BWLD), the company
"...through its subsidiaries, engages in the ownership, operation, and franchising of restaurants in the United States. It provides quick casual and casual dining service, as well as serves bottled beers, wines, and liquor."
How did the company do in the latest quarter?
As I have reported over and over again, it was the announcement of earnings that once again drove one of my posted stocks higher. In this case, BWLD announced 1st quarter 2007 results after the close of trading yesterday that drove the stock sharply higher today. Total revenue for the quarter ended April 1, 2007, came in at $79.9 million, up 24.3% from last year's $64.3 million figure. Same-store sales grew 8.7% at company-owned stores and a not-quite-as-impressive 3.3% at franchised stores. Net earnings were up strongly at $5.5 million in the 1st quarter 2007 vs. $3.5 million last year. On a diluted earnings per share basis, this was more than a 50% increase from $.40/share to $.63/share in 2007.
The company easily beat estimates of $.52/share on revenue of $78.4 million according to analysts polled by Thomson Financial. On the back of this news, the company was upgraded by Morgan Keegan to "Outperform". Even Cramer had a big "booyah" for Buffalo Wild Wings, as reported:
"Cramer also sang the praises of Buffalo Wild Wings (BWLD - Cramer's Take - Stockpickr - Rating), up 15% Wednesday on strong earnings. Cramer said he believes the stock is "heavily overshorted" and going higher."
What about longer-term results?
Reviewing the Morningstar.com "5-Yr Restated" financials on BWLD, we can see that this company has grown its revenue vigorously and steadily from $96.1 million in 2002 to $278.2 million in 2006. Earnings were first reported at $.84/share in 2004 to $1.02/share in 2005 and $1.85 in 2006. During this same period, the company maintained the outstanding shares with only nominal increase in the float from 8 million in 2004 to 9 million in 2006.
Free cash flow improved from $(2) million in 2004 to $3 million in 2005 and $9 million in 2006. The balance sheet is great with $64.6 million in cash which by itself is able to cover both the $25.8 million in current liabilities and the $19.2 million in long-term liabilities combined. Calculating the current ratio, we have a total of $75 million in current assets, divided by the $25.8 million in current liabilities yields a current ratio of 2.91, a very 'healthy' current ratio imho.
What about some valuation numbers on this stock?
Reviewing the Yahoo "Key Statistics" on BWLD, we can see that this is a small cap stock with a market capitalization of only $646.73 million. The trailing p/e is a bit rich at 40.20, but the forward p/e is better (fye 31-Dec-08) estimated at 29.33. Even with the rich p/e, the growth rate is anticipated to be rapid enough to bring the PEG (5 yr expected) down to a reasonable 1.26.
Using the Fidelity.com eresearch website, we find that valuation isn't bad based on the Price/Sales (TTM) ratio which for Buffalo Wild Wings comes in at 2.04, compared to an industry average of 3.48. The company is also reported to do better than the industry average on profitability as measured by Return on Equity (TTM). BWLD is reported by Fidelity to have a Return on Equity of 15.08%, compared to the industry average of -.55%.
Finishing up with Yahoo, we can see that there are only 8.72 million shares outstanding and 7.02 million that float. As of 4/10/07, there were 2.31 million shares or 30.1% of the float, out short, representing 6.8 trading days (the short ratio). This is well above my own '3 day rule' for short interest. I have to agree with Cramer on this one that the short-sellers may well be pressured to buy shares to cover their negative bets on this stock as the price appreciated today. We can see that there were 2.5 million shares traded today, well above the average of 390,000 reported by Yahoo. In fact, many of the short-sellers may have been covering (?). I would expect that there are still many shorts still uncovered outstanding but then I would just be guessing on this one :).
No dividends are reported by Yahoo and no stock splits are reported either.
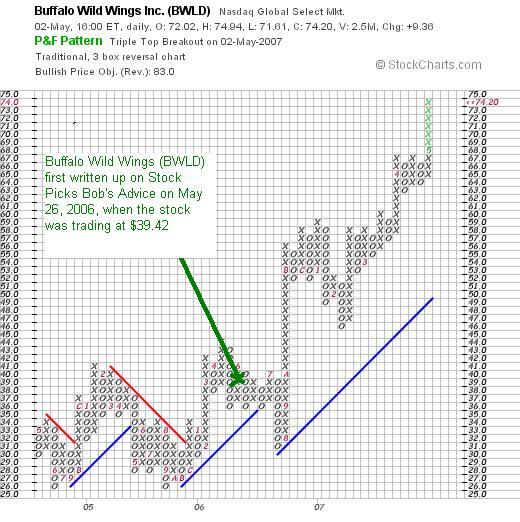
What does the chart look like?
Reviewing the "Point & Figure" chart on Buffalo Wild Wings (BWLD) from StockCharts.com, we can see that after initially trading between $33 and $26 between May, 2004, and September, 2005, the stock then started moving higher, breaking through resistance in November, 2005 at $32, and has traded strongly higher since to the current $74 level. If anything, the stock does look a little over-extended trading well above the support line around the $50 level.
Summary: What do I think?
Needless to say, I like this stock a lot. I don't know if I would like their chicken or their drinks at the bar. I like this stock not because of the restaurant, but it would be nice to visit one first-hand, but because of their superb financial performance. They reported great earnings results with solid revenue growth based not just on opening new restaurants but internal growth of existing restaurants as demonstrated by solid same-store sales growth figures.
The earnings report exceeded expectations on both earnings and revenue numbers. Furthermore, the company has an excellent and consistent track record of revenue and earnings growth, free cash flow growth, stable outstanding shares, and a great balance sheet.
Valuation-wise, the p/e is a bit rich at about 40, but the forward p/e is better, and more importantly, considering the growth rate anticipated in earnings, the PEG works out to be under 1.5. Other valuation numbers include a Price/Sales (TTM) low for its group, and a profitability as measured by Return on Equity (TTM) that is high for its group. Finally, the chart looks great and to top it off, it is another great midwestern firm (well, not from Wisconsin, but Minnesota isn't that far :).)
Thanks so much for stopping by and visiting! If you have any comments or questions, feel free to leave them on the blog or drop me a line at bobsadviceforstocks@lycos.com. If you get a chance, be sure and visit my Stock Picks Podcast Website where you can download some mp3's of me discussing some of the many stocks I write about here on the blog. In fact, I even did a Podcast on BWLD last year when I was writing up the entry.
Have a great week trading!
Bob
Tuesday, 1 May 2007
Amedisys (AMED) "Revisiting a Stock Pick"
Hello Friends! Thanks so much for stopping by and visiting my blog, Stock Picks Bob's Advice! As always, please remember that I am an amateur investor and that you should always consult with your professional investment advisers prior to making any investment decisions based on information on this website.
 I was looking through the list of top % gainers on the NASDAQ this afternoon and came across Amedisys (AMED) which is an old favorite of this blog. AMED is currently trading at $33.80, up $2.44 or 7.78% on the day. I do not own any shares of Amedisys nor do I have any options on this stock.
AMEDISYS (AMED) IS RATED A BUY
I say "old favorite" because I have posted twice about this stock previously. I first wrote up Amedisys on Stock Picks Bob's Advice on June 21, 2004, when the stock was trading at $30.74. With the stock splitting 4:3 on December 5, 2006, this represents an adjusted price of $23.06. With the current price at $33.69 (as I write), this is an appreciation of $10.63 or 46.1% since that post.
The following year, on May 3, 2005, I wrote up Amedisys on Stock Picks Bob's Advice at a price of $33.84 (or $25.38 adjusted for the 4:3 stock split). Again, with the stock currently at $33.77 (the stock keeps changing prices as I write :)), this represents an appreciation of $8.39 or 33.1% since that posting two years ago.
Let's take a third look (!) at this company and I shall once again share with you why I believe it still deserves a spot on this blog!
What exactly does this company do?
According to the Yahoo "Profile" on Amedisys (AMED), the company
"...provides home health and hospice services in the United States. Its home health services include nursing services, such as infusion therapy, skilled monitoring, assessments, and patient education; practical nursing services, including performance of technical procedures, administration of medications, and changing of surgical and medical dressings; and physical and occupational therapy."
How did they do in the latest quarter?
As I have found out over and over again, it was the announcement of 1st quarter results this morning, prior to the open of trading, that boosted the share price today. For the quarter ended March 31, 2007, "net service revenue" came in at $153.6 million, up 21% from the first quarter of 2006 and net income was $13.3 million or $.51/diluted share, up sharply from $7.3 million or $.34/diluted share for the same quarter in 2006.
The company beat estimates on both revenue (expected $150.3 million) and earnings (expected $.50) and reaffirmed guidance. With this earnings report, Jefferies & Co. upgraded their opinion on AMED from "Hold" to "Buy". The combined earnings report and upgrade was enough to boost the stock price today.
How about longer-term results?
Reviewing the Morningstar.com "5-Yr Restated" financials on AMED, we find revenue growing steadily from $129 million in 2002 to $382 million in 2005 and $541 million in 2006. Earnings during this period also sharply increased from $.06/share in 2002 to $1.72/share in 2006. It should be noted that the company has indeed expanded the number of shares outstanding significantly from 11 million in 2002 to 26 million in the trailing twelve months (TTM). However, during this time while shares slightly more than doubled, revenue almost quadrupled and earnings were up more than 20-fold.
Free cash flow, while positive, has dropped recently from $24 million in 2004, $23 million in 2005 and $14 million in 2006. The balance sheet, as presented by Morningstar.com, appears solid. The company has $84.2 million in cash and $95.0 million in other current assets. This combined $179.2 million in current assets is more than adequate to cover both the short-term liabilities of $81.9 million and the $17.8 million in long-term liabilities combined. The current ratio works out to a healthy 2.19. (Generally current ratios of 1.25 or higher are considered 'healthy').
What about some valuation numbers on this stock?
Looking at the Yahoo "Key Statistics" on Amedisys, we can see that this is a small cap stock with a market capitalization of $876.02 million. The trailing p/e is a very reasonable 19.73 with a forward p/e (fye 31-Dec-08) estimated at an even nicere 13.99. With the solid growth in earnings anticipated, the PEG ratio works out to a very 'cheap' 0.71. (Generally I view PEG's of 1.0 to 1.5 as being 'reasonable').
Examining the Fidelity.com eresearch website information, we find that the Price/Sales ratio isn't quite as cheap, with a Price/Sales (TTM) of 1.31, compared to an industry average of 1.04. In terms of profitability, the company comes in with a Return on Equity (TTM) of 15.08%, much higher than the industry average reported by Fidelity to be 7.52%.
Finishing up with Yahoo, we find that there are 25.83 million shares outstanding with 25.32 million that float. Of these 4.50 million are out short representing 17.8% of the float or 11.7 trading days of volume. This is a significant level of short interest and with today's trading volume of 1.5 million, almost 4 times the average volume of 393,836 shares, we may well be witnessing a 'short squeeze' driving this stock price higher. There are likely still many shares out short still subject to buying pressure by a climbing stock price.
No dividend is paid, and as I noted earliere in this post, the company split its stock 4:3 on December 5, 2006.
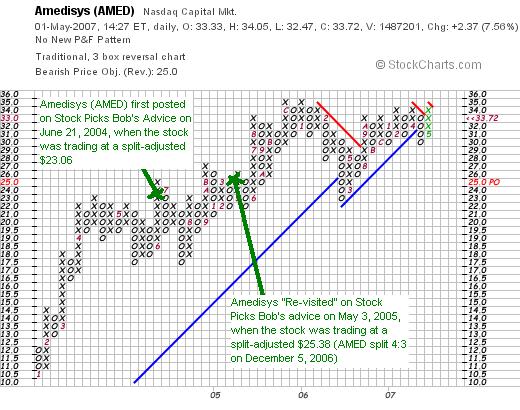
What does the chart look like?
Examining the "Point & Figure" chart from StockCharts.com on AMED, we can see a chart that appears to be plateauing. I am not sure if the stock is more or less 'rolling over' and headed lower, or if the current stock price movement will break out to higher highs. I would like to see this stock trade convincingly into the $36-$37 level or higher to be assured that the stock is indeed on the upward path.
Summary: What do I think about this stock?
Well, I like this stock as it is indeed one of the few stocks that I have had the opportunity of reviewing three times (and not even purchasing any shares!). They reported solid earnings and revenue growth today, beating expectations, they have grown revenue and earnings steadily the last few years. On the downside, they have indeed increased their shares outstanding but have done so at a rate far slower than the growth in revenue and earnings.
Free cash flow is positive, but hasn't been growing recently. The balance sheet on Morningstar appears solid.
Valuation-wise, the p/e is only in the teens and the PEG is under 1.0. The Price/Sales is a bit rich for its group, but the profitability is almost double the average in its industry. Finally, there are lots of short-sellers out there who need to cover their bets against this company and I believe there may literally be over a million shares needing to be covered at this point.
Technically the graph could be stronger. On the other hand, the stock does not appear to be over-extended and with a bit of a price appreciation, could well be building a strong base to expand upon. In conclusion, if I were in the market to be buying a stock, this is the kind of stock I would be purchasing today. In the meanwhile, it shall stay on my list of "purchaseable" stocks, becoming part of my "vocabulary" of stocks.
Thanks again for stopping by and visiting! If you have any comments or questions, please feel free to leave them on the blog or email me at bobsadviceforstocks@lycos.com. If you get a chance be sure and visit my Stock Picks Podcast Website.
Bob
Monday, 30 April 2007
How I Plan to Deal with a Market Correction
It wasn't a very good day in the market today. The Dow was down 58.03 to 13,062.91. The Nasdaq was down relatively sharper at 2,525.09, down 32.12, and the S&P was down 11.71. On a volume basis, on the NYSE there were 343 million shares advancing and 1.35 billion shares heading lower. Similarly on the NASDAQ there was 369 million shares advancing and 1.75 billion shares to the downside.
The new high/low discrepancy was also of concern with 59 new highs on the NYSE and 16 new lows, but 51 new highs and 67 new lows on the NASDAQ.
But what to do?
You all probably know my approach, but I shall be sitting tight (for now). I always reserve the right to change my mind but I shall try to follow the rules as I have developed. When stocks hit sales (like my Jones Soda) I shall unload them. Not because I think they are bad investments. Not because I think they shall not bounce back and go higher another day. Simply because in the interest of preserving my gains, I shall be limiting my exposure to declines to the rules I have set up previously.
Unfortunately I am heavily in margin.
Margin leverages everything. On the upside, gains are magnified, on the downside, the reverse is true. This is why I changed one of my plans on 25 positions. I am holding at 20 positions as my maximum until such time that either through sales or contributions, my margin has been paid off.
My portfolio management system is not about thinking. It is about observing and responding. About not anticipating, not predicting, not determining anything. Hopefully the quality stocks that I have chosen shall rebound when stocks rebound. I believe they will. I do not know when corrections last one day or one year. I don't know if anyone really knows.
Historically markets have moved higher over the long haul. And that is my place. The long haul. I shall watch my gains increase and decrease over time. I believe that with my approach, I shall be successful overall. But that is just sheer hypothesis on my part.
Meanwhile, wish me luck.
It is a cold, hard world outside. It required cold, hard decisions. And nerves of steel. With some rules and you all out there, I think this is going to go great! Time will tell.
Bob
Wm. Wrigley Jr. Company (WWY)
Hello Friends! Thanks so much for stopping by and visiting my blog, Stock Picks Bob's Advice! As always, please remember that I am an amateur investor, so please remember to consult with your professional investment advisers prior to making any investment decisions based on information on this website.
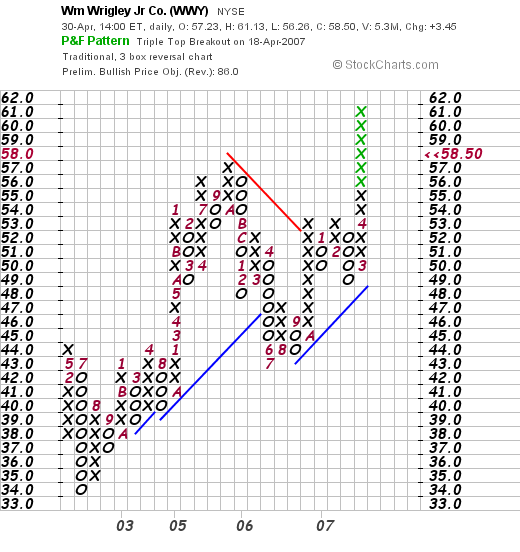
 Looking through the list of top % gainers on the NYSE this afternoon, in search of a new stock to write up here on the blog, I came across a familiar name that I haven't evaluated here but I have always thought of as a 'classical' growth stock story. William Wrigley Jr. Company (WWY), which as I write is trading at $58.99, up $3.95 or 7.18% on the day. I would like to review this stock and show you the information that I found that makes me believe this stock deserves a spot on my blog and why I believe
WM. WRIGLEY, JR. COMPANY (WWY) IS RATED A BUY
I do not own any shares of Wrigley, nor do I have any options on this stock.
What does this company do?
According to the Yahoo "Profile" on Wrigley (WWY), the company
 "...together with its subsidiaries, engages in the manufacture and marketing of chewing gums, mints, candies, and other confectionery products in the United States and internationally. The company offers its products in approximately 180 countries under Wrigley�s Spearmint, Juicy Fruit, Altoids, Doublemint, Life Savers, Big Red, Boomer, Pim Pom, Winterfresh, Extra, Freedent, Hubba Bubba, Orbit, Excel, Creme Savers, Eclipse, Airwaves, Alpine, Solano, Sugus, Cool Air, and P.K. brand names."
How did they do in the latest quarter?
As is frequently the case on stocks we find moving higher on the top % gainers list, it was the announcement of 1st quarter 2007 results this morning prior to the opening of trading that drove the stock sharply higher. Sales came in at $1.26 billion, up 17% from the same quarter the prior year. Consolidated net earnings came in at $143 million, up 28% from last year. On a diluted per share basic, this came in at $.52/share, up 30% from last year. Excluding one-time restructuring and one-time assets sale, the non-GAAP earnings still climbed 19% vs the year-ago quarter.
The company beat expectations as analysts were expecting earnings of $.47/share. They also exceeded expectations on revenue which was expected to come in at $1.18 billion.
What about longer-term results?
Reviewing the Morningstar.com "5-Yr Restated" financials on Wrigley, we can see a very steady increase in revenue from $2.7 billion in 2002 to $4.7 billion in 2006. Earnings have also increased without 'missing a beat' from $1.14/share in 2002 to $1.90/share in 2006. An added 'plus' is the fact that the company pays a dividend and has been increasing that dividend on a regular basis from $.64/share paid in 2002 to $.99/share paid in 2006. In addition, there has been a steady reduction in the outstanding shares with 353 million shares in 2002 declining to 277 million in 2006 and 276 million in the trailing twelve months.
The company is solidly cash flow positive although this hasn't been increasing recently (actually has declined) from $504 million in 2004 to $395 million in 2006.
The balance sheet is satisfactory with $254.8 million in cash and $1,226.5 million in other current assets. This total of $1,481.3 million in current assets, easily covers the $1,027.1 million in current liabilities and yields a current ratio of 1.44. (I consider current ratios of 1.25 or higher 'healthy').
What about some valuation numbers on this stock?
Checking Yahoo "Key Statistics" on Wrigley (WWY), we find that this stock is a large cap stock with a market capitalization of $16.01 billion. The company trades at a relatively rich p/e of 30.78 with a forward p/e slightly better (fye 31-Dec-08) estimated at 24.09. Even with the nice growth expected, the company does sell at a relatively rich PEG of 2.49. (I generally like PEG ratios between 1.0 and 1.5).
Examining the Fidelity.com eresearch website on Wrigley, we can see that the company is also relatively richly valued in terms of Price/Sales (TTM) coming in with a ratio of 3.26 compared to an industry average of 1.52. Fortunately, the company is slightly more profitable than the average in its industry, with a Return on Equity (TTM) of 22.50%, compared to the industry average of 20.41% per Fidelity.
Finishing up with Yahoo, we can see that there are 276.14 million shares outstanding and 218.04 million that float. Of these, 6.36 million shares were out short as of 4/10/07, representing a significant 6 days of trading volume (the short ratio) or 3.20% of the float. The possibility of a "squeeze" of the shorts is suggested by the heavy volume of shares traded today--5.35 million already, with an average volume over the past three months of 1.1 million shares/day.
As noted, the company pays a nice dividend of $1.16 (going forward) with a 2.10% yield. The last stock split was a 5:4 split April 12, 2006.
What does the chart look like?
If we examine a "Point & Figure" chart on Wrigley from StockCharts.com, we can see that the stock has moved nicely higher this past year from a $43 level in July, 2006, to the current level near $60. Overall the chart looks encouraging to me if maybe a little overextended on the current move.
Summary: What do I think?
Wrigley is a very interesting stock. I generally do not spend much time on the large cap issues because they tend to move slowly and have a harder time doubling in size! However, Wrigley came out with a very strong earnings report that exceeded expectations on both revenue and earnings. In the face of a significant short interest, the stock climbed sharply today.
More importantly, longer-term, the company has been steadily increasing revenue, earnings, and a dividend (!), with steady free cash flow and a decreasing number of shares outstanding. Their balance sheet is solid.
On a negative note, the p/e is a bit rich, the PEG is about 2.5, and the Price/Sales is higher than the average in the industry. Thus you are paying for what is generally felt to be a "quality" stock, one of the ultimate blue chips stocks out there I would say.
If you are looking for a large cap stock with something which seems to be as recession-proof as chewing gum :), then this stock might just fit the bill. Something to 'chew on' anyhow :)!
Thanks so much for stopping by and visiting! If you have any comments or questions please feel free to leave them on the blog or drop me a line at bobsadviceforstocks@lycos.com. If you get a chance, be sure and listen to my Stock Picks Podcast!
Bob
Sunday, 29 April 2007
"Looking Back One Year" A review of stock picks from the week of December 12, 2005

Hello Friends! Thanks so much for stopping by and visiting my blog, Stock Picks Bob's Advice! As always, please remember that I am an amateur investor, so please remember to consult with your professional investment advisers prior to making any investment decisions based on information on this website.
It is the weekend...at least for a few more hours! And one of the tasks that I have assigned myself here is to examine past stock selections. I am a bit more than a year out even if I say looking back one year :). In any case, last weekend I reviewed the picks from December 5, 2005. Let's take a look at the three stocks discussed on this blog during the week of December 12, 2005.
As I have mentioned before, I personally advocate and employ a very disciplined trading strategy that involves quick sales on losses of entire positions and small partial sales on targeted appreciation points. For the ease of evaluation, this review assumes a different "buy and hold" strategy. Employing a portfolio management strategy like I advocate would necessarily affect the outcome or evaluation. And not necessarily improving the performance!
In any case, let's look at those stocks from the week of December 12, 2005.
 On December 14, 2005, I posted Matrixx Initiatives (MTXX) on Stock Picks Bob's Advice when the stock was trading at $20.63. MTXX closed at $18.01 on April 27, 2007, for a loss of $(2.62) or (12.7)% since posting.
Looking at a "Point & Figure" chart on MTXX from StockCharts.com:
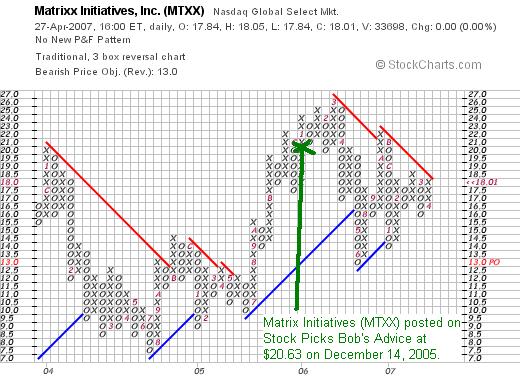
Certainly the chart is not very encouraging with the price trading below the resistance line.
Because of the chart and the earnings report,
MATRIXX INITIATIVES (MTXX) IS RATED A SELL
 On February 12, 2007, Matrixx (MTXX) announced 4th quarter 2006 results. For the quarter ended December 31, 2006, net sales declined to $36.2 million from $44.0 million in the fourth quarter of 2005. The company reported a net loss of $(463,000) during the quarter, an improvement from the $(3) million in loss in the same quarter the prior year.
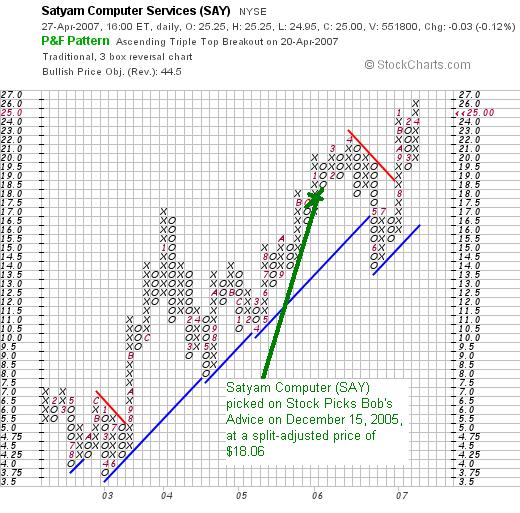
 On December 15, 2005, I picked Satyam for Stock Picks at $36.11/share. (Just two weeks ago, on April 14, 2007, I "revisited" Satyam on Stock Picks Bob's Advice when the stock was trading at $24.60 and actually purchased shares for my own portfolio!) SAY split its stock 2:1 on October 18, 2006, making my effective stock pick price actually $18.06. Thus with the close of trading on April 27, 2007, and the stock trading at $25.00, this represents a gain of $6.94 or 38.4% since posting.
 On April 20, 2007, Satyam announced 4th quarter results. During the quarter ended March 31, 2007, the company reported a profit of $86 million, up 38.6% from last year. Revenue totaled $411 million, up 36.7% from last year's results.
SATYAM COMPUTER (SAY) IS RATED A BUY
If we examine the "Point & Figure" chart on Satyam from StockCharts.com, we can see how strongly the stock has been trading as it continuess to stay on the upside of the support line after hitting some short-term weakness from April, 2006, to July, 2006, last year.

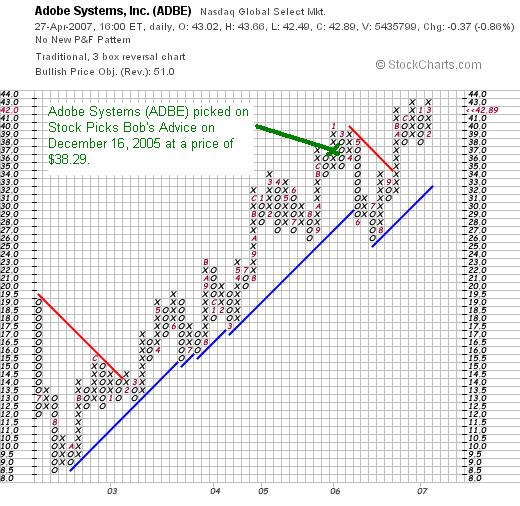
On December 16, 2005, I posted Adobe (ADBE) on Stock Picks Bob's Advice when it was trading at $38.29. ADBE closed at $42.89 on April 27, 2007, for a gain of $4.60 or 12.0% since posting.
On March 20, 2007, Adobe Systems (ADBE) announced 1st quarter 2007 results. Revenue came in at $649.4 million, down slightly from $655.5 million in the same quarter the prior year. GAAP operating income did increase to $146.3 million in the quarter up from $130.0 million in the same quarter in 2006. Diluted earnings per share were $.24 vs. $.17/share in the first quarter of 2006.
The company slightly beat estimates on earnings but missed on revenue in this report.
From my perspective, the failure to achieve revenue growth, while still managing to post improvement in earnings leaves me with this assessment:
ADOBE SYSTEMS (ADBE) IS RATED A HOLD
If we look at the StockCharts.com "Point & Figure" graph on Adobe Systems we can see a very pretty picture suggesting continued strength in this stock. Technically, from my amateur perspective, the chart looks very strong.
So how did I do during that week back in December, 2005, picking stocks? Well really not that bad. I had two gainers and one decliner. The average performance was a gain of 12.6% since posting them on the blog.
Thanks so much for stopping by and visiting! If you have any comments or questions, please feel free to leave them on the blog or email me at bobsadviceforstocks@lycos.com. If you get a chance, be sure and visit my Stock Picks Podcast Website.
Bob
Friday, 27 April 2007
Curtiss-Wright (CW) "Revisiting a Stock Pick"
Hello Friends! Thanks so much for stopping by and visiting my blog, Stock Picks Bob's Advice! As always, please remember that I am an amateur investor, so please remember to consult with your professional investment advisers prior to making any investment decisions based on information on this website.
Earlier today I sold my position on Jones Soda (JSDA) as it had declined to a 30% gain for me (1/2 of my top % sell target reached). This brings me down to 19 positions. It does not entitle me to add a new position, but rather to 'sit on my hands' as the sale was on 'bad' news. However, if I sell a portion of my remaining issues at a gain, well then I shall be once again on the lookout for that 20th position :).
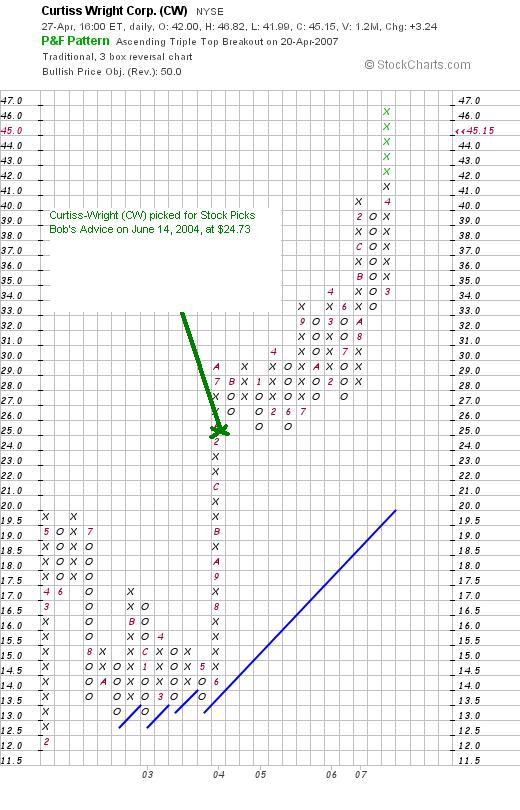
 As I like to do, I was looking through the list of top % gainers on the NYSE to see if I could find a name to discuss this afternoon. Curtiss-Wright (CW) an "old favorite" of mine was on the list and as I write is trading at $45.59, up $3.68 or 8.78% on the day. I say "old favorite" because I first posted CW on Stock Picks Bob's Advice almost three years ago on June 14, 2004, when the stock was trading at $49.46. CW actually had a 2:1 stock split on April 24, 2006, so this makes my effective pick price actually only $24.73. With the stock trading at $45.62, this represents a gain of $20.89 or 84.5%. Unfortunately, I did not then, and I do not now own any shares or options on this company.
Let's take a closer look at this stock and I shall show you why it deserves a place on this blog and why
CURTISS-WRIGHT (CW) IS RATED A BUY
 What exactly does this company do?
According to the Yahoo "Profile" on Curtiss-Wright (CW), the company
"...engages in the design, manufacture, and overhauling of products for motion control and flow control applications worldwide. It operates through three segments: Flow Control, Motion Control, and Metal Treatment."
How did they do in the latest quarter?
Without trying to sound like a 'broken record', (are you all old enough to rember those 33's with the scratches that skipped?), it was the announcement of 1st quarter 2007 results yesterday after the close of trading that drove the stock higher today! Net sales for the quarter ended March 31, 2007, increased 18% to $332.6 million from $282.6 million in the same quarter last year. Net earnings increased 59% to $19.5 million or $.44/diluted share, up from $12.3 million, or $.28/diluted share in the same period in 2006.
The company beat expectations of $.35/share according to Thomson Financial on revenue of $307.2 million.
What about longer-term results?
Examining the Morningstar.com "5-Yr Restated" financials on CW, we can see that revenue has been steadily expanding from $513 million in 2002 to $1.1 billion in 2005 and $1.28 billion in 2006. Earnings during this period have also steadily increased from $1.08/share in 2002 to $1.82/share in 2006.
As if that wasn't enough, the company also pays a dividend and has been steadily increasing it from $.11/share in 2002 to $.24/share in 2006. They have also kept a steady hand on the outstanding shares which have increased less than 10% from 41 million in 2002 to 44 million in 2006. During the same time period, revenue has grown more than 100%, earnings have increased 80% and the dividend has more than doubled. This is a nominal dilution of shares in a rapidly growing company.
Free cash flow has been positive and basically growing recently with $73 million in 2004, dipping to $63 million in 2005, but increasing to $104 million in 2006.
The balance sheet, as presented by Morningstar.com, appears solid with $124.5 million in cash and $498.1 million in other current assets. This total of $622.6 million in current assets, when compared to the $292.1 million in current liabilities yields a current ratio of 2.13. In addition, the company is reported to have $538.0 million in long-term liabilities.
What about some valuation numbers?
Reviewing Yahoo "Key Statistics" on Curtiss-Wright (CW), we can see that this is a mid cap stock with a market capitalization of $2.02 billion. The trailing p/e is a moderate 25.18 with a forward p/e (fye 31-Dec-08) estimated at 19.06. The PEG ratio (5 yr expected) is estimated at a reasonable 1.52.
According to the Fidelity.com Eresearch website, the Price/Sales (TTM) is a tad rich at 1.44 compared to an industry average of 1.39. Also, the company is a bit less than average in profitability as measured by the Return on Equity (TTM) coming in at 11.40%, under the industry average per Fidelity of 20.91.
Finishing up with Yahoo, we can see that there are 44.18 million shares outstanding with 40.20 million that float. Of these that float, 3.50 million are out short with a short ratio of 14.4. This represents 8% of the float and is very significant from my perspective. This is reflected in today's move higher on good news with a volume of 1.1 million shares when the average daily volume on CW is 244,521. The shorts are most likely feeling a bit of a "squeeze" on this stock!
The company, as I noted above, pays a dividend of $.24/share (forward rate) yielding 0.6%. The last stock split was a 2:1 split 4/24/06.
What does the chart look like?
Looking at a "Point & Figure" chart from StockCharts.com, we can see that the stock appreciated from $12 to $20 early in 2002, only to pull back to the $13 level. After June, 2003, the stock started moving strongly higher and has been appreciating strongly since.
Summary: What do I think?
Needless to say I like this stock a lot! The quarterly report was solid, the Morningstar.com page was excellent. I like the fact the company pays a dividend and has been growing it. The balance sheet is fine. Some of the valuation numbers suggest the stock is richly priced, but I suspect if the current quarter continues, estimates will rise, and numbers like PEG, Price/
sales, Return on Equity, which are a bit rich, will improve. On top of it there are loads of short-sellers betting against the stock. Finally the chart looks very strong.
Thanks again for visiting! If you have any comments or questions, please feel free to leave them on the blog or email me at bobsadviceforstocks@lycos.com. If you get a chance be sure and visit my Stock Picks Podcast Website where you can hear me talk about some of the many stocks I write about here on this website.
Have a great weekend everyone!
Bob
Newer | Latest | Older


