Stock Picks Bob's Advice
Sunday, 17 July 2011
The Cooper Companies (COO)
Hello Friends! Thanks so much for stopping by and visiting my blog, Stock Picks Bob's Advice! As always, please remember that I am an amateur investor so please consult with your professional investment advisers prior to making any investment decisions based on information on this website.
 On June 30, 2011, I purchased shares of Cooper Companies (COO) for my Covestor Healthcare Model at a cost basis of $80.62. Cooper has been a company I have admired for the most part from a distance and in fact first reviewed the stock almost 8 years ago on September 1, 2004. Cooper closed at $80.08, down $(.55) or (.68)% on the day. Let's take a closer look at this stock and update my review!
According to the Yahoo "Profile" on Cooper, the company
"... through its subsidiaries, develops, manufactures, and markets healthcare products serving the vision care and women’s healthcare markets worldwide. It offers a range of soft contact lenses for the vision care market, such as toric lenses, which correct astigmatism; multifocal lenses for presbyopia; and spherical lenses that correct the common visual defects. The company also provides aspheric lenses for near and farsightedness. In addition, it engages in the development, manufacture, and marketing of medical devices, diagnostic products, and surgical instruments and accessories used primarily by gynecologists and obstetricians."
On June 3, 2011, Cooper (COO) reported 2nd quarter 2011 results. For the quarter ended April 30, 2011, the company reported revenue of $325.3 million, an 8% increase (in constant currency) exceeding the Zacks estimates of $315 million. The company reported adjusted earnings per share of $1.02, exceeding expectations by Zacks of $.93/share and outperforming the year-ago earnings result of $.61/share.
To top off the fabulous quarterly report, the company raised guidance for fiscal 2011 to a higher range of $3.90 to $4.05/share vs. earlier guidance of $3.60 to $3.80/share. Similarly revenue expectations were guided slightly higher by the company to a new range of $1.23 to $1.3 billion from prior guidance of $1.265 billion to $1.29 billion.
Examining the Morningstar.com "5 Years Financials" on Cooper (COO), we can see that revenue for the company has grown steadily from $859 million in 2006 to $1.16 billion in 2010 and $1.23 billion in the trailing twelve months (TTM).
Earnings dipped from $1.44/share in 2006 to a loss of $(.25) in 2007 only to rebound to $1.43 in 2008, $2.21 in 2009, $2.43 in 2010, and $3.56 in the TTM. Outstanding shares have been very stable with 48 million reported in 2006 and 47 million in the TTM.
Examining the balance sheet, as of October, 2010, Cooper according to Morningstar had $491 million in current assets and $200 million in current liabilities. This yielded a current ratio of 2.46. Thus the balance sheet at least in these measurements demonstrates significant strength.
Free cash flow has bounced around somewhat increasing from $8 million in 2006 to $176 million in the TTM according to Morningstar.com.
In terms of valuation, examining the Yahoo "Key Statistics" on Cooper, we can see that this is a mid cap stock with a market capitalization of $3.76 billion. The trailing p/e is a moderate 22.42, the forward p/e (fye Oct 31, 2012) is estimated at 17.44, and with solid growth predicted, the PEG ratio works out to a reasonable 1.25.
Yahoo reports that the company has 46.9 million shares outstanding with 46.21 million that float. Currently there are 925,000 shares out short, representing 1.6 trading days of volume, well below my own idiosyncratic 3 day rule for significance of the short interest ratio. The company pays a small dividend of $.06/share yielding 0.1% with a payout ratio of only 2%. The last reported stock split of The Cooper Companies (COO) was a 2:1 stock split on November 25, 2002.
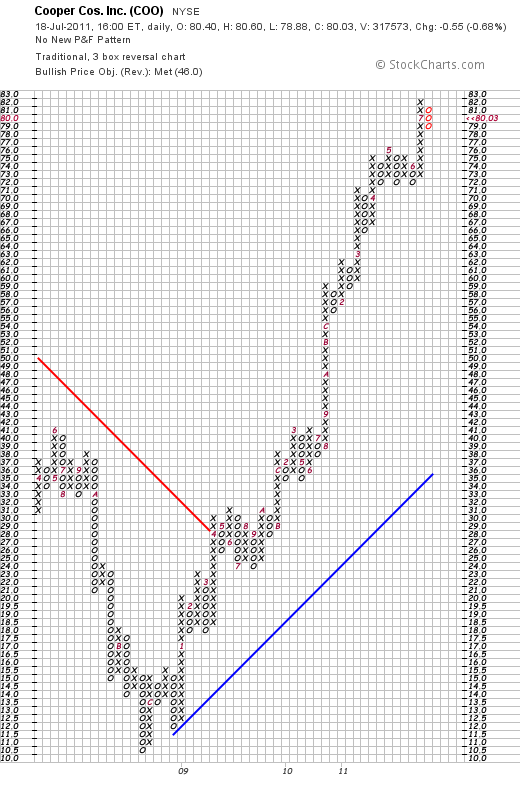
Insofar as the technicals are concerned, Cooper (COO), as seen in this Point & Figure Chart from StockCharts.com, sold off in late 2008 from $40 down to a low of $10.50 in November, 2008. The stock moved higher, breaking through resistance in April, 2009 at the $29 level, and since then has stayed well above support levels reaching a high of $82 this July, 2011, and closed today (7/18/11) at $80.03, down $(.55) or(0.68)% on the day.
In summary, Cooper (COO) is an 'old favorite of mine' that has been performing very well the past two years both technically and fundamentally. Their latest earnings report was strong beating guidance for both revenue and earnings and the company chose to guide estimates higher. Fundamentally, they have been steadily growing revenue and earnings the past five years, have a solid balance sheet, and growing their free cash flow. Outstanding shares are stable, but dividend-wise, could be better.
The company sells at a moderate p/e but sports a PEG of only 1.25 suggesting that valuation is reasonable when earnings growth and estimated growth is considered. Finally, the momentum of the past two years is quite impressive as this stock moves strongly higher in a steady fashion.
As noted, I liked this stock enough to add it to my own Healthcare Model on Covestor.
Thank you so much for stopping by and visiting! If you have any comments or questions, please feel free to leave them right here on the blog!
Yours in investing,
Bob
Monday, 27 June 2011
Hibbett (HIBB)
Hello Friends! Thanks so much for stopping by and visiting my blog, Stock Picks Bob's Advice! As always, please remember that I am an amateur investor, so please consult with your professional investment advisors prior to making any investment decisions based on information on this website.
 On May 20, 2011, I added to my position of Hibbett (HIBB), purchasing shares at $39.42. Hibbett is currently one of my nine holdings in my Covestor "Buy and Hold Value" model. I have been a long-term fan of this company and have owned shares on and off over the years. One of my earliest review of Hibbett (HIBB) on this blog was more than six years ago when I wrote up Hibbett on March 10, 2005.
What has intrigued me and continues to attract me to Hibbett (HIBB) is the retail model that seems to parallel the tremendous growth that another retailer, Wal-Mart Stores (WMT) has experienced. Like Wal-Mart, Hibbett started out in the south, headquartered in Birmingham, Alabama, and has chosen to locate its sporting good stores in small towns often right in a Wal-Mart shopping center.
Ideally, a retail firm can develop a concept and then roll it out into additional outlets with growth coming both from 'same-store' increases and additional growth as new sites are established. Until such time as the concept has 'exhausted' its retail opportunity, an investor can hopefully successfully hold a stock that likely will parallel the underlying growth with appreciation in the price of the related shares. At least that's the theory!
According to the Hibbett Sports website, the company
"...operate sporting goods stores in small to mid-sized markets predominantly in the Southeast, Southwest, Mid- Atlantic and the Midwest.  As of January 29, 2011, we operated 779 Hibbett Sports stores as well as 16 smaller-format Sports Additions athletic shoe stores and 3 larger-format Sports & Co. superstores in 26 states. Our primary retail format and growth vehicle is Hibbett Sports, a 5,000 square foot store located primarily in strip centers which are usually influenced by a Wal-Mart store. Approximately 76% of our Hibbett Sports store base is located in strip centers, which includes free-standing stores, while approximately 24% of our Hibbett Sports store base is located in enclosed malls. We expect to continue our store base growth in strip centers versus enclosed malls."
Certainly, when picking stocks we need more than just good ideas, we need implementation of those ideas into practice. One of the best ways to examine a company's performance is to check its latest quarterly report! On May 23, 2011, Hibbett (HIBB) reported 1st quarter (ending April 30, 2011) results. Earnings came in at $.76/share ahead of the Zacks estimate of $.68/share and significantly higher than last year's $.59/share.
Sales for the quarter came in at $203.7 million, up 10.4% from $184.5 million and ahead of Zacks estimate of $201 million. Comparable stores increased a very healthy 6.8%. According to this report, this was the company's sixth consecutive quarter of comparable store sales growth. Operating margin improved '180 basis points to 16.8% from the prior-year quarter'.
During the quarter the company opened 8 new stores and closed 7 underperforming stores with total reported at 799 stores in 26 states.
In addition, the company raised guidance for the fiscal year to a new range of $1.80 to $1.95/share up from $1.70 to $1.90/share previously provided.
Looking at some longer-term results, Morningstar.com shows that revenue has improved from $512 million in 2007 to $665 million in 2011 and $684 million in the trailing twelve months (TTM). Earnings came in at $1.17/share in 2007, dipped to $.96/share in 2008 and then improved steadily to $1.60/share in 2011 and $1.76/share in the TTM. Outstanding shares have decreased from 33 million in 2007 to 29 million in the TTM. (Stock Buybacks can help support a stock price and improve financial results.)
According to Morningstar, Hibbett (HIBB) has total current assets of $269 million as of 1/2011. Total current liabilities are at $94 million, yielding a current ratio of just under 3. Free cash flow has improved from $20 million in 2007 to $51 million in 2011 and $65 million in the TTM.
In terms of valuation, looking at the Yahoo "Key Statistics" on Hibbett (HIBB), we can see that this company is a small cap stock with a market capitalization of $1.08 billion. The trailing p/e is moderate at 22.45 with a forward p/e (fye Jan 29, 2013 est.) at 17.77. The PEG ratio (5 yr expected earnings) works out to a more reasonable 1.16.
Yahoo reports 27.32 million shares outstanding with 27.16 million that float. As of June 15, 2011, there were 4.68 million shares out short representing a short ratio of 9.7 days of trading volume. This is above my own arbitrary 3 day rule for short interest and may be a bullish indicator for this stock. The company does not pay a dividend and last split 3:2 in September, 2005.
If we examine the StockCharts.com 'point & figure' chart on Hibbett (HIBB), we can see that this stock which traded as low as $10.50 in November, 2008, has steadily and regularly moved higher to its current level of $39.44 where it closed today (6/27/11).
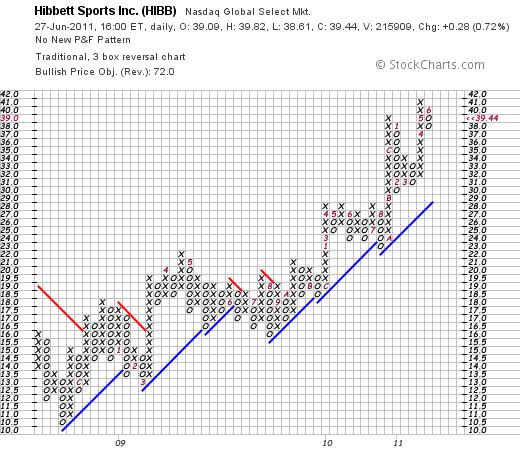
Simply put, the above chart is quite strong as the company has broken through resistance time after time the past two years and has moved higher above support levels.
To summarize, I like Hibbett (HIBB) and have been a fan and intermittent owner of the stock over the last 8 years as I have chronicled here on this blog. The company is carefully executing its expansion tracking alongside many Wal-Mart stores in strip malls in the south, southeast and midwest. They reported strong earnings that exceeded expectations in both the earnings amount as well as the sales figures. Furthermore, they raised expectations. Valuation appears reasonable althought the p/e is in the low 20's, the PEG is just a bit over 1.1. Finally the chart looks strong.
Frankly, I am more 'couch potato' than 'jock', but I can see value in the investment in this sporting goods firm.
Thanks so much for stopping by and visiting! If you have any comments, please feel free to leave them right here on the website.
Yours in investing,
Bob
Sunday, 12 June 2011
Perrigo Co. (PRGO)
Hello Friends! Thanks so much for stopping by and visiting my blog, Stock Picks Bob's Advice. As always, please remember that I am an amateur investor, so please remember to consult with your professional investment advisors prior to making any investment decisions based on information on this website.
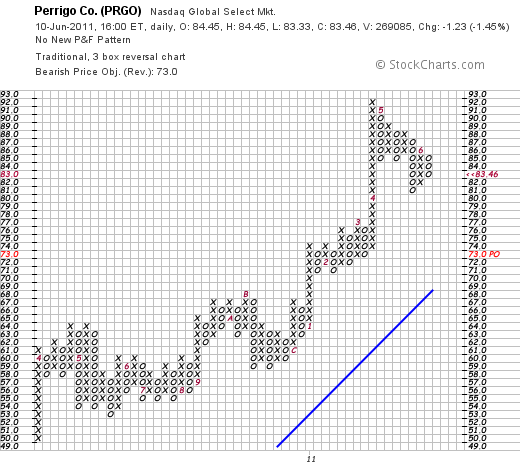
 One of my holdings in my own trading account is Perrigo (PRGO) that I purchased on 2/2/11 with a cost basis of $73.19. Perrigo closed at $83.46 on 6/10/11, down $(1.23) or (1.45)% on the day. I would like to share with you my thoughts on this stock as they illustrate once again my thinking on what makes a stock attractive for purchase.
According to the Yahoo "Profile" on Perrigo, this company
"... through its subsidiaries, develops, manufactures, and distributes over-the-counter (OTC) and generic prescription (Rx) pharmaceuticals, nutritional products, infant formulas, active pharmaceutical ingredients (API), and pharmaceutical and medical diagnostic products worldwide."
One of the first things I check when examining a stock for investment is how the underlying company is doing. Probably the most important factor is their latest quarterly report. Looking at this information I certainly would like to see a company that can grow its business (organic growth preferred over growth just from acquisitions), is profitable and is doing better than expected. Sometimes we as investors can get lucky and the company raises the ante so to speak by increasing guidance. A price of a stock is determined by past and expected results. There is a certain re-equilibration of the stock price as analysts and investors digest the provided information and re-set estimates going forward.
On May 3, 2011 Perrigo reported third quarter 2011 results. Revenue for the quarter came in at $691.6 million, a 29% increase from the prior year which in itself is an impressive results. However, equally important the company exceeded expectations of $685.8 million. Earnings came in at $89.1 million or $.95/share for the quarter ended March 26, 2011. Adjusted income from continuing operations (what analysts generally are estimating) came in at $1.07/share. This was a 43% increase in earnings over the prior year when the company had reported earnings of $62.2 million or $.67/share. Similarly, analysts had been expecting earnings of $.96/share so the adjusted income again exceeded expectations.
Occasionally companies use earnings announcements to provide guidance for analysts and investors about how management is viewing future prospects for the business. Hopefully the company is anticipating growth in earnings and revenue. Sometimes they will confirm pre-existing guidance, but it is also possible that managenent can reduce guidance or on the other hand, if things are doing well, the company may well revise prior estimates and raise guidance. Again, if we consider that stock prices are determined in a complex fashion that takes into consideration estimates of future earnings, clearly raising guidance will cause some investors to reprice the value of the given stock higher.
In any case, Perrigo, in the same earnings report raised guidance for adjusted earnings per share to come in at $3.90 to $4.00, up from the prior guidance of $3.75 to $3.90.
Ideally, a stock will perform well not because it just reported a single quarterly report that looked good, but rather that the company was continuing a longer-term record of such positive financial results. I utilize Morningstar.com which provides both free as well as subscription information.
If we look at the Morningstar financials on PRGO, we can see that revenue has grown steadily from $1.37 billion in 2006 to $2.27 billion in 2010 and $2.67 billion in the trailing twelve months (TTM). In that same period diluted earnings per share have grown steadily from $.77/share in 2006 to $2.40/share in 2010 and $3.23/share in the TTM.
Morningstar shows that free cash flow, has increased from $90 million in 2006, dipping to $24 million in 2007, then steadily growing to $258 million in 2010 and pulling back a touch to $255 million in 2011. This company clearly is able to generate increasing cash as it grows its business.
In terms of the balance sheet, Perrigo has $1.381 billion in current assets balanced against $907 million in current liabilities. This generates a current ratio of 1.52. Generally current ratios of 1.5 or higher suggest a healthy, at least short-term, financial health. Perrigo has total assets of $3.09 billion compared to total liabilities of $2.01 billion.
Beyond the fact that a company underlying a stock is doing well, which apparently Perrigo (PRGO) has been doing, it is important to find out about the valuation of the stock price to help determine if the purchase of the shares is a reasonable option. I have found that the easily accessible Yahoo "Key Statistics" continues to be helpful in this regard.
For Perrigo, we can see that the market cap is $7.74 billion making this a large cap stock. Perrigo's trailing p/e is a bit rich at 25.87, but the forward p/e (fye Jun 26, 2012) is a bit better at 18.30. The reasonableness of a p/e is really a function of anticipated growth. You and I are obviously more willing to pay higher p/e valuation if we are fairly certain that future earnings will increase significantly. This 'dynamic valuation' is calculated via the PEG ratio which for Perrigo comes in at a fairly reasonable 1.59.
Perrigo has 92.73 million shares outstanding with 85.67 million of them that float. The company pays a modest dividend of $.28/share with a forward yield of .30%. (The trailing dividend is 0.27 indicating a recent increase.) The company has lots of room to raise the dividend and use earnings for corporate purposes as their payout ratio is only at 8% per Yahoo. Their last stock split was back in August, 1993, when the stock was split 2:1.
Finally let's take a look at the technicals which basically for me is an examination of the point and figure chart from StockCharts.com. In particular, checking Perrigo's Point & Figure Chart from StockCharts.com, we can see a chart that was basing through much of 2010 between the $53 and $65 level and that 'broke out' in March, 2011 to its recent high of $92 before pulling back to its $83 level. The chart looks strong from my amateur perspective.
In summary, I like Perrigo (PRGO) enough that I bought shares! From a 'story' perspective, the challenges that our current economy faces has forced more consumers to watch their purchases closely and Perrigo fits into that theme selling companies 'store brand' generics to compete with more expensive branded items.
They recently reported a very strong quarterly report and have been growing their business steadily for the last five years. Their recent results exceeded analysts' expectations and the company provided bullish guidance going forward. Valuation is a tad rich but not really wildly out of balance with the expected performance. Technically the stock looks strong and appears to be a price move higher.
I do not know what the stock market will hold going forward. It may well be wise to wait before entering any new positions in a market we are facing, but I believe that long-term, it is wisest for the investor like myself to identify stocks of companies with the characteristics that I have commented on throughout my blog multiple times. I hope you find these evaluations useful!
If you have any comments or questions, please feel free to leave them right here on the blog.
Yours in investing,
Bob
Thursday, 9 June 2011
A Reader Writes: "Juniper Networks (JNPR) is an Alternative to Cisco"
Hello Friends! Thanks so much for stopping by and visiting my blog, Stock Picks Bob's Advice! As always, please remember that I am an amateur investor, so please remember to consult with your professional investment advisers prior to making any investment decisions based on information on this website!
Recently I received a submission from a fellow blogger, Nicolas, who is a co-founder of a new "networking platform to classify and rank investors according to the performance of their stock tips" called Stocktipr.com. I cannot vouch one way or another for the information on that site but would encourage you to visit!
Nicolas asked me if he could submit an article to this website, and without any further delay, what he wrote follows this introduction. He has let me know that he does not (as of June 4, 2011) have any shares nor does he have any financial relationship with Juniper (JNPR).
 Juniper Networks, with headquarters in Sunnyvale, California, is a computer networking products company. Many investors, when looking for a stock pick in the computer network category, naturally look to Cisco Systems, the most recognizable of these firms. However, Cisco is now trading at a 52 week low while its PE is heading toward single digits, something that veteran stock pickers thought would never happen. Cisco's recent guidance warned that fourth quarter revenue would “be relatively flat compared to the prior year period, which represents lower revenue levels than we had previously anticipated at the beginning of fiscal 2011.” This is not positive news and obviously does not bode well for the near term. Cisco may look cheap around 16 dollars per share, but it is trading there for a reason. Remember, cheap stocks many times get cheaper.
A good alternative to Cisco is Juniper Networks. Juniper is well off of its 52 week low and its current PE of 34 shows a very positive degree of general investor confidence. Sales revenue, gross profits and earning per share all increased dramatically in the fourth quarter of 2010. The fact that Juniper is off its 52 week high shows that there is still room for upward price movement in the short term. Juniper also sports a low debt to equity ratio which, as seasoned investors know, indicates that the company has funded itself more conservatively and therefore has lower risk of future debt problems. (Cisco's debt to equity ratio is significantly higher than that of Juniper.)
Although Juniper is significantly smaller than Cisco, the company appears to be very nimble. In fact, in a recent article, Forbes said "competitors like Juniper, HP and Alcatel-Lucent have been making inroads and nipping at Cisco's market share in its core markets like switching and routers." As good investors know, many times small companies are able to innovate and move at a much quicker pace than large entities.
Those looking to enter the computer network sector would be well served by Juniper. Strong revenues coupled with solid earnings and positive investor sentiment makes Juniper an excellent choice in this sector.
Nicolas
Nicolas is co-founder and president of Stocktipr.com, a new networking platform to classify and rank investors according to the performance of their stock tips. Nicolas does not own any shares of Juniper Networks for now and don’t have any financial relationship you might have with the company. Nicolas is an amateur investor, so please remember to consult with your professional investment advisers prior to making any investment decisions.
Thank you Nicolas! I do not personally have an opinion on Juniper (JNPR) which closed at $31.90 on 6/9/11, but shall add it to my own 'watch list' and see how this stock tip of yours works out! Good-luck to you on your own website, and hopefully we can arrange some additional guest posts right here!
Yours in investing,
Bob
Sunday, 22 May 2011
Illinois Tool Works (ITW)
Hello Friends! Thanks so much for stopping by and visiting my blog, Stock Picks Bob's Advice! As always, please remember that I am an amateur investor, so please remember to consult with your professional investment advisors prior to making any investment decisions based on information on this website.
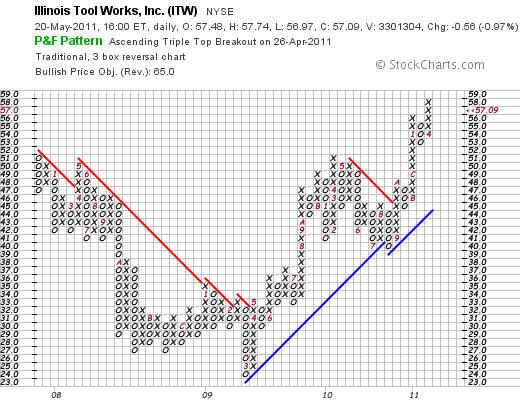
 Last month, on April 26, 2011, I purchased shares of Illinois Tool Works (ITW) at a cost basis of $58.97. ITW closed at $57.09 on 5/19/11, down $(.56) or (.97)% on the day. I still like this stock and wanted to share with you my thinking on this one.
The economic recovery has been anemic for many complex reasons, but the industrial base has started to recover. Anticipating this stock rotation into industrial companies, I have purchased shares of Danaher (DHR) which I discussed earlier as well as Illinois Tool Works (ITW).
When I think about investing in a stock, one of the strongest factors influencing that decision is the very latest quarterly report. In brief, did the company show strong growth, beat expectations, and provide positive guidance? If they did, and the company has a record of reasonably steady growth, a strong chart, and good value as well as acceptable financials, I am interested. You might say that's a lot to ask of an investment. Fortunately, there are a lot of stocks to choose from and we all can stand to be a little selective in our purchases.
According to the Yahoo "Profile" on Illinois Tool Works (ITW), the company
"...manufactures a range of industrial products and equipment worldwide."
The company's divisions include a 'Transportation segment', an 'Industrial Packaging segment', a 'Food Equipment segment', a 'Power Systems & Electronics segment, a 'Construction Products segment', a 'Polymers & Fluids segment', and a 'Decorative Surfaces segment'.
On Tuesday April 26, 2011, (the same day I purchased shares), Illinois Tool Works (ITW) announced 1st quarter results. Revenue for the quarter came in at $4.39 billion, ahead of analysts' expectations of $4.16 billion. Adjusted net income came in at $623.1 million or $1.24/share ahead of the $333.8 million or $.66/share last year. Removing a one-time benefit of $.33/share from a settled Australian tax case, the company earned $.91/share also ahead of expectations of $.84/share.
To top off the report, the company announced new revenue guidance of $18.41 to $18.73 billion, an approximately 11.5 to 14.5% increase over the prior year. Full-year earnings are now expected to come in at $4.16 to $4.34/share, well ahead of prior guidance of $3.60-$3.84/share.
In addition, for the upcoming quarter the company forecasted earning sof $.99 to $1.05/share on revenue of $4.77 to $4.89 billion. Analysts are currently expecting $1/share on revenue of $4.59 billion.
This is the kind of earnings report I like to see on making a decision to buy shares!
Looking at longer-term results on Morningstar, the Financials show that revenue has been recently been improving with revenue which had dipped to $13.9 billion in 2009, improving to $15.9 billion in 2010 and $16.5 billion in the trailing twelve months (TTM).
Similarly earnings/share (diluted) increased from $3.01/share in 2006 to a peak of $3.36 in 2007, then dipped to $1.89 in 2009 and improved to $3.03 in 2010 and $3.61 in the TTM. The company has kept the lid on share growth with 571 million in 2006 dipping to 500 million in 2009 before increasing slightly to 503 million in 2010.
Morningstar shows that the company has $6.0 billion in current assets compared to $3.1 billion in current liabilities, with an almost 2.0 current ratio. Free cash flow is strongly positive but not growing with $2.1 billion reported in 2007 dipping to $1.3 billion in 2010 and $1.1 billion in the TTM.
If we review the Yahoo "Key Statistics" on Illinois Tool Works (ITW) we can see that this is a large cap stock with a market capitalization of $28.55 billion. The company trades with a trailing p/e of only 15.81 and a forward p/e (fye Dec 31, 2012) of 12.44. The PEG ratio (5 yr expected) comes in at a reasonable 1.08. There are 500 million shares outstanding with 464 million of them that float. As of 4/29/11 there were 8.46 million shares out short representing a short ratio of 3.00. (I generally don't attribute significance to short interest ratios unless they exceed 3.0---my own rule!)
The company pays a nice dividend of $1.36/share with a forward annual yield of 2.4%. The last stock split was a 2:1 split on May 26, 2006.
If we examine the 'Point & Figure' chart on ITW from StockCharts.com, we can see that the stock dipped from $51 in December, 2007, to a low of $24/share in March, 2009. Since that low, the stock has been technically very strong showing corrections with pull-backs each higher than the previous.
In summary, Illinois Tool Works (ITW) represents a company, a bit like Danaher (DHR) that is a manufacturer rebounding as the American economy rebounds. They recently reported a solid quarterly report that beat what analysts had been expecting and the company went ahead and raised guidance from previous estimates of future performance. Valuation is solid, the financials are reasonable, and technically the stock appears to be 'on a roll'!
I liked it so much I bought shares!
Thank you again for visiting my blog. I shall continue to try to post entries a bit more regularly and I certainly appreciate your continued interest and support. I might even get around to a podcast later this week!
Yours in investing,
Bob
Monday, 16 May 2011
Danaher (DHR)
Hello Friends! Thanks so much for stopping by and visiting my blog, Stock Picks Bob's Advice! As always, please remember that I am an amateur investor, so please remember to consult with your professional investment advisers prior to making any investment decisions based on information on this website.
Before I go much further I would like to apologize for my hiatus from blogging on this website. For those of you who regularly stop by, I am sure it is a disappointment to see a lack of activity on this website. For those of you new to the blog, thank you for stopping by! I shall work to keep this blog up to date.
 On May 13, 2011, I purchased shares of Danaher (DHR) at $54.44 in my own Trading Account. As part of my effort at trading transparency, I would like to share with you some of my own observations and things that made this stock attractive to me. Danaher closed at $53.99 on 5/16/11 up $.13 or .24% on the day.
According to the Yahoo "Profile" on Danaher (DHR), the company
"...designs, manufactures, and markets professional, medical, industrial, commercial, and consumer products in the United States and internationally. It operates in four segments: Professional Instrumentation, Medical Technologies, Industrial Technologies, and Tools and Components."
Looking at the latest quarterly report, Danaher (DHR) reported 1st quarter results on April 21, 2011. Earnings came in at $429.4 million or $.63/share compared with $300.2 million or $.45/share the prior year. From my  perspective, besides the solid earnings report, the company exceeded expectations of $.57/share according to Thomson Reluters. In addition, the company also beat expectations by reporting revening of $3.35 billion an 11% increase over the prior year.
In that same report, the company optimistically raised guidance for analysts and increased its estimate of 2011 profits to $2.65 to $2.75/share up from prior range of $2.55 to $2.70. As reported, analysts are currently looking for $2.69/share.
An earnings report that reveals solid results that beat expectations and finds management raising guidance is about my equivalent for an earnings "Nirvana". What else could an investor want from a news announcement?
Reviewing the Morningstar.com 'Financials' on Danaher, we can see that revenue has grown from $9.6 billion in 2006 to $13.2 billion in 2010 and $13.5 billion in the trailing twelve months (TTM). Earnings have increased from $1.74/share in 2006 to $2.64/share in 2010 and $2.80/share in the TTM. Both revenue and earnings dipped between 2008 and 2009 and have rebounded since that time. Outstanding shares have increased during this time from 651 million in 2006 to 683 million in 2010 and 685 million in the TTM.
Morningstar reports that Danaher (DHR) has $5.7 billion in 'Total Current Assets' as of 12/10, compared with a total $3.3 billion in 'Total Current Liabilities' yielding a healthy Current Ratio of 1.73.
Free Cash Flow has increased from $1.4 billion in2006 to $1.87 billion in 2010 and $1.90 billion in the TTM.
In terms of valuation, reviewing the Yahoo "Key Statistics" on DHR, we find that the company is a large cap stock with a market capitalization of $35.85 billion. According to Yahoo, the company has a trailing p/e of 19.15, a forward (fye Dec 31, 2012) p/e of 17.42, and a PEG ratio (5 yr expected) of 1.22. From my perspective, a PEG of under 1.5 demonstrates reasonable valuation.
The company has 664 million shares outstanding with a float of 547 million. As of 4/29/11, there were 10.9 million shares out short, slightly ahead of my own '3 day rule' for short interest ratio, suggesting some bullish potential of these short shares.
The company pays a small dividend of $.08 yielding 0.2%. There is a lot of room for dividend increases as this represents a payout ratio of only 3%. The company last had a stock split June 14, 2010, when it declared a 2:1 stock split.
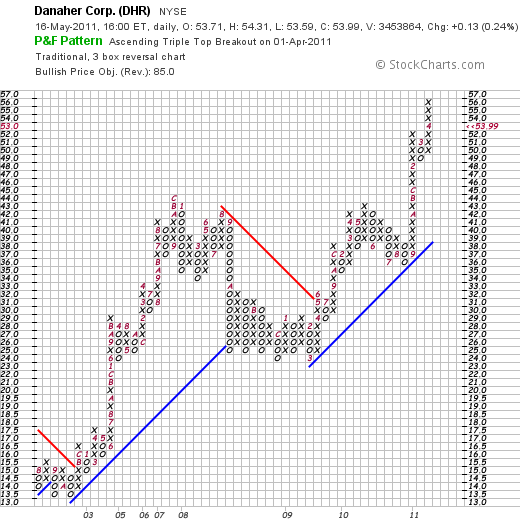
In terms of technical performance, we can examine a Point & Figure chart from Stockcharts.com on Danaher (DHR). This stock has shown tremendous strength since breaking out in May, 2003, at the $17 level and climbing into the mid $40's. After pulling back to the $25 range in 2008, the stock once again broke out in March, 2009 and has climbed to its current levels after peaking in April, 2011, in the $56 range.
In conclusion, Danaher (DHR) represents an investment opportunity reflecting the continued American economic recovery. Even though the stock has already performed quite well this year, valuation-wise the company is selling at a PEG of just over 1.2, and just reported revenue and earnings that exceeded expectations while raising guidance for the near future. All of these facts and especially the solid earnings results encouraged me to add this stock to my own portfolio.
Thank you again for stopping by and visiting my blog. Your loyalty, especially with my own neglect of this website, is appreciated. If you have any comments or questions, please feel free to leave them on the blog.
Yours in investing,
Bob
Wednesday, 26 January 2011
Cisco (CSCO)
Hello Friends! Thanks so much for stopping by and visiting my blog, Stock Picks Bob's Advice! As always, please remember that I am an amateur investor, so please remember to consult your professional investment advisers prior to making any investment decisions based on information on this website.
 There are few companies with a record of growth in both revenue, earning, and stock price to match Cisco (CSCO). From the Cisco website I have included a chart of the revenue growth for this company that is just a year or two over 25. The history of this company is just as intriguing as the usual garage start-up story that is the story of Apple (AAPL) and other silicon valley companies.
I do not own any shares of Cisco (CSCO). The stock closed at $21.42 on 1/26/11, down $.12 or (-.56%) on the day.
As the story goes:
"Cisco was founded on December 10, 1984 by husband and wife Len Bosack and Sandy Lerner, two former Stanford University computer scientists whose efforts to enable email between computers on different networks led to the invention of the first multiprotocol router. This seminal breakthrough played a major role in fueling the growth of the Internet."
This company generated an incredible record of revenue growth:
And yet, the stock price has lagged the growth in revenue. If we look at a ten-year chart of Cisco (CSCO) from Fidelity.com, we can see that Cisco has gone absolutely nowhere during this period of continued growth.
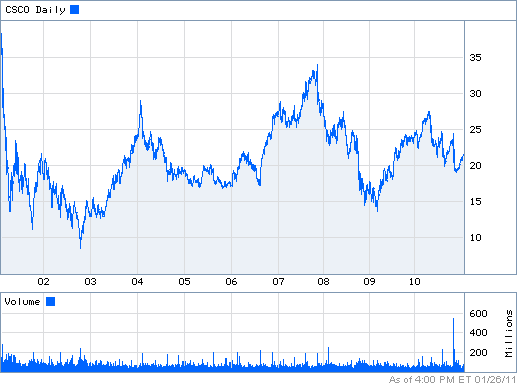
Is it possible then that with this absence of price appreciation while the company continued to grow is business, that this company might just possibly be a terrific value for an investor? Or will this stock instead be stuck in another ten year period of no price appreciation?
Let's briefly take a look at this stock, this company, and see whether it might be a stock we should be adding to our own porfolios.
According to the Yahoo "Profile" on Cisco (CSCO), the company
"...designs, manufactures, and sells Internet protocol (IP)-based networking and other products related to the communications and information technology industry worldwide. It offers routers that interconnect public and private IP networks for mobile, data, voice, and video applications; switching products, which offer connectivity to end users, workstations, IP phones, access points, and servers; application networking services; and home networking products, such as adapters, gateways, modems, and home network management software products. The company also provides security products comprising span firewall, intrusion prevention, remote access, virtual private network, unified client, Web, and email security products; storage area networking products that deliver connectivity between servers and storage systems; unified communication products to integrate voice, video, data, and mobile applications on fixed and mobile networks; video systems, including digital set-top boxes and digital media products; and wireless systems."
Clearly Cisco, through its internal growth and many acquisitons does a lot of high-tech 'stuff'.
In the latest quarter, CSCO reported 1st quarter 2011 results on November 10, 2010. Revenue for the quarter came in at $10.75 billion, up 19% above the forecast of $10.74 billion. Earnings came in at $.42/share (after unusual items), beating expectations of $.40/share the analysts expected. All in all it wasn't a bad report except that there was some uncertainty about the economy and that new orders were below company expectations. The stock didn't bounce on the news of the earnings exceeding expectations, but dipped again on the guarded outlook.
Looking longer term at the Morningstar.com "5 Yr Financials", we can see that the company has grown even while the stock price stagnated with revenue of $28.5 billion in 2006, increasing to $40 billion in 2010 and $41.8 billion in the trailing twelve months (TTM). Diluted earnings per share came in at $.89/share in 2006, increasing to $1.33/share in 2010 and $1.36 in the TTM. During the same period, CSCO has been buying back shares with 6.3 billion in 2006, reducing this number to 5.85 billion in 2010 and 5.80 billion in the TTM.
In terms of the balance sheet, Morningstar shows Cisco with $51.4 billion in current assets as of 7/10, and $19.2 billion in total current liabilities. Indeed total liabilities, including both current and long-term liabilities, totaled $36.8 billion suggesting Cisco (CSCO) was financially fit, easily covering ALL of its liabilities with just the current liabilities.
Free cash flow has been solid with $7.1 billion reported in 2006 increasing up to $9.18 billion in the TTM.
Valuation-wise, looking at "Key Statistics" on Cisco (CSCO) from Yahoo, we can see that this is a large cap stock with a market capitalization of $118.73 billion. The trailing p/e is 15.64 and the forward p/e (fye Jul 31, 2012) is 11.70. Thus, the PEG ratio is a very inexpensive 1.09. Yahoo reports 5.54 billion shares outstanding with the same number of shares that float. As of 12/31/10 there were 41.16 million shares out short representing 0.6 days of trading volume (well below my own arbitrary 3 day rule). There are no dividends paid, and the last stock split was over 10 years ago, a 2:1 split on March 23, 2000. It should be noted that Cisco (CSCO) while currently not paying a dividend, intends to start paying one in 2011.
As I indicated above, CSCO has gone relatively nowhere in terms of its stock price for the past ten years. Looking at a recent 'point & figure' chart on Cisco from StockCharts.com, we can see that for at least the past 6 years, we have seen what could best be described as a sine wave pattern in stock price.
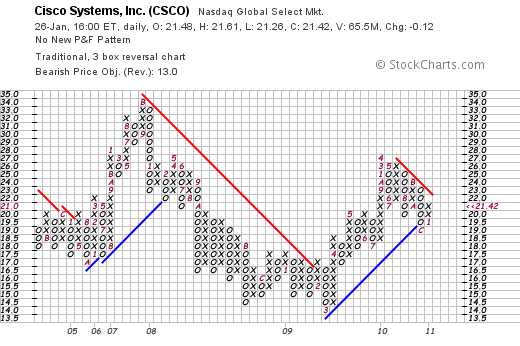
From all of this, we can see that certainly Cisco (CSCO) as a stock has good value with a p/e in the low teens and a PEG just above 1.0. The company has been growing its revenue, its earnings, but its stock price has been lagging. As our economy recovers and interest in networking and cloud computing grows, it appears that we may be early in Cisco (CSCO) as an investment and with valuation where it is, it appears to be in a good position to appreciate in price.
Thank you again for stopping by and visiting my blog! If you have any questions or comments please leave them right here on this website or email me at bobsadviceforstocks@lycos.com.
Yours in investing,
Bob
Monday, 24 January 2011
Amazon (AMZN)
Hello Friends! Thanks so much for stopping by and visiting my blog, Stock Picks Bob's Advice! As always, please remember that I am amateur investor, so please remember to consult with your professional investment advisers prior to making any investment decisions based on information on this website.
 Like so many of you, I have gradually become a confirmed fan of the Amazon retail website. It is incredibly easy and the service is incredibly good at finding all sorts of merchandise that I might otherwise not purchase and delivering it right to my doorstep. In spite of my own endorsement of the 'Amazon experience', I do not own any shares of Amazon (AMZN) which closed at $176.85 on 1/24/11.
Perhaps to understand the Amazon (AMZN) retail pipeline it may be helpful to know a little about its namesake, the Amazon River. I found this website on the Amazon that revealed this information:
"The Amazon River is the world's second longest river. Only the Nile, in Africa, is longer. The Amazon however, at any one point in time has the highest amount of water flowing down it. No other river even comes close. It may not be the longest, but it is the widest.
The Amazon produces approximately 20 percent of all the water that the world's rivers pour into the oceans on its own."
Much like the Amazon River, much of the retail business that once flowed through the bricks and mortar retail stores down at the local mall, now go through the internet channels run by Amazon.com. Let's take a closer look at this retailing phenomenon and see if it is a worthwhile investment today.
According to the Yahoo "Profile" on Amazon (AMZN), the company
"...operates as an online retailer in North America and internationally. The company operates various retail Web sites, including amazon.com, amazon.co.uk, amazon.de, amazon.fr, amazon.co.jp, amazon.ca, and amazon.cn. Its product categories include books; movies, music, and games; digital downloads; electronics and computers; home and garden; toys, kids, and baby; grocery; apparel, shoes, and jewelry; health and beauty; sports and outdoors; and tools, auto, and industrial."
As reported on the Amazon Website, AMZN reported 3rd quarter results on October 21, 2010. Net sales for the quarter grew 39% to $7.56 billion from $5.45 billion in the same quarter the prior year. Net income increased 16% to $231 million in the quarter or $.51/diluted share, up from $199 million or $.45/diluted share the prior year.
The company beat expectations of earnings of $.48/share on revenue of $7.35 billion. However, with operating income of $268 million, below estimates of $289.5 million, resulted in margins of 3.5%. What was thought to be relatively lackluster margins pressured the stock price after this report.
Looking at the longer-term results from Morningstar.com, we can observe the phenomenal record of Amazon (AMZN) in developing its business model. Revenue for the company has increased from $8.49 billion in 2005 to $24.5 billion in 2009 and $30.8 billion in the trailing twelve months (TTM). Diluted earnings per share came in at $.84/share in 2005, dipped to $.45/share in 2006 and then steadily increased to $2.04 in 2009 and $2.47 in the TTM. During this period of explosive growth in revenue, outstanding shares have been relatively stable with 426 million shares in 2005, dipping to 424 million in 2007, and recently increasing to 432 million in 2008, 442 million in 2009 and 454 million in the TTM.
In terms of the balance sheet, Morningstar reports that Amazon has $9.8 billion in total current assets balanced against $7.36 billlion in total current liabilities and total liabilities of $8.56 billion.
Free cash flow came in at $529 million in 2005, dipped to $486 million in 2006 and steadily increased to $2.92 billion in 2009 before dipping slightly to $1.83 billion in the TTM.
In terms of valuation, looking at the Yahoo.com "Key Statistics" on Amazon (AMZN), we find that the market cap is a large cap value of $79.38 billion. The stock has a rich trailing p/e of 71.63 and a forward p/e (fye Dec 31, 2011) of 50.97. The PEG is also rich at 2.61. (My own 'reasonable' value for this statistic remains 1.0-1.5).
Yahoo reports that the company has 448.84 million shares outstanding with a float of 353.14 million. As of 12/31/10 there were 8.93 million shares out short representing 2 days of average volume (well under my own '3 day rule' for significance.) The company does not pay a dividend and the last stock split was a 2:1 split on September 2, 1999.
Checking the StockCharts.com 'point & figure' chart on Amazon (AMZN), we can see a solid chart with weakness last year in April, 2010, when the stock sold off from $150 down to $104 by the end of July only to once again to rebound to new heights.
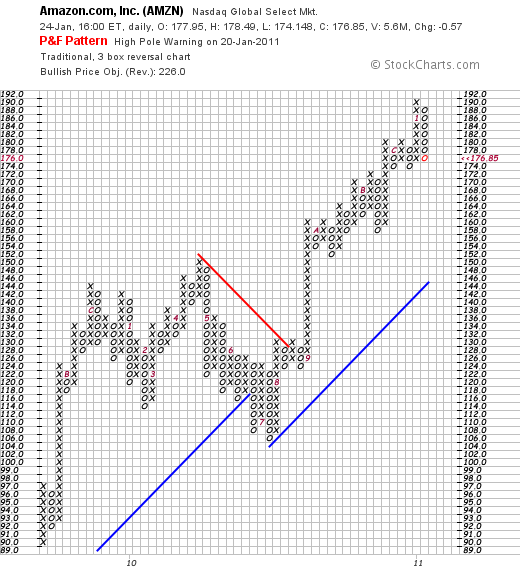
So what is an investor to do about Amazon (AMZN), a stock that sells at a p/e north of 70 and a PEG over 2.5? It is easy to say it is just too expensive and maybe it is wiser to buy a value retail stock like Wal-Mart (WMT) that sells with a p/e of 13.88 and a PEG of 1.29. But there is more to value in making a decision about an investment like this. If we believe that there are few companies that can now compete with Amazon in the same wide and extensive fashion, then we can believe that this company has a 'moat' that may actually justify this premium valuation.
Perhaps it would be wise to wait for a market correction to allow a healthier entry price into this stock. But just as reasonable might be just to hold one's nose and own it because there is no company quite like Amazon and Jeff Bezos and the Amazon folk have created one heck of a company that doesn't appear to be done growing its niche.
Thank you again for stopping by and visiting this blog. If you have any comments or questions, please feel free to leave them right here or email me at bobsadviceforstocks@lycos.com.
Yours in investing,
Bob
Sunday, 26 December 2010
HMS Holdings (HMSY)
Hello Friends! Thanks so much for stopping by and visiting my blog, Stock Picks Bob's Advice! As always, please remember that I am an amateur investor, so please remember to consult with your professional investment advisers prior to making any investment decisions based on information on this website.
Filling out holdings in my Covestor Healthcare Model, I purchased shares of HMS Holdings (HMSY) on December 16, 2010, at a cost of $63.91. As of December 23, 2010, HMSY closed at $65.65, up $.01 or .02% on the day. I would like to share with you some of the facts about this company that led me to decide to purchase shares and add it to my portfolio.
 It is obvious to us all that Health care costs are a large part of our economy and a big cost to businesses and individuals. In fact, this Kaiser Family Foundation report notes that in the United States, expenditures have risen from $714 billion in 1990 to $2.3 trillion in 2008. By 2008, health care spending "...was about $7,681 per resident and accounted for 16.2% of the nation's Gross Domestic Product." HMSHoldings (HMSY) is involved in dealing with these expenditures and thus finds itself in an area of opportunity for its own business.
According to the Yahoo "Profile" on HMS (HMSY), the company
"...provides cost management services for government-sponsored health and human services programs."
On October 29, 2010, HMSY came out with 3rd quarter results. Revenue for the quarter ended September 30, 2010, increased 35.3% to $80.0 million from $59.2 million the prior year. Net income came in at $11.0 million or $.39/diluted share compared with $8.4 million or $.30/diluted share the prior year. The company went ahead and raised guidance for 2010 from $290 million in revenue and $1.38/share in earnings to $300 million and $1.40/share in diluted earnings per share. Furthermore, the company announced 2011 guidance with revenue expected to increase 23.3% to $370 million and earnings now projected to increase 24.3% to $1.74/share.
With this 3rd quarter result, the company beat expectations of analysts who had been expecting revenue of $75.4 million and earnings of $.37/share. Thus with this announcement, the company beat expectations and raised guidance both for this fiscal year and the fiscal year to come (2011). This continues to be very bullish for the company and for the stock price.
Examining the Morningstar.com report for HMSY, we can see that longer-term, the company has steadily increased revenue from $60 million in 2005 to $229 million in 2009 and $282 million in the trailing twelve months (TTM). Fully diluted earnings did take a dip from $.36/share in 2005 to $.22/share in 2006. However, since 2006, they have steadily grown to $1.09/share in 2009 and $1.31 in the TTM. Outstanding shares have modestly increased from 22 million in 2005 to 27 million in 2008 and 28 million in the TTM.
In terms of free cash flow, the company reported $5 million in 2005 and $24 million in 2009 and did dip slightly to $20 million in the TTM. Morningstar reports that HMSY has $140 million in total current assets balanced against $26 million in total current liabilities and a total of $32 million of all liabilities. Thus the company could easily pay off ALL of its liabilities with just its current assets several times over. At least from the Morningstar.com perspective, the balance sheet is impressive and the revenue and earnings results are stellar.
Examining the "Key Statistics" on HMS Holdings (HMSY) from Yahoo, we can see that the company is a small cap stock with a market capitalization of only $1.81 billion. In terms of absolute p/e ratios, the company is very richly valued with a trailing p/e reported by Yahoo at 50.08. The forward p/e (fye Dec 31 2011) is still rich at 37.09. In terms of evaluating the relative p/e in light of the growth expected, the PEG ratio still comes in a bit high at 2.11 (I prefer PEG's between 1.0 and 1.5).
Yahoo reports only 27.56 million shares outstanding with 27.08 million that float. As of 11/30/10, there were 1.78 million shares out short working out to a short ratio of 10.0. This is above my own arbitrary 3 day rule for significance on short ratios and thus may be considered a bullish indicator. No dividends are paid, and the last stock split was a 3:2 split in January, 1996.
Looking at the 'point & figure' chart on HMSY from StockCharts.com, we can see that this company has a beautiful point and figure chart with incredible strength as the stock price has climbed steadily for over two years. If anything, the price is marginally extended above its support levels.
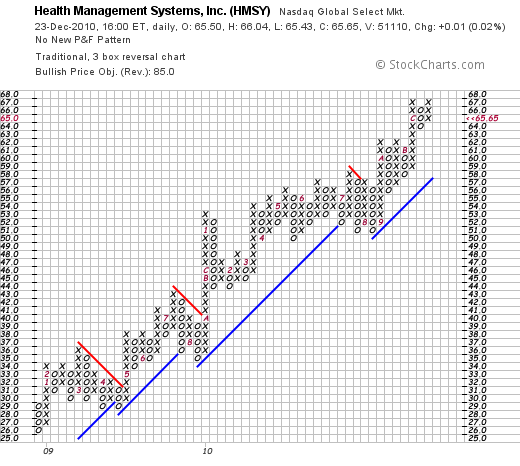
In summary, I recently purchased shares of HMS Holdings (HMSY) based on its recent technical strength, its sustained earnings and revenue growth reports and its recent announcement of earnings and revenue that beat expectations while the company raised guidance for upcoming results. Financially, the company is loaded with cash, is generating significant free cash flow, and has persistently reported incredible results for the past five years. On the downside, the stock is not an unknown in the market and to purchase shares you do need to pay a premium in terms of valuation at least as measured by the p/e and PEG ratios.
It is my belief that stock prices ultimately follow the underlying financial results of the company. Thus, I am willing to pay a premium to be a holder in quality companies capable of producing results like this. Lately, it has been hard to identify them as so many previous consistent players have faltered. HMSY has earned a place in this blog and in my portfolio as well.
Thanks again for stopping by! If you have any comments or questions, please feel free to leave them on the website or email me at bobsadviceforstocks@lycos.com.
Yours in investing,
Bob
Sunday, 19 December 2010
MWI Veterinary Supply, Inc. (MWIV)
Hello Friends! Thanks so much for stopping by and visiting my blog, Stock Picks Bob's Advice! As always, please remember that I am an amateur investor, so please remember to consult with your professional investment advisers prior to making any investment decision based on information on this website.
 As I have discussed previously, I have had the good fortune to be recruited by Covestor to participate in their activities as a 'model' portfolio. In fact a year-and-a-half ago, I set up my "Buy and Hold" model with a mix of investments. This year I set up a new model called "Healthcare" with an emphasis on health-related stocks. If you are interested in Covestor, I would certainly encourage you to visit the site and learn about 'mirroring accounts'. USA Today recently ran an article about social media and investing that you might find interesting.
I mention all of this because in my own search for new names and ideas for my healthcare model I came across MWI Veterinary Supply and purchased shares for my Healthcare Model. Thus, I am a holder of this stock but I would like to share with you some of the things I like and some of my own questions about this investment. I purchased MWIV shares on 12/16/10 at a price of $61.08. MWIV closed at $62.99 on 12/17/10, up $1.70 or 2.77% on the day.
MWIV was recently reviewed by Zacks.com with a positive comment. Motley Fool has also commented on this stock earlier this year. In light of these comments and my own examination of the stock, I decided to pick up shares last week. Let's take a closer look at this company.
According to the Yahoo "Profile" on MWI Veterinary Supply (MWIV), the company
 "...distributes animal health products to veterinarians in the United States. The company primarily offers pharmaceuticals, vaccines, parasiticides, diagnostics, capital equipment, supplies, specialty products, veterinary pet food, and nutritional products. Its pharmaceutical products include anesthetics, analgesics, antibiotics, ophthalmics, and hormones; and vaccine products comprise small animal, equine, and production animal biologicals."
On November 4, 2010, MWIV announced 4th quarter and fiscal year results for the period ended September 30, 2010. Revenues for the quarter came in at $358.9 million, up 45.0% over the prior year period. (The company which has been acquiring other entities broke out the growth as 19.2% organic and 25.8% related to the acquisition of Centaur Services).
Net income for the quarter was $8.8 million, up 34.3% over the same period the prior year. Diluted earnings per share were $.71 compared to $.53 the prior year.
In terms of guidance, the company estimated that in 2011, MWIV will have $1.41 to $1.46 billion in revenue representing a 15-19% growth, and that diluted earnings per share should come in between $3.02 - $3.10/share representing a 12-15% growth rate.
Examining Morningstar.com for longer-term results, we can see that revenues have grown from $606 million in 2006 to $1.2 billion in 2010. Similarly earnings per share have increased steadily from $1.25/share in 2006 to $2.70/share in 2010.
According to Morningstar, free cash flow has improved from a $(11) million level in 2006 to $12 million in 2007 before dipping to $7 million in 2008. Since 2008 free cash flow has improved and has been $12 million in the trailing twelve months (TTM).
Looking at the balance sheet, the company has $376 million in total current assets. Current liabilities stand at $212 million and total liabilities are reported at $221 million as of 9/10. With a current ratio of 1.77, and enough current assets to pay off ALL of the liabilities, the company appears to be in good condition at least based on the information we can glean from Morningstar.
In terms of valuatio, looking at the Yahoo "Key Statistics" on MWIV, we can see that this is a small cap stock with a market capitalization of only $788.41 million. The trailing p/e isn't too bad at 23.35 with a forward p/e (fye Sep 30, 2012) estimated at 18.15. Thus the PEG ratio, which I like to see between 1.0 and 1.5 comes in at 1.21 (5 yr expected). Yahoo reports only 12.45 million shares outstanding with 10.03 million that float. Currently there are 886,400 shares out short yielding a short ratio of 16.60 well over my own arbitrary 3 day rule for significance. (A high short ratio can be a bullish indicator if good news should drive the stock price higher forcing a short 'squeeze').
The company does not pay a dividend and has not split its stock.
Technically, in terms of the price chart, examining the 'point & figure' chart for MWIV from Stockcharts.com, we can see a picture of incredible strength as the stock price marches higher from lower left to upper right. There are few stocks with similar strength.
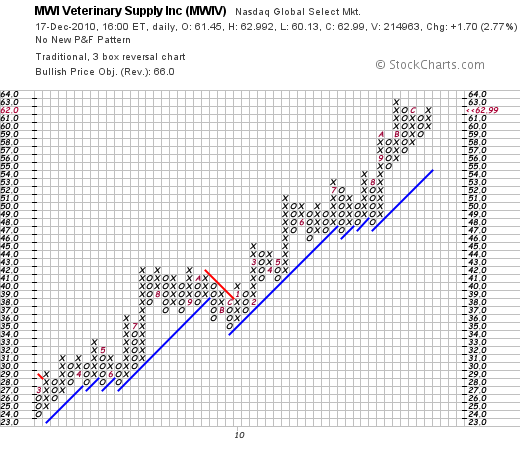
To summarize, MWI Veterinary Supply (MWIV) is a stock that I now own shares in, is involved in the distribution business to veterinarians, has been steadily growing its revenue and earnings for the past five years. In my opinion, it appears to be reasonably priced with a moderate p/e, a PEG under 1.5, and a chart that is quite amazing. It is a small company with lots of room to grow.
This is the kind of stock I like to own and like to write about here on my blog.
Thanks again for stopping by! If you have any comments or questions, please feel free to leave them right here on the blog or email me at bobsadviceforstocks@lycos.com.
Yours in investing,
Bob
Newer | Latest | Older


