Stock Picks Bob's Advice
Tuesday, 1 February 2005
"Trading Transparency" QSII
Hello Friends! I just wanted to keep you up to date on my
"Trading Portfolio". A few moments ago, I made my fourth sale of Quality Systems (QSII); I sold 30 shares of my remaining 120 shares at $68.51. I had acquired these shares at a cost basis of $31.00/share on 7/28/03 and thus had a gain of $37.51 or 121%.
As you may recall, my sale points are 1/4 of position at 30%, 60%, 90%, 120%, and then 1/4 at 180%, 240%....etc.
I sold my first 100 shares at $38.86 on 8/19/03, 50 shares at $41.67, and 30 shares at $58.61. This stock has been good to me!
And now....I am able to buy another position...so I shall be on the look-out and shall keep you posted! You know how that nickel burns a hole in my pocket!
Bob
Monday, 31 January 2005
Update "EVST"
It is ironic that I posted that terrible comment about Everlast (EVST) and now today, the stock is flying! As I write, EVST is trading at $8.30, up $1.62 on the day or 24.25%!!!
Apparently, EVST
announced3 new licensees and the stock jumped!
I do not change anything I wrote however. Individually, I cannot predict news about a stock. That is NOT what my thinking is about. I am looking for certain stocks that have consistent growth and great fundamentals. I will absolutely miss loads of stocks that turn out to be great investments.
I hope all of you bought shares of EVST anyhow, and made a bundle. It is just not a stock that fits into my strategy. Even today!
Bob
Sunday, 30 January 2005
A Reader Writes "Is EVST a 'buy'?"

A "Xanga" buddy of mine, "stories" has written and asked me about Everlast (EVST). He wrote:
EVST, a buy?
'the contender' boxing reality tv show will air in march. also, a solid name of a brand. Everlast.First of all, as stories knows, I am an amateur investor, so please consult with your professional investment advisors before taking any action based on information on this website. Furthermore, I am not psychic, so I
cannot predict the future price action of any particular stock! But what I can do is sort of run it through my own screens and see how it fits into my perspective on stock market investments! So bear with me...

First things first. EVST closed on 1/28/05 at $6.68, down $.12 on the day or a loss of (1.76)%. According to the
Yahoo "Profile", Everlast (EVST) "...designs, manufactures and sells a diverse collection of consumer products, encompassing apparel and sports products, principally under the Everlast trademark."

As I think that stories knows, my first step in evaluating a stock is to look at the latest quarter and see if revenue and earnings are positive and improving. On November 15, 2004, EVST
reported 3rd quarter results. Revenue was
down at $15.8 million, compared to $17.7 million the prior year. The company had a net
loss of $(.2) million or $(.08)/basic share, compared with a net
income of $.1 million, or $.03/basic share in the same quarter in 2003. This is not my kind of stock....but that doesn't mean the price might not appreciate in the future...but let's look further!

(sorry but the punching bag doesn't enlarge when you click on it!). How about longer-term results? For this, I turn to the
"5-Yr Restated" financials on Morningstar. Here we can see actually a steadily increasing revenue from $24.5 million in 1999 to $65.6 million in 2002. Revenue has been down slightly since then and has not been growing in the way I like to see it grow.
And earnings? Well, this has been erratic to say the least, with $.31/share in 1999 increasing to $.44, and then dropping since the to a loss of $(.36)/share in the trailing twelve months per Morningstar. Not very encouraging imho.
And free cash flow? At least EVST is not burning up its cash, but they are at ZERO for free cash flow in the trailing twelve months.
And balance sheet? This looks adequate with $.5 million in cash and $23.7 million in other current assets, as opposed to $18.1 million in current liabilities and $32.8 million in long-term liabilities. At least they don't look insolvent imho.

(again, that boxing ring doesn't enlarge lol). What about "valuation"? Here I like to use the
Yahoo "Key Statistics" on EVST. We can see that this is a tiny company with a market cap of only $20.91 million. No trailing p/e and nobody has estimates for a forward p/e. Price/sales is very cheap at .33.
Yahoo reports only 3.13 million shares outstanding with 1.70 million of them that float. Of these, as of 1/10/05, there were 15,000 shares out short representing a short ratio of only 0.044...so that doesn't look significant. No cash dividend nor any stock splits are reported on Yahoo. BTW, I do not own any shares nor do I have any options or short positions in this stock!
How about "technicals"? If we look at a
EVST Point & Figure chart from Stockcharts.com:
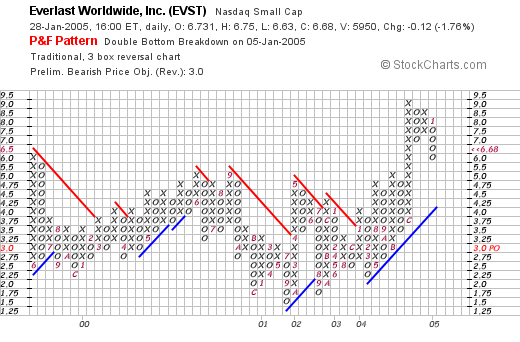
we can see that this stock has been trading in a fairly narrow range between $6.00 and $2.25 between 1999 and early 2004. Recently, it has broken through resistance and does appear to be moving higher. Overall, the chart does look nice! (at least recently.)
So what do I think? Well, it doesn't fit my strategy, plain and simple. The last quarter showed decreasing revenue and a loss, the last twelve months is a loss, the revenue hasn't increased for a couple of years. Free cash flow is zip, and the balance sheet is marginally o.k.
Valuation I guess is reasonable. And the chart does at least recently look good. So those are the good things about the stock. Will the stock price go higher? It might. And if you buy some shares you might make some money. You could make a ton of money. But as for me, I shall be looking for stocks that fit my own criteria a little tighter.
Thanks so much for posting that question! You have been a loyal reader and follower stories, so I apologize if I didn't "pull any punches" on EVST!
Have a great week!
Bob
Saturday, 29 January 2005
"Looking Back One Year" A review of stock picks from the week of December 8, 2003

Hello Friends! Thanks so much for stopping by and visiting my blog,
Stock Picks Bob's Advice. As always please remember that I am an amateur investor, so please consult with your professional investment advisors prior to making any investment decisions based on information on this website!
I have been asked "How are you doing with your strategy?". Well, first of all, I can refer people to my
current trading portfolio, but as far as how all of these "picks" are doing, I use this device, my "Weekend Review" to assess the progress or lack of progress in the stocks I have selected for this blog. As I always like to point out, this review is a little more than a year out at this point, and I try to let you know how those stocks are doing at this time. This evaluation assumes a "buy & hold" strategy, while in practice, I buy a stock and will sell quickly at an 8% loss, or sell parts of the holdings slowly as the stock price appreciates!

On December 8, 2003, I
posted Armor Holdings (AH) on Stock Picks at a price of $26.35. AH closed on 1/28/05 at a price of $42.95, for a gain of $16.60 or 63%.
And how are they doing now?.

Well, on October 29, 2004, AH
announced 3rd quarter, 2004, results. Revenue for the quarter ended September 30, 2004, came in at $256.8 million, a 186.2% increase over last year's $90.9 million. Net income was $23.9 million or $.70/share, vs. last year's $6.1 million or $.22/diluted share.

On December 9, 2003, I
posted Comtech Telecommunications (CMTL) on Stock Picks at a price of $30.89. CMTL closed at $32.48 on 1/28/05 for a gain of $1.59 or 5.1% since posting.
And how is CMTL doing?

CMTL
reported 1st quarter 2005 results on 12/7/04. For the three months ended October 31, 2003, net sales came in at $56.1 million down slightly from $56.3 million the prior year. However, net income was $7.1 million, or $.46/diluted share, an increase from the $5.7 million or $.37/diluted share the prior year. Overall, a mixed results; a slight decline in sales but a slight increase in earnings. I would rather see an increase in both!
These were the only two stocks posted that week. (I did a 're-post' of Polymedica (PLMD), but will not be including it in this discussion). So how did we do on these two stocks? In a word, great! AH was up an impressive 63%, and CMTL was up a more modest 5.1%, for an average appreciation of 34%.
Remember, that I AM an amateur, past performance is NO guarantee of future performance, and it "helps to be lucky"! If you have any questions, comments, or words of encouragement, please feel free to email me at bobsadviceforstocks@lycos.com.
Bob
Thursday, 27 January 2005
A Reader Asks "What about Fairfax Holdings (FFH)"

Hello Friends! Thanks again for stopping by. Before calling it a day, I checked my email and had a question from a reader about Fairfax Holdings (FFH). This is a financial services holding company...and my ability to assess this particular investment is limited. So I am going to refrain from making any assessment at all!
The kind of review I like to do involves utilizing companies that have easily read Morningstar.com reports. All I can see is that Fairfax has had the same revenue, $4 billion, in 2001 through the trailing twelve months. Not much growth there at all.
Earnings and p/e are nice. No information on Morningstar on free cash flow or balance sheet.
So I will excuse myself for the Amateur that I am and say I cannot tell you much of anything! It could be a terrific investment...but then again, I don't really know. I find enough stocks with numbers I can get my arms around that I don't even look at all of these others (which might be terrific investments) at all!
If you have some comments you would like to make about this one, please go ahead and comment right here under this post!
Bob
January 27, 2005 Affymetrix (AFFX)
Hello Friends! Thanks so much for stopping by and visiting my blog,
Stock Picks Bob's Advice. As I do over and over around here, I need to let you know that I am an amateur investor and you need to check with your professional investment advisors prior to making any investment decisions based on information on this website. If you have any questions or comments, please feel free to email me at bobsadviceforstocks@lycos.com.

As I posted earlier, I sold a portion of my Cooper (COO) stock at a nice gain, so it "entitled" me to purchase a new position. My strategy of portfolio management is simple. I plan on having up to 25 positions. When I sell a stock on bad news...either it hit a sale point on the downside, or something fundamental is announced that isn't very promising, I try very hard to "sit on my hands" and not replace that issue. On the other hand, if I sell a portion of a holding on a gain, I use that as an "internal market signal" from my portfolio, that is a signal that it is ok to add a position to my holdings (as long as I am under 25). On the downside, I plan to go down to just 6 positions which would be my minimum portfolio. Fortunately, I haven't tested that portion of my strategy yet!

Once I knew I was back in the market for a stock purchase, I turned to the
list of top % gainers on the NASDAQ. Affymetrix (AFFX) was on the list. Currently, as I write, it is trading at $40.62, up $4.29 or 11.81% on the day.
According to the
Yahoo "Profile" on Affymetrix, the company "...is engaged in the development, manufacture, sale and service of systems for genetic analysis for use in the life sciences."
What drove the stock higher today was the
4th quarter earnings results reported yesterday, 1/26/05, after the close of trading. Sales rose 21% to $107.7 million for the quarter up from $89.2 million the prior year. Quarterly income came in at $27.1 million or $.41/share, up from $16 million or $.26/share last year. However, 1st quarter guidance was for $.20/share on $90 million of revenue with full-year 2005 results of $1.12/share on $405 million in revenue. (The 2004 full year results just reported was $.74/share on $300.8 million). The street liked the whole announcement, and the stock moved higher!
How about longer-term? Looking at a
"5-Yr Restated" financials on Morningstar, we can see the steady revenue growth from $109 million in 1999 to $327 million in the trailing twelve months.
Earnings, which were 'negative' in 1999 at $(.54)/share, turned positive at $.24/share in 2003 and $.60 in the trailing twelve months.

Free cash flow, which was a negative $(60) million in 2001, turned positive in 2002, and was a postive $28 million in the trailing twelve months (TTM).
The balance sheet also looks solid with $181.7 million in cash and $93.3 million in other current assets, plenty to cover both the $84.9 million in current liabilities and the $157.4 million in long-term liabilities.
How about "valuation"? Taking a look at
Yahoo "Key Statistics" on AFFX, we can see that the market cap is a "large cap" level at $2.48 billion. The trailing p/e is rich at 55.43, the forward p/e is a bit better (fye 31-Dec-05) at 33.12. The PEG (5 yr expected) is moderate at 1.65, and the Price/Sales is also rich at 6.76. This stock is NOT selling at any bargain levels!
Yahoo reports 60.96 million shares outstanding with 60.70 million that float. Of these 11.58 million are out short (12/8/04)(!), representing 19.08% of the float or a short raio (12/8/04) of 15.953 days. We might be seeing a bit of a "squeeze" today with the announcement of fairly good results.
Yahoo reports no cash dividends for AFFX, and the last stock split was a 2:1 in August, 2000.
How about "technicals"? If we look at a
"Point & Figure" chart from Stockcharts.com:
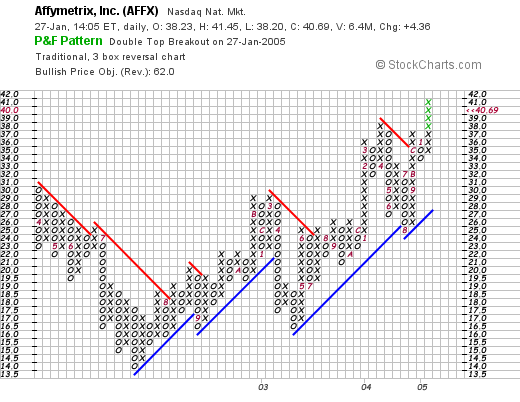
we can see that this stock was actually trading LOWER between April, 2002 and late July, 2002, when it dropped from $30.00/share to a low of $14.00/share. Since then, the stock has been forging ahead nicely to its current level of $40.69. The chart doesn't really look too "over-valued" imho.
So what do I think? Well the stock did make a nice move today, the earnings report, although apparently a little under 'street' expectations was solid, the guidance for the coming year was good as well. The short-selllers might just be scrambling to cover their shares....revenue has been growing nicely the last 5 years, the stock turned profitable and is growing its earnings, the free cash flow which WAS negative a couple of years ago has turned positive and the balance sheet looks solid. Valuation-wise, the stock does sell at a rich p/e and Price/sales although the 5-yr PEG isn't too bad being under 2.0.
Well, as you know, I liked it enough to buy some shares today! I hope it works out.
As always, if you have any questions, comments, or words of encouragement, please feel free to email me at bobsadviceforstocks@lycos.com.
Bob
"Trading Transparency" AFFX
Hello Friends! Well you know how that nickel ALWAYS burns a hole in my pocket? Well, sure enough, looking through the lists of stocks today, I came across Affymetrix, a genetics analysis corporation, that was performing well and appears to fit my "criteria" fairly well.
I went ahead and purchased 160 shares at $40.927 for my trading account. I will try to get back to all of you with a review ASAP. Just wanted to give all of you a heads-up of what I was doing! Hope it does better than my ASKJ which lasted a grand total of 7 days before hitting my 8% loss limit!
Regards!
Bob
"Trading Transparency" COO
Hello Friends! Thanks so much for stopping by and visiting my blog,
Stock Picks Bob's Advice. As always, please remember that I am an amateur investor, so please consult with your professional investment advisors prior to making any investment decisions based on information on this website.
As is my strategy, I reached a sell point on Cooper (COO) in my
"Current Trading Portfolio". Only owning 60 shares of COO, I sold 15 shares a few moments ago at $76.88/share. I purchased these shares at a cost basis of $26.98/share on 2/20/03, and thus had a gain of $49.90/share or 185% on these shares.
This is my fifth sale of COO shares, and I was aiming for the 180% gain level. I sold 50 shares on 6/2/03 at $35.46, 50 shares on 9/4/03 at $41.90, 25 shares on 12/31/03 at $46.92, and 15 shares on 7/7/04 at $60.13.
My next targeted "gain" will be 60% higher (from cost) at a 240% gain....but am down to only 45 shares.
Since I have now sold a portion of a position at a gain....you know what THAT means :)....I am now able to add a new position back into the portfolio. I shall be on the lookout!
Thanks so much for stopping by! If you have any questions or comments, please feel free to email me at bobsadviceforstocks@lycos.com or leave your message right here.
Bob
Wednesday, 26 January 2005
A Reader Writes "Have you taken a look at CAT?"

Hello Friends! Thanks so much for stopping by and visiting my blog,
Stock Picks Bob's Advice. As always, please remember that I am an amateur investor, so always consult with your professional investment advisors prior to making any investment decisions based on information on this website!
One of my "Xanga" friends, 'rise' wrote a comment/question the other day and I would like to use this opportunity to answer his comments.
Rise wrote: "
Bob, have you taken a look at CAT? They've had a great year and 2005 looks to be a good year for them too. Looks like a strong stock to me."

Well, first of all, I cannot predict the future! (Well that is sort of obvious) so I cannot tell you whether CAT will go up or down in price or be a good investment for you! That is up to your professional investment advisors. But let me see if it fits into the type of stock I like to review here on Stock Picks Bob's Advice.

First of all, Caterpillar, Inc. (CAT) closed at $91.12 today, up $.62 or 0.69% on the day. According to the
Yahoo "Profile", CAT "...operates in three principal lines of business. The Machinery segment designs, manufactures and markets construction, mining, agricultural and forestry machinery. The Engines segment designs, manufactures and markets engines for Caterpillar machinery and electric power generation systems; on-highway vehicles and locomotives; marine, petroleum, construction, industrial, agricultural and other applications, and related parts. The Financial Products segment consists primarily of Caterpilllar Financial Services Corporation, which provides financing alternatives for Caterpillar machinery; and engines...."
How about the latest quarter? Well, they ARE going to be reporting TOMORROW, so I will go to the latest one before that, which was the
3rd quarter 2004 results which was posted in October, 2004.
For the quarter ended September 30, 2004, sales and revenues were $7.65 billion, up 38% from the $5.55 billion the prior year. "Profit" came in at $498 million or $1.41 per share, up 124% from the $222 million or $.62/share the prior year. This was a GREAT result!
How about "longer-term"? Looking at a Morningstar.com
"5-Yr Restated" financials, we can see that revenue growth was fairly stagnant between 1999 and 2002, rising from $19.7 billion to $20.2 billion during that period. However, revenue growth did grow quickly since then with $28.1 billion reported in the trailing twelve months (TTM).
How about earnings? These also have been flat with $2.63 reported in 1999, increasing to $3.13 by 2003, and then growing quickly to $5.17/share in the trailing twelve months.
In addition, the company has been increasing its dividend every single year (!) from $1.25/share in 1999 to $1.52/share in the trailing twelve months.
Free cash flow, while erratic, has been positive, increasing from $19 million in 2001 to $593 million in 2002, but then decreasing slowly over the next two years to $216 million in the TTM.
The balance sheet is solid with $19.6 billion of cash and other current assets, balanced against $18.8 billion in current liabilities and $19.5 billion in long-term liabilities.

How about "valuation"? If we look at
"Key Statistics" on CAT from Yahoo.com, we can see that this is a very LARGE cap stock with a market cap of $31.09 billion. The trailing p/e is reasonable at 17.05, and the forward p/e is also even nicer (fye 31-Dec-05) at 12.59. Thus, there is a PEG of 1.39 and a Price/Sales ratio of only 1.10. These parameters appear reasonable to me!
Yahoo reports 341.2 million shares outstanding with 341.2 milion of them that float. Of these 5.12 million shares are out short representing 1.50% of the float or 2.336 trading days of volume.
CAT does pay a dividend with a yield of 1.81%. The last stock split was a 2:1 split in July, 1997.
How about "technicals"? If we look at a
Caterpillar "Point & Figure" Chart from Stockcharts.com:
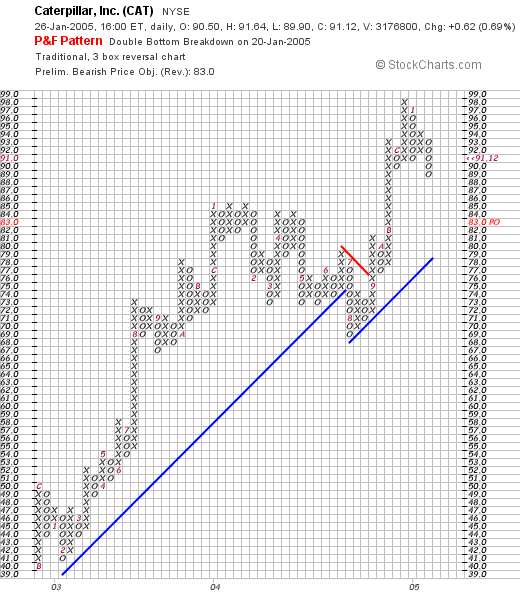
We can see a very strong graph from late in 2002 when the stock was trading around $41/share, to now, with one small exception, the appreciation in stock price was steady and uninterrupted. The chart looks nice to me!
So what do I think? Well 'rise', I agree with you for the most part. The latest quarter was GREAT, the Morningstar.com, however, does not show that steady growth but rather more of a cyclical growth the last month! Valuation is reasonable, the stock pays an increasing dividend, free cash and balance sheet are solid.
This particular stock does look nice to me. However, I would rather see a bit more consistent growth, and I prefer a little smaller stock to invest in....maybe that is just me, but it always seems like a fast-growing small cap stock will appreciate for a much longer period of time, than will this cyclical, large cap stock CAT.
Thanks again for stopping by. If you have any questions or commeents, please feel free to email me at bobsadviceforstocks@lycos.com .
Bob
January 26, 2005 SS&C Technologies (SSNC)
Hello Friends! Thanks so much for stopping by and visiting my blog,
Stock Picks Bob's Advice. As always, please remember that I am an amateur investor, so please consult with your professional investment advisors prior to making any decisions based on information on this website.

I took a look at the
list of top % gainers on the NASDAQ today and came across SS&C Technologies (SSNC). I do not own any shares of this stock nor any option positions. SSNC had a nice day today, closing at $21.65, up $1.98 or 10.07% on the day.
According to the
Yahoo "Profile", SSNC "...provides software, business process outsourcing services and application service provider solutions to the financial services industry primarily in the United States."
Taking a look at the latest quarter financial results, SSNC
reported 4th quarter 2004 results yesterday, January 25, 2005, after the close, and thus, today's price rise! Revenues for the quarter ended December 31, 2004, came in at $27.1 million, up 51% over the $17.9 million the fourth quarter in 2003. Net income was $6.0 million, or $.25/diluted share, up 62% over the same quarter the prior year. These were really strong results!
At the same time, the company announced guidance for the next quarter for revenue of between $26 and $27.5 million, and earnings per share of $.21 to $.24. For the 2005 year, they estimated revenue of between $110 and $116 million. With the current quarter just completed, revenue for 2004 was $95.9 million. Clearly the "street" liked the announcement, and the stock moved higher in response.

How about longer-term results? Taking a look at the
"5-Yr Restated" financials on Morningstar.com, we can actually see that revenue actually dipped from $65.7 million to a low of $56.4 million between 1999 and 2001. Since then, revenue has steadily climbed, with $95.9 million just reported for 2004.
Earnings have actually improved each and every year from 1999 when $(.54)/share loss was reported to the $.84 just reported for 2004. In addition, we can see from Morningstar, that SSNC initiated dividednds in 2003 and dividends ammounted to $.14/share in the trailing twelve months.
Looking at free cash flow, this is also encouraging, with not only positive free cash flow but
increasing free cash flow from $6 million in 2001, increasing steadily to $26 million in the trailing twelve months.
How about the balance sheet as reported on Morningstar? This actually looks very nice with $121.3 million in cash, enough to pay off the $27.0 million in current liabilities more than four times over without even touching the $16.3 million in other current assets. NO long-term liabilities are reported on Morningstar.com.
How about valuation questions? For that I like to turn to
"Key Statistics" on Yahoo on SSNC. Here we can see that this is a mid-cap stock with a market capitalization of $499.51 million. The trailing p/e is reasonable (imho) at 25.59, and the forward p/e (fye 31-Dec-05) is only 23.28. No PEG is reported and the Price/sales is a bit rich at 5.23.
Yahoo reports 23.07 million shares outstanding with only 14.60 million of these that float. Of the floating shares, 290,000 are out short as of 12/8/04 representing 1.99% of the float or 2.417 trading days of volume. This is down from 350,000 shares out short the prior month.
As noted, the annual dividend is $.16/share yielding 0.81%. In addition, the stock split 3:2 on March 8, 2004.
How about "technicals"? If we look at a
Stockcharts.com Point & Figure Chart on SSNC, we can see a steady increase in price from $3.50 in late 2002, to a peak of $34.00/share in late February 2004. The stock subsequently sold off breaking through a support line to the $15.00 level. It currently is moving higher, after breaking through a resistance level of around $21/share. The stock chart actually looks nice to me, without being overvalued.
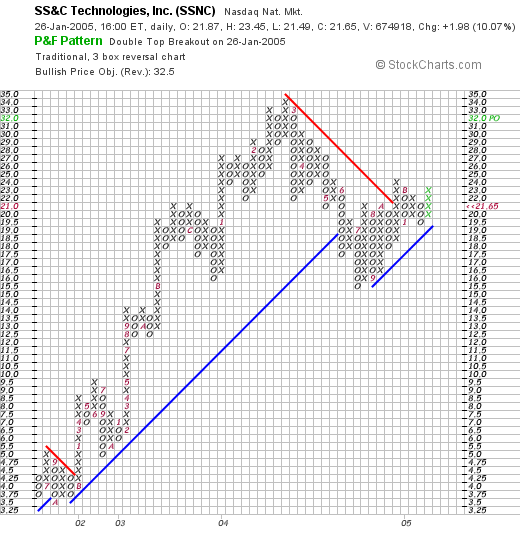
So what do I think? Well, I think the move today was impressive, the latest quarterly result was superb, the revenue growth has been a bit inconsistent some years back but has been steady for the last 3-4 years, earnings have been growing nicely and steadily, the company has just initiated a dividend, free cash flow is positive and growing, the balance sheet is spotless, valuation isn't bad, the graph is pretty good...well there isn't much I don't like about this stock quite frankly!
But then again, I am waiting to sell a portion of one of my holdings at a gain before I have "permission" to add a new position. So I shall not be buying any SSNC right away.
Thanks again for stopping by! If you have any questions, comments, or words of encouragement, please feel free to email me at bobsadviceforstocks@lycos.com.
Bob
Newer | Latest | Older


 A "Xanga" buddy of mine, "stories" has written and asked me about Everlast (EVST). He wrote:
 First things first. EVST closed on 1/28/05 at $6.68, down $.12 on the day or a loss of (1.76)%. According to the
  As I think that stories knows, my first step in evaluating a stock is to look at the latest quarter and see if revenue and earnings are positive and improving. On November 15, 2004, EVST
  (sorry but the punching bag doesn't enlarge when you click on it!). How about longer-term results? For this, I turn to the
  (again, that boxing ring doesn't enlarge lol). What about "valuation"? Here I like to use the

 On December 8, 2003, I
  Well, on October 29, 2004, AH
  On December 9, 2003, I
  CMTL
CMTL  As I posted earlier, I sold a portion of my Cooper (COO) stock at a nice gain, so it "entitled" me to purchase a new position. My strategy of portfolio management is simple. I plan on having up to 25 positions. When I sell a stock on bad news...either it hit a sale point on the downside, or something fundamental is announced that isn't very promising, I try very hard to "sit on my hands" and not replace that issue. On the other hand, if I sell a portion of a holding on a gain, I use that as an "internal market signal" from my portfolio, that is a signal that it is ok to add a position to my holdings (as long as I am under 25). On the downside, I plan to go down to just 6 positions which would be my minimum portfolio. Fortunately, I haven't tested that portion of my strategy yet!
 Once I knew I was back in the market for a stock purchase, I turned to the
  Free cash flow, which was a negative $(60) million in 2001, turned positive in 2002, and was a postive $28 million in the trailing twelve months (TTM).
 Well, first of all, I cannot predict the future! (Well that is sort of obvious) so I cannot tell you whether CAT will go up or down in price or be a good investment for you! That is up to your professional investment advisors. But let me see if it fits into the type of stock I like to review here on Stock Picks Bob's Advice.
 First of all, Caterpillar, Inc. (CAT) closed at $91.12 today, up $.62 or 0.69% on the day. According to the
  How about "longer-term"? Looking at a Morningstar.com
  How about "valuation"? If we look at
 I took a look at the
  According to the
  How about longer-term results? Taking a look at the