Stock Picks Bob's Advice
Wednesday, 31 January 2007
Wolverine World Wide (WWW) "Trading Transparency"
Hello Friends! Thanks so much for stopping by and visiting my blog, Stock Picks Bob's Advice! As always, please remember that I am an amateur investor, so please remember to consult with your professional investment advisors prior to making any investment decisions based on information on this website!
The market really closed on a tear today! I had a couple of stocks close to a sale and Wolverine World Wide decided to cross that 30% threshhold a few moments ago. I sold 40 shares of WWW at $30.84/share shortly before the close of the trading day. I had purchased 240 shares at a cost basis of $23.55/share on 4/19/06, just under a year ago, and with today's price move, the stock passed a 30% appreciation target, and I unloaded 1/6th of my holding, or 40 shares. This sale at $30.84 represents a gain of $7.29/share or 31%. On the upside, I plan on selling another 1/6th of my holdings if the stock should appreciate to a 60% appreciation target, otherwise, after a single sale, I shall move my 'mental stop' up to break-even or $23.55...at which time I would be unloading all of my remaining shares.
This gave me a "permission slip". I had earlier noted that another favorite of mine, Hologic (HOLX) was on the top % gainers....and I bought some...I shall write this purchase up as a separate blog entry!
Thanks so much for stopping by and visiting! If you have any comments or questions, please feel free to leave them on the blog or email me at bobsadviceforstocks@lycos.com.
Bob
Harris Corp (HRS) "Trading Transparency"
Hello Friends! Thanks so much for stopping by and visiting my blog, Stock Picks Bob's Advice! As always, please remember that I am an amateur investor, so please remember to consult with your professional investment advisors prior to making any investment decisions based on information on this website.
You probably knew that 'nickel' wouldn't stay long in my pocket! Having a 'permission slip' to buy a new position, after selling a portion of my Kyphon stock, I went quickly over to the top % gainers list. I came across an old favorite of mine, a stock that is in my 'vocabulary' of stocks, Harris Corp, which as I write is trading at $49.78, up $2.03 or 4.25% on the day. A few moments ago I purchased 120 shares of HRS at a price of $49.96 for my 'Trading Account'.
Well, there goes that nickel! Anyhow, I am now up to 13 positions and shall be monitoring all of my stocks to see if we need to do anything else. Thanks again for stopping by and feel free to leave any comments you might have on the blog or you can email me at bobsadviceforstocks@lycos.com.
Bob
Kyphon (KYPH) "Trading Transparency"
Hello Friends! Thanks so much for stopping by and visiting my blog, Stock Picks Bob's Advice! As alway, please remember that I am an amateur investor, so please remember to consult with your professional investment advisors prior to making any investment decisions based on information on this website.
My Kyphon stock made a nice move higher today. As I write, it is trading at $47.80, up $2.75 or 6.10% on the day. A few moments ago, I made my second sale of Kyphon (on this particular purchase), selling 1/6th of my 150 shares or 25 shares at a price of $47.83. My Kyphon shares were purchased (this round...I had one other purchase and sale of Kyphon), on 5/20/05, with a cost basis of $29.21. Thus, I had a gain of $18.62 or 63.7% on my shares, triggering my second partial sale of 1/6th of my holdings.
I had earlier (7/8/05) sold 50 shares (which at that time was a 1/4 sale of my position), at a price of $37.98, which worked out to a gain of $8.77 or 30%.
If you are new to my blog, basically I sell my positions quickly if they hit a targeted loss (for instance an 8% loss after an initial purchase) and sell my appreciating stocks slowly and partially as they appreciate. My current targets are at 30, 60, 90, 120, 180, 240, 300, 360, 450, 540%....etc. appreciation levels.
If I am under my full portfolio (for me 25 positions), then this entitles me to add a new position, as long as the new stock meets the same criteria I use on this blog....on the top % gainers list, etc. Since I am at 12 positions, I now have a "permission slip" to go and buy a new stock.
That nickel is burning a hole in my pocket already!
Thanks so much for visiting! If you have any comments or questions, please feel free to leave them on the blog or email me at bobsadviceforstocks@lycos.com. Please give me a first name and a location which makes it all more interesting for all of us.
Bob
Sunday, 28 January 2007
Trading Portfolio Update
Hello Friends! Thanks so much for stopping by and visiting my blog, Stock Picks Bob's Advice! As always, please remember that I am an amateur investor, so please remember to consult with your professional investment advisors prior to making any investment decisions based on information on this website.
Today seemed like a good day to catch up with some 'housekeeping' around here! One thing I haven't done for a few months is to review my holdings in an entry. I have been writing over on MSN in the Jubak's Refugees area occasionally. I discussed my strategy and have started reporting on my progress, or lack thereof, on a regular basis. This is what I wrote this evening:
"Hello Jubak Refugees,
Another 3 months have passed since I updated my trading portfolio with all of you. I continue to use my same strategy and continue to write at Stock Picks Bob's Advice.
This analysis is as of the close of trading January 26, 2007.
I am currently at 12 positions. My maximum is 25 and my minimum is 6.
The account net worth stands at $39,618.32. I am currently at 53.59% margin equity, with a margin debit of $34,299.28. The market value of securities being held stands at $73,917.60.
Current Positions (# shares, date of purchase, closing stock price, cost basis, % gain (loss))
Bolt Technology (BTJ) (300 shares, 1/12/07, $20.42, $17.44, 17.11%)
Coach (COH) (71 shares, 2/25/03, $43.84, $8.33, 426.21%)
Cytyc (CYTC) (225 shares, 1/29/04, $28.14, $14.86, 89.42%)
Kyphon (KYPH) (150 shares, 5/20/05, $44.36, $29.21, 51.84%)
Morningstar (MORN) (167 shares, 11/22/05, $46.02, $32.57, 41.28%)
Precision Castparts (PCP) (120 shares, 10/24/06, $85.97, $69.05, 24.50%)
Quality Systems (QSII) (88 shares, 7/28/03, $41.87, $7.75, 440.34%)
ResMed (RMD) (150 shares, 2/4/05, $51.73, $29.87, 73.19%)
Starbucks (SBUX) (50 shares, 1/24/03, $33.88, $11.40, 197.07%)
Meridian Bioscience (VIVO) (210 shares, 4/21/05, $29.45, $11.13, 164.64%)
Ventana Medical Systems (VMSI) (188 shares, 4/16/04, $41.07, $23.47, 74.99%)
Wolverine World Wide (WWW) (240 shares, 4/19/06, $27.70, $23.55, 17.64%)
Since my last post on October 8, 2006, the following trades have occurred: I sold 17 shares of Coach (COH) at $38.73 on 10/24/06 and bought 120 shares of Precision Castparts (PCP) at $68.96 on 10/24/06. I withdrew $11,000 out of my margin balance to pay for a roof on 11/10/06. On 1/12/07, my Coach (COH) stock hit another targeted sale point and I sold 14 shares at $45.82. I then bought 300 shares of Bolt Technology (BTJ) at $17.40. I am now depositing $300/month into the account and writing checks for $575 for a car payment.
I finished up 2006 with net realized gains of $5,460.82. I had a net short-term loss of $(5,237.30) and net long-term gains of $10,698.12.
As of 1/26/07, I have $513.87 of net realized gains consisting entirely of long-term gains in 2007. I have paid $202.69 in interest in 2007 as well.
Also, as of 1/26/07, the account has a net unrealized gain of $28,511.49.
I hope this is all helpful as I have been posting this progress report here actually for a couple of years now! If you are interested, I post regularly on my blog, Stock Picks Bob's Advice at
Thanks again!
Wishing all of you well.
Bob"
I hope that this update is helpful for all of you readers here as well! I have been far more disciplined the last few years and actually have slowed down my trading as I concentrate on only trading when I have the indicator from my own portfolio to do so!
If you have any comments or questions, please feel free to leave them on the blog or email me at bobsadviceforstocks@lycos.com. I also have a podcast website which you might wish to visit.
Have a great week trading!
Bob
HealthExtras (HLEX) "Long-Term Review #3"

Hello Friends! Thanks so much for stopping by and visiting my blog, Stock Picks Bob's Advice! As always please remember that I am an amateur investor, so please remember to consult with your professional investment advisors prior to making any investment decisions based on information on this website.
A couple of months ago I started a new entry called "long-term review". These are an examination of my earlies stock picks. This blog started back on May 12, 2003, and since then I have posted over 1,300 entries. To get a better feeling about how these stock picks are doing, I am trying to review these picks in order and see how they are doing today. Some of these stocks have been acquired or are otherwise no longer publicly traded. I shall be restricting myself to those stocks which still trade for the purposes of this review. also for these reviews, I plan on restricting myself to the latest quarterly report, the Morningstar.com evaluation, and a point and figure chart.
 On May 14, 2003, I posted HealthExtras (HLEX) on Stock Picks Bob's Advice. This is what I wrote:
"Wednesday, 14 May 2003
May 14, 2003 HealthExtras
It is 10 minutes before the close of trading and scanning the list again a new name has popped up for consideration. I do not own this stock and am not currently planning to purchase it....but may in the future! HealthExtras...at $5.70 up $.77 or 15.62%. Wow....a blazing pop in this small (!) company. Looking at the news....through Yahoo....we find that earnings were just reported...revenue of 91.7 million, a 68% increase over the prior year and net income of $1.9 million....a 221% increase from the prior year (!). Company is in pharmacy benefit management...as everyone knows a very HOT area...just listen to the politicians talking about benefits for seniors, etc. Checking out Morningstar, we find sequential growth in revenue....from 5.3 million in 1999, 44.2 million in 2000, 124.4 million in 2001, and 226 million for the trailing 12 months. What is there NOT to like? Probably SHOULD buy this myself....but for now....my portfolio is FULL..and will buy only when one of my stocks hits the 40-50% gain I am planning on....then can add a new position. Good luck. Bob
P.S. the symbol for this one is HLEX....tell me what you think."
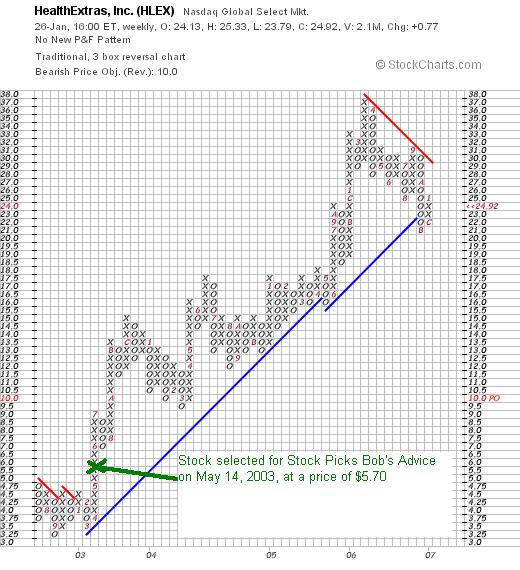
HLEX closed at $24.92 on January 26, 2007, for a gain on that pick of $19.22 or 337.2% since posting. I do not own any shares or options on this stock.
How did they do in the latest quarter?
On November 6, 2006, HealthExtras reported 2006 3rd quarter results. Revenues for the third quarter 2006 totaled $363.1 million, a 118% incrrease over 3rd quarter 2005 results of $166.8 million. Net income worked out to $8.8 million, or $.21/share, up 40% from comparable 3rd quarter 2005 earnings of $6.3 million or $.15/share. The company failed to meet expectations of $.23/share on revenue of $363.9 million.
How about longer-term results?
Looking at the Morningstar.com "5-Yr Restated" financials on HLEX, we can see that revenue has steadily increased from $118 million in 2001 to $695 million in 2005 and $860 million in the trailing twelve months (TTM).
Earnings, which were at a loss of $(.23)/share in 2001, turned profitable at $.42/share in 2002, dipped to $.30/share in 2003, but have improved steadily since with $.45/share in 2004, $.56/share in 2005 and $.56/share in the TTM.
The company has been issuing shares with 29 million shares in 2001, 39 million in 2005 and 41 million in the TTM. While increasing shares by about 50%, they have actually increased revenue by more than 400% during that time period.
Free cash flow is positive with $23 million in 2003 and $27 million in 2005 with $19 million in the TTM.
The balance sheet looks good to me with $69.9 million in cash and $125.8 million in other current assets. This combined $195.7 million in current assets is more than adequate to cover both the $115.3 million in current liabilities and the $15.2 million in long-term debt combined.
What does the chart look like?
Looking at the "Point & Figure" chart on HLEX, we can see the steady increase in price from $3.75 in 2002 to a high of $37 in March, 2006. The stock has pulled back since but appears to have additional strength.
Summary: What do I think about this stock?
Let's summarize a few things. Basically they had a terrific recent quarter, although expectations were so high that they failed to mee the even higher expectations. This early pick has been a great one for me with the stock moving steadily higher the past several years.
If you have any comments or questions, please feel free to leave them on the blog or email me at bobsadviceforstocks@lycos.com.
Bob
Morningstar (MORN) "Weekend Trading Portfolio Analysis"

Hello Friends! Thanks so much for stopping by and visiting my blog, Stock Picks Bob's Advice! As always, please remember that I am an amateur investor, so please remember to consult with your professional investment advisors prior to making any investment decisions based on information on this website.
I try to do several things on this blog. And unfortunately, as an amateur the organization here could be improved :). But one of the important things I like to do is to share with you my actual trading portfolio, the buys, the sales, the successes and the failures. It is through this that I maintain the discipline to continue with my grand investing experiment. It is knowledge that I am responsible to all of you that has motivated me to continue to exercise discipline in my trades.
Besides reporting on my trades, I like to examine a position in my portfolio every 2 to 3 weeks. On January 6, 2007, I discussed my Kyphon Holding on Stock Picks. Going alphabetically through the stocks I own in this portfolio brings me to Morningstar (MORN).
 I purchased 200 shares of Morningstar stock (MORN) on 11/22/05 at a price of $32.57/share. I posted a review of Morningstar that same day on the blog.
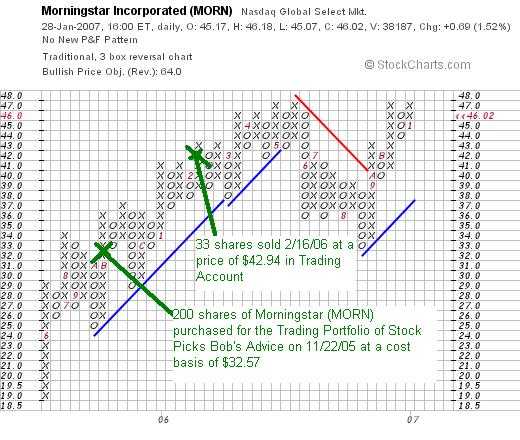
On February 16, 2006, I sold 1/6th of my position or 33 shares when the stock was trading at $42.94/share for a gain of $10.37 or 31.8% since my purchase. Morningstar closed at $46.02 on January 26, 2007, for a gain of $13.45 or 41.3% on my remaining 167 shares of MORN.
As per my plans, I will be selling all of my remaining shares if the stock declines to the purchase price or $32.57/share. On the upside, I plan on selling 1/6th of my remaining shares or 27 shares if the stock should appreciate to a 60% gain or 1.60 x $32.57 = $52.11/share.
Let's take another look at this stock and see if it still fits into the criteria I use on this blog.
What exactly does this company do?
According to the Yahoo "Profile" on Morningstar, the company
 "...provides independent investment research to investors worldwide. It offers Internet, software, and print-based products for individual investors, financial advisors, and institutional clients, as well as asset management services to advisors and institutions. It operates in three segments: Individual, Advisor, and Institutional."
How did they do in the latest quarter?
On November 2, 2006, Morningstar reported 3rd quarter 2006 results. Revenue for the quarter ended September 30, 2006, came in at $81.8 million, a 44% increase from the $56.9 million reported in the third quarter of 2005. Net income was also up strongly at $13.5 million, or $.29/diluted share, up from $7.5 million or $.17/diluted share in the prior year same period. The company beat expectations of $.28/share.
What do their longer-term financial results look like?
Reviewing the Morningstar.com "5-Yr Restated" financials (!) on Morningstar, we can see that revenue has steadily increased from $91 million in 2001 to $227 million in 2005 and $289 million in the trailing twelve months (TTM)
Earnings, which were showing losses from 2001 to 2003, turned positive in 2004 at $.21/share, increased to $.70/share in 2005 and $1.04 in the TTM.
No dividend is paid and the number of shares has been fairly steady with 39 million in 2001 and 39 million in 2005, with a slight increase to 42 million in the TTM.
Free cash flow has been positive and growing with $21 million in 2003 increasing to $41 million in 2005 and $81 million in the TTM.
The balance sheet looks solid with cash of $124.3 million and $64.7 million of other current assets, a total of $189 million in current assets is enough to pay off both the $148.3 million in current liabilities and the $8.6 million in long-term liabilities combined. The current ratio works out to a healthy 1.27.
What about some valuation numbers?
Checking the Yahoo "Key Statistics" on Morningstar, we can see that this is a mid cap stock with a market capitalization of $1.92 billion. The trailing p/e is rich at 44.29, with a forward p/e (fye 31-Dec-07) estimated at 31.09. No PEG ratio is reported.
Reviewing the Fidelity.com eresearch site for some valuation numbers, we can see that the Price/Sales (TTM) ratio is a bit rich at 6.53 relative to the industry average of 2.81. Profitability, however, is higher than the average with a Return on Equity (TTM) of 23.14%, compared to the industry average of 12.06%.
Finishing up with Yahoo, we find that there are 41.77 million shares outstanding with 10.26 million shares that float. As of 1/9/07 there were 834,920 shares out short representing 7.3% of the float or 12.1 trading days of volume. Using my '3 day rule' on short interest, this 12 days of short interest has the potential of a short 'squeeze' if Morningstar can report another quarter of earnings results ahead of estimates. That announcement should be out relatively soon, and it will be interesting to observe the results.
Finally, as noted, no stock dividends and no stock splits are reported on Yahoo.
What does the chart look like?
Reviewing the "Point and Figure" chart from StockCharts.com on Morningstar, we can see that the stock moved strongly higher from the $19 level in May, 2005 to a high of $4 in May, 2006. However, the stock corrected after that, pulling to a low of $33 in August, 2006. Since then the stock has broken through resistance and is trading once again just under its high at $46.02.
Summary: What do I think about Morningstar?
As you know, this is a holding in my Trading Portfolio. Even so, I like this stock. I use the Morningstar.com website regularly for these analyses. Besides that, the latest quarterly report was very strong, the Morningstar.com 5-yr page is solid, valuation is a bit rich, and the chart looks just fine to me! I shall sit tight with my holdings; waiting for either an additional sale at a gain or a retracement and sale.
Thanks again for stopping by! I hope these discussions of different stocks is helpful to you! I would love to hear more from readers of this blog. You can leave comments under each entry or drop me a line at bobsadviceforstocks@lycos.com. If you get a chance, drop by and visit my Stock Picks Podcast site! Have a wonderful week!
Bob
Saturday, 27 January 2007
"Looking Back One Year" A review of stock picks from the week of September 19, 2005

Hello Friends! Thanks so much for stopping by and visiting my blog, Stock Picks Bob's Advice! As always, please remember that I am an amateur investor, so please remember to consult with your professional investment advisors prior to making any investment decisions based on information on this website.
Once again I ask myself where the week went and here it is Saturday afternoon and I need to get around to reviewing some past stock picks! Each weekend, I try to review stocks from consecutive weeks on the blog. These reviews assume a "buy and hold" strategy and estimate what might have happened if I had bought equal $ amounts of each of the stocks discussed that week.
In reality, I advocate and employ a disciplined management strategy which involves selling losing stocks quickly and completely at small 8% losses, and selling my gaining stocks slowly and partially at targeted appreciation levels. This difference in strategy would certainly affect investment returns.
I have started including "point & figure" charts on each of the stocks reviewed with the point of the "pick" identified for review. My "thumbs-up" or "thumbs-down" is a simple assessment on each earnings report. I simply require increased revenue and earnings for each pick to get that "thumbs-up". It does not mean that I believe that the stock is still a good investment; this just indicates my basic reaction to the earnings news.
Let's take a look at those three stocks which were reviewed during that week in September, 2005. Much of my attention at that time was directed to New Orleans and Katrina where I had many of my wife's family affected. It is hard to believe that so much time has now passed and so little has been done to assist that once great American city. But that is another story for another blog.
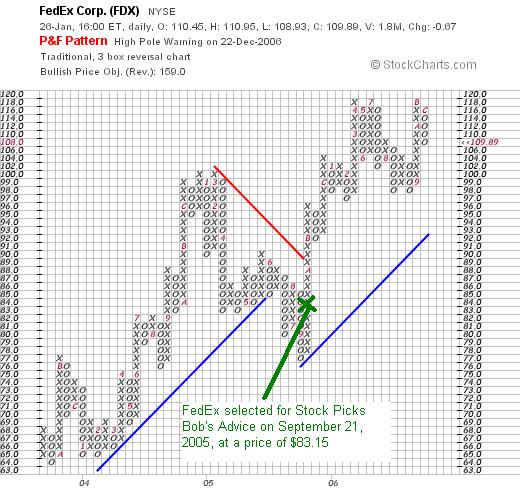
 On September 21, 2005, I posted FedEx (FDX) on Stock Picks Bob's Advice when it was trading at $83.15. FedEx closed at $109.89 on January 26, 2007, for a gain of $26.74 or 32.2% since posting.
 On December 20, 2006, FedEx reported 2nd quarter 2007 results. Revenue for the quarter came in at $8.93 billion, up 10% from $8.09 billion in the same quarter last year. Net income came in at $511 million, up 8% from the $471 million last year. Earnings came in at $1.64/share (including one time expenses), up from $1.53/diluted share last year.
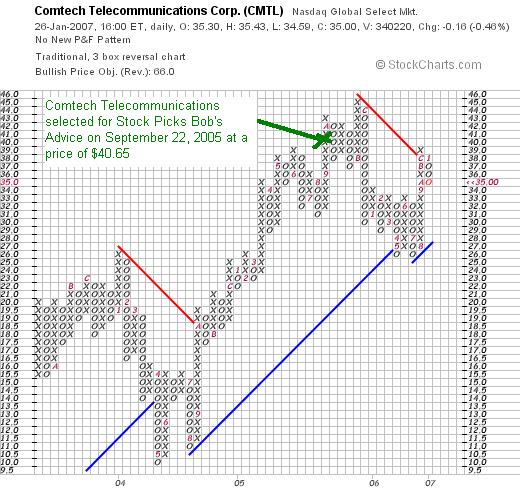
 On September 22, 2005, I "revisited" Comtech Telecommunications (CMTL) when it was trading at $40.65. CMTL closed at $35.00 on January 26, 2007, for a loss of $(5.65) or (13.9)% since posting.
 On December 4, 2006, Comtech (CMTL) announced 1st quarter 2007 results. Although beating expectations, sales for the quarter decreased to $97.1 million from $106.6 million in the same quarter last year. GAAP Net income was $10.8 million or $.41/diluted share for the quarter ended October 31, 2006, down from $11.5 million or $.43/share in the same quarter last year.
 Finally, on September 23, 2005, I "revisited" Thor Industries (THO) when it was trading at $33.41. Thor closed at $45.71 on January 26, 2007, for a gain of $12.30 or 36.8% since posting.
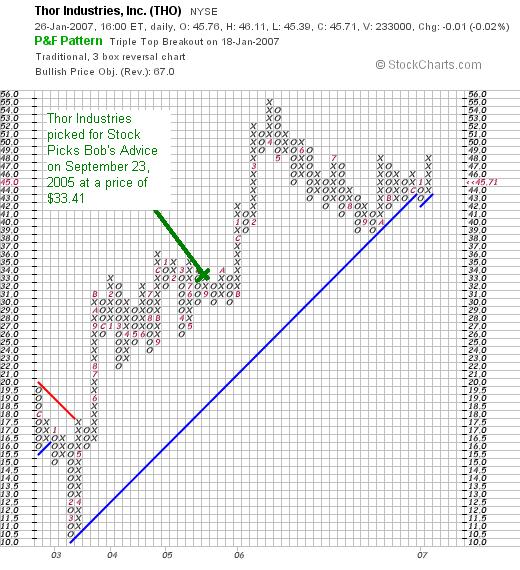
On November 27, 2006, Thor reported 1st quarter 2007 results. For the quarter ended October 31, 2006, sales dropped 4% to $727.7 million from $761.3 million in the same quarter the prior year. Net income was $32.6 million down 25% from last year's $43.4 million. Earnings came in at $.59/share down from $.77/share.
So how did I do with these three stocks? Well, two made nice gains and one had a loss for an average gain of 18.4%. Not too shabby actually!
Anyhow, I have to run! So have a great weekend everyone and drop me a line at bobsadviceforstocks@lycos.com or simply leave your questions or comments right on the blog.
Bob
Abaxis (ABAX) "Revisiting a Stock Pick"
Hello Friends! Thanks so much for stopping by and visiting my blog, Stock Picks Bob's Advice! As always, please remember that I am an amateur investor, so please remember to consult with your professional investment advisors prior to making any investment decisions based on information on this website.
 I was looking through the list of top % gainers on the NASDAQ this afternoon and noted that an 'old favorite' of mine, Abaxis (ABAX), was one of the top % gainers, closing at $20.57, up $3.57 or 21% on the day.
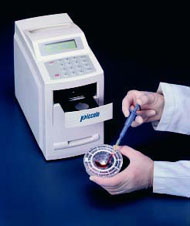
I first posted ABAXIS on Stock Picks Bob's Advice on September 26, 2003, when the stock was trading at $13.40. With today's close at $20.57, this represents an appreciation of $7.17 or 53.5% since posting. Looking through some of the underlying 'numbers' on the stock, it appears to still deserve a place on this blog. I do not own any shares or options on this stock. Let me review some of the recent information that I found.
What exactly does this company do?
According to the Abaxis "Profile" on Yahoo, the company
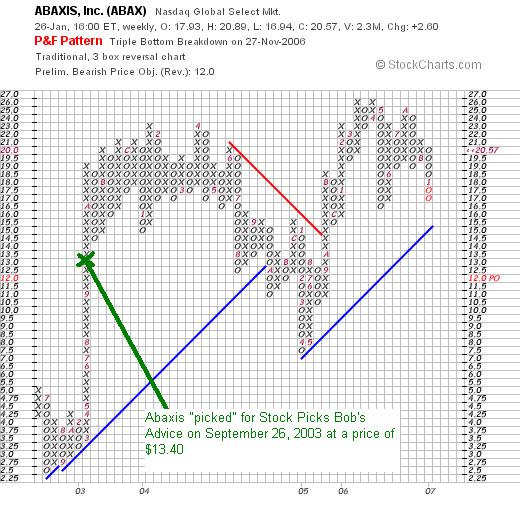
 "...engages in the development, manufacture, and marketing of portable blood analysis systems for use in veterinary or human patient-care setting to provide clinicians with blood constituent measurements. Its primary product is blood analysis system, consisting of a 6.9 kilogram analyzer and a series of single-use plastic discs, called reagent discs that contain chemicals required to perform a panel of up to 13 tests on veterinary patients and 14 tests on human patients."
How did the company do in the latest quarter?
As is a common factor in many of the stocks making strong moves higher, it was the announcement of quarterly results which drove the stock higher on Friday. After the close of trading on Thursday, the company announced 3rd quarter 2007 results. For the quarter ended December 31, 2006, revenues came in at $22.0 million, up 26% over last year's $17.4 million. Net income was up nearly 50% at $7.3 million, compared with $5.2 million the year earlier. Diluted net income came in at $.13/share, up from $.09/share last year same period.
This earnings result beat expectations of $.12/share.
How have they done longer-term?
Looking at the Morningstar.com "5-Yr Restated" financials, we can see that revenue has grown steadily from $31 million in 2002 to $69 million in 2006 and $75 million in the trailing twelve months (TTM).
Earnings, initially a bit erratic, increasing from $.02/share in 2002 to $1.16/share in 2004, dipped to $.22/share in 2005 but then rebounded to $.35/share in 2006 and $.41/share in the TTM.
The company has increased its relatively small float, with 14 million shares reported in 2002, 20 million in 2006 and 21 million in the TTM. This represents a 50% increase in shares outstanding while revenue climbed 150% and earnings were up 2000%. This is an acceptable dilution relative to the other financial results imho. In addition, the dilution has slowed considerably the last few years.
Free cash flow has been positive and increasing the past few years. $6 million reported in 2004 and $7 million in 2006, $8 million in the TTM.
The balance sheet is solid with $35.9 million in cash reported by Morningstar. This is enough to pay off both the $9.5 million in current liabilities and the $1.6 million in long-term liabilities almost 3x over! In fact, if we calculate the current ratio, adding the $35.9 million in cash with the $29.5 million in other current assets resulting in a total of $65.4 million, which when compared to the $9.5 million in current liabilities yields a ratio of 6.9, one of the strongest current ratios on this entire blog.
What about some valuation numbers?
Reviewing the Yahoo "Key Statistics" on ABAX, we can see that this is a small cap stock with a market capitalization of only $427.03 million. The trailing p/e is a rich 51.68, but the earnings are increasing so quickly that the forward p/e (fye 31-Mar-08) is a much more reasonable 28.57. In fact the PEG (5 yr expected) is also a reasonable (between 1.0 and 1.5 is reasonable from my perspective) 1.34.
According to the Fidelity.com eresearch website, the company has a Price/Sales ratio (TTM) of 4.40, way below the industry average of 22.86. Unfortunately, in terms of profitability, as measured by the Return on Equity (ROE) (TTM), the company has a ROE of 11.82% below the industry average of 31.03%.
Finishing up with Yahoo, we can see that there are 20.76 million shares outstanding and 20.17 million that float. Interestingly, there are 2.56 million shares out short (as of 1/9/07) representing 12.8% of the float or 16.5 trading days of volume. Using my own 3 day rule for short interest, this is quite significant and would well explain today's sharp rise. In the face of strong earnings, the short-sellers were "squeezed" and as they rushed to cover their shorts by purchasing shares on the market, they likely pressured the stock higher---squeezing other short-sellers in the process. Just a guess, but it sure looks like a bit of a panic with that 21% rise today!
No stock dividend is reported and no stock splits are noted on Yahoo.
How about a chart?
If we look at a "Point & Figure" chart on Abaxis from StockCharts.com, we can see that the stock which traded as low as $2.50 in July, 2002, climbed sharply in 2003 to $21 by December. The stock pulled back during much of 2004 and early 2005 dipping to a low of $7.50 in April, 2005. Since then the stock has been moving higher to a high of $26 in April, 2006, only to pull back to the $16.50 level before now moving higher once again. It has been a volatile stock to watch!
Summary: What do I think?
Well, in a word, I still like this stock! They reported solid earnings yesterday exceeding expectations. They have been steadily increasing revenue. Although earnings have been a bit more erratic, they also have been growing their earnings steadily at least for the past 3 years. The company is spinning of nice free cash and has a very solid balance sheet. They have expanded their float somewhat but have grown revenue and especially earnings much faster.
Valuation-wise, the p/e is a bit rich (over 50) but the company is growing so fast that the PEG comes in at a nice 1.34. The Price/Sales is quite low for its group, although the ROE is a bit weaker than the average company as well. Finally, there are a lot of short-sellers on this stock and it is a set up for a squeeze. They had nearly 1.5 million shares traded today, still not enough volume to account for the 2.5+ million shares out short as of a couple of weeks ago! Thus, if the stock continues to show strength, there may be a bit of a panic among the short-sellers that have not covered yet. Just a guess.....but I guess that is a reasonable analysis. Finally, the chart, while a bit erratic....one could call it 'wide and loose',
In summary, this is the kind of company I would love to have in my own portfolio, but unfortunately, I don't have a buy signal to add a position and shall be 'sitting on my hands'.
Thanks so much for stopping by and visiting! If you have any comments or questions, please feel free to leave them on the blog or email me at bobsadviceforstocks@lycos.com. If you get a chance, please be sure and visit my Stock Picks Podcast Site where you can download an mp3 discussion of many of the same stocks I write about on the blog!
Have a great weekend everyone!
Bob
Posted by bobsadviceforstocks at 12:28 AM CST
|
Post Comment |
Permalink
Updated: Saturday, 27 January 2007 12:34 AM CST
Thursday, 25 January 2007
ValueWiki The Blog recognizes Stock Picks Bob's Advice!
A real big 'thank-you' to Jon and Zach, the writers of ValueWiki, who had some very kind words about yours truly and this blog. They wrote in their entry entitled "10 Great Finance Blogs Flying Under the Radar" and ranked this blog #1:
" 1 Bobsadviceforstocks.tripod.com/bobsadviceforstocks/
Bob Freedland does what every stock blog should do: thorough analysis of companies. Complete reports, week in and week out, since 2003. So many top-ranked Seeking Alpha contributors write pithy one paragraph blurbs about the iPhone, and so few take the time to do the kind of serious fundamental analysis Bob consistently churns out on new companies every single week. This is an impressive blog."
Thank you so much Jon and Zach! It is kind words like yours that keeps me going on this website. Wishing you the best of luck with your ValueWiki and I would encourage all of my readers to drop by and check out your site!
Bob
Ametek (AME)
Hello Friends! Thanks so much for stopping by and visiting my blog, Stock Picks Bob's Advice! As always, please remember to consult with your professional investment advisors as I am an amateur investor.
 Ametek (AME) is a stock that I intended to write up yesterday but frankly, I just never got around to doing it! The stock hit the NYSE top % gainers list yesterday, and after looking at some of the background on the company, I still believe it deserves a spot on the blog. Ametek closed today at $34.28, up $.11 or 0.32% on the day.
Let's take a closer look at this stock and I will try to show you why I like it!
What exactly does the company do?
 According to the Yahoo "Profile" on Ametek, the company
"...engages in the manufacture and marketing of electronic instruments and electromechanical devices worldwide. The company operates through two groups, the Electronic Instruments Group (EIG) and the Electromechanical Group (EMG)."
How did the company do in the latest quarter?
Yesterday, before the opening of trading on the NYSE, the company announced 4th quarter 2006 results. Sales for the quarter ended December 31, 2006, climbed 19% to $480.7 million from $403.8 million in the same quarter the prior year. Net income climbed 30% to $47.8 million or $.45/diluted share, up from $36.9 million or $.35/diluted share in the same quarter last year.
The company beat expectations of sales of $465 million and earnings of $.43/share. For fiscal year 2007, the company raised guidance on sales with indications for a 10% increase to $2 billion ahead of the current estimates of $1.93 billion. Estimates for net income were in line with current expectations of a 13-15% increase from 2006's $1.71/share to a range of $1.93 to $1.97/share.
I find earnings reports that are able to demonstrate increased revenue, increased earnings, beat expectations for both and manage to raise guidance as well are about as good an investor going long on a stock could hope for!
What about longer-term financial results?
Looking at the "5-Yr Restated" financials on Ametek (AME) on Morningstar.com, we find a beautiful picture of steadily increasing revenue. Revenue was $1.019 billion in 2001 and has increased each year to $1.43 billion in 2005 and $1.74 billion in the trailing twelve months (TTM).
Earnings during this period have also steadily increased from $.66/share in 2001 to $1.33/share in 2005, and $1.64 in the TTM.
The company also pays a small dividend which was $.08/share in 2001, and doubled to $.16/share in 2004 and has been $.16/share in the TTM as well.
Ametek has modestly increased its outstanding shares from 98 million in 2001 to 106 million in the TTM. This is approximately a 7% dilution while revenues increased about 65% and earnings were up more than 100%. This is a very tolerable level of stock dilution imho.
Free cash flow has also been positive and increasing from $138 million in 2003 to $143 million in 2005 and $190 million in the TTM.
Finally, the balance sheet is satisfactory with $58.5 million in cash and $601.0 million in other current assets. When compared to the $472.7 million in current liabilities, this works out to a current ratio of 1.4. Generally, I use a minimum of 1.25 to suggest good financial health. The company has another $626.5 million in long-term liabilities but with the solid and increasing free cash flow this doesn't appear to be a problem.
What about some valuation numbers for this stock?
According to the Yahoo "Key Statistics" on AME, this is a mid cap stock with a market capitalization of $3.63 Billion. The company has a trailing p/e of 20.93 with a forward p/e of 15.51. The PEG ratio is a very nice 1.25 (5 yr expected).
Using the Fidelity.com eresearch website, we find that the Price/Sales (TTM) is a reasonable 1.88 with an industry average of 11.31. The company appears to more profitable than most companies in its industry with a return on equity (ROE) (TTM) of 19.79 compared to an industry average of 18.79%. Thus, the company is relatively 'cheaper' than average as well as being slightly more 'profitable' than the average company in the same industry!
Finishing up with Yahoo, we can see that there are 105.86 million shares outstanding with 102.09 million that float. Currently there are 1.85 million shares out short representing 2.80% of the float (as of 12/12/06). This is also 5.4 trading days of volume (the short ratio). Using my own 3 day rule on short ratio, this is a bit of a heavy short interest and the stock price rise yesterday could well have been part of a 'squeeze' of the shorts.
The company currently pays a foward dividend of $.24/share yielding 0.7%. The last stock split was a 3:2 split on 11/28/06.
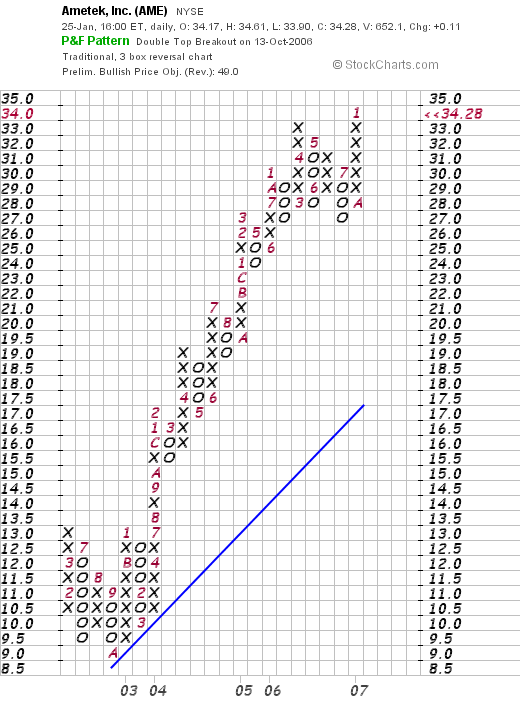
What does the chart look like?
Examining the "point and figure" chart on Ametek from StockCharts.com, we actually can see a VERY strong chart which since pulling back to $9/share in October, 2002, has been on a tear, moving strongly higher without much of a 'rest'. The stock pulled back to $27 in July, 2006, and is currently pushing to new highs at the $34.28 level.
Summary: What do I think about this stock?
Quite frankly, I like this stock a lot! That is why I went back and posted Ametek today even though it hit the top % gainers list yesterday! Let's review a few of the things that I find attractive about Ametek. As negative, the stock is headquartered in Pennsylvania instead of my home state of Wisconsin...well you can't have everything :). But seriously, they reported quarterly results which were terrific, strong growth in revenue and earnings, beating expectation and raising guidance for revenue. On top of this, they have a strong record of doing similarly for the past 4-5 years. They pay a dividend which they have increased rercently, they have kept the # of shares outstanding fairly stable and have steadily increasing and positive free cash flow. Furthermore, the balance sheet looks solid.
Valuation-wise the p/e is relatively low and the forward p/e is in the mid-teens. The PEG at 1.25 is very reasonable. The Price/Sales is LOW for its group and the ROE is high. There are even a significant number of shares out short setting this stock up for a squeeze. Finally, the graph looks nice. Now, if only I had a buy signal to add this stock to my portfolio :(. Anyhow, that's a great one for the blog!
Thanks so much for stopping by and visiting. I hope that my comments are helpful to all of you! If you have any comments or questions, I look forward to hearing from you right on the blog or email me at bobsadviceforstocks@lycos.com. If you get a chance, drop by and listen to my Stock Picks Podcast which you can find on my Podcast Website!
Bob
Posted by bobsadviceforstocks at 8:57 PM CST
|
Post Comment |
Permalink
Updated: Thursday, 25 January 2007 8:59 PM CST
Newer | Latest | Older


