Stock Picks Bob's Advice
Thursday, 5 April 2007
Immucor (BLUD) and AZZ (AZZ) "Trading Transparency"
Hello Friends! Thanks so much for stopping by and visiting my blog, Stock Picks Bob's Advice! As always, please remember that I am an amateur investor, so please remember to consult with your professional investment advisers prior to making any investment decisions based on information on this website.
I must apologize for nominally breaking my rules. After writing up my review of AZZ yesterday, I realized that I didn't take into consideration the lowered guidance for 2008 when I made my purchase. That just isn't my kind of stock in this blog. And you all know that!
Today, looking at the list of top % gainers, I came across Immucor that I wrote up on Stock Picks way back in April, 2006, a year ago. I shall try to give all of you an updated review of this stock. In any case, a few moments ago I decided to unload my AZZ, and sold my 120 shares at $47.06, and went ahead and purchased 180 shares of BLUD at $33.80.
I made a similar mistake a month or two ago, and reversed a trade that didn't really make sense. It pays to stick to familiar stocks sometime, and as good as I may be (I am just tongue in cheek on this one), I too make what I would call mistakes--these aren't necessarily bad investments, they just don't quite fit into my own strategy. And I reserve the right to admit errors and undo them. I shall work harder to avoid these kinds of trades in the future. They are a distraction from my own thinking.
Anyhow, that's the update. Thus, I now rate
AZZ (AZZ) IS DOWNGRADED TO HOLD and
IMMUCOR (BLUD) IS RATED A BUY
Thanks so much for stopping by and visiting! If you have any comments or questions, please feel free to leave them on the blog or email me at bobsadviceforstocks@lycos.com.
Bob
Wednesday, 4 April 2007
AZZ Inc. (AZZ)
Hello Friends! Thanks so much for stopping by and visiting my blog, Stock Picks Bob's Advice! As always, please remember that I am an amateur investor, so please remember to consult with your professional investment advisers prior to making any investment decisions based on information on this website.
 Earlier today I posted about my purchase of shares of AZZ (AZZ). This company made the list of top % gainers on the NYSE today, closing at $47.7, up $1.86 or 4.05% on the day. As I just noted, I do own shares in AZZ, shares that were purchased today. So please take that into consideration when reading what I am writing. AZZ is not a perfect fit for this blog, nor is it a perfect fit for my portfolio. But it appears to meet many of the things I look for in a stock and with the strong trading momentum, I chose to purchase shares. We shall find out how that trade works out as time goes by. Meanwhile, let's take a closer look at this company and I will share with you some of the things that led me to take a position in this stock when the opportunity arose.
What exactly does this company do?
 According to the Yahoo "Profile" on AZZ, the company
"...manufactures electrical equipment and components for power generation, transmission, and distribution, as well as for industrial markets in the United States and internationally. The company operates in two segments, Electrical and Industrial Products, and Galvanizing Services."
How did they do in the latest quarter?
On January 5, 2007, AZZ announced 3rd quarter 2007 results. For the quarter ended November 30, 2006, revenues increased 47% to $65.4 million from $44.3 million the prior year same period. Net income climbed 203% to $5.3 million or $.88/diluted share, up sharply from $1.7 million or $.30/diluted share the prior year same period.
In the same announcement, the company increased guidance for fiscal 2007 with earnings estimated to be in the range of $3.15 to $3.25/diluted share. Revenues were estimated in the range of $250 to $260 million.
Just two weeks after the earnings report, the company threw some financial "cold water" on the stock price by estimating that fiscal 2008 earnings and revenue would come in below 2007 results. They announced projected earnings of $2.70 to $2.80/share for the fiscal year ended February 29, 2008, on revenue of $275 to $285 million. The market appears to have digested this bit of bad news and is already thinking beyond this estimate as the stock price has now firmed and once again moved towards the upside.
In general, I would prefer not to buy any stock with estimates of an earnings decline. However, in light of the strong revenue growth estimated, and the current strong price move, I was willing to give the stock a chance. We shall have to see how this one works out for me.
How about longer-term financial results?
AZZ has indeed had a bit of an erratic financial past. Looking at the Morningstar.com "5-Yr Restated" financials on AZZ, we find that revenue which was $153 million in 2002, climbed to $183 million in 2003, before dropping back to $136 million in 2004. Since 2004, revenue has climbed to $187 million in 2006 and $231 million in the trailing twelve months (TTM).
Earnings have also been a bit erratic, climbing from $1.50 in 2002 to $1.63/share in 2003, before dropping back to $.79/share in 2004. Since then earnings have been climbing steadily and rather dramatically to $1.38/share in 2006 and $2.93/share in the TTM.
This is a small company with a fairly stable number of shares with 5 million shares reported in 2002 increasing to 6 million in the TTM.
Free cash flow is currently positive but also a bit erratic with $11 million in 2004, $0 in 2005, $6 million in 2006 and $2 million in the TTM.
The balance sheet is solid with $1.1 million in cash and $100.7 million in other current assets. Compared to the $50 million in current liabilities, this $101.8 million in current assets yields a solid current ratio of just over 2.0.
What about some valuation numbers?
Examining Yahoo "Key Statistics" on AZZ, we can see how small a small cap stock this is with a market capitalization of only $280.04 million. The trailing p/e is a reasonal 16.37 with a forward p/e (fye 28-Feb-08) not much different at 16.78.
Looking at the Fidelity.com eresearch website, we find that AZZ has a Price/Sales ratio (TTM) of only 1.15, with an industry average of 34.10. The company is not quite as profitable as other companies in its industry reporting a Return on Equity (ROE) (TTM) of 18.16% slightly lower than the industry average of 20.78%.
Finishing up with Yahoo, we find that there are 5.82 million shares outstanding and 5.57 million that float. As of 3/12/07 there were 213,100 shares out short representing 3.8% of the float or 7.2 trading days of volume. This is a significant short interest from my perspective, relative to my own '3 day rule' for short interest, and may lead the company subject to a short squeeze if any good news is reported. No dividend is paid and no stock split is reported.
What does the chart look like?
If we look at the AZZ "Point & Figure" chart from StockCharts.com, we can see that after a price correction from $20 in February, 2002, to a low of $8.50 in March, 2003, the stock has strongly moved higher the past four years to a high of $55 in January, 2007. The stock recently came under pressure on the back of the guarded guidance for 2008, correcting down to $36, before once again moving higher to the current level of $48.15. The stock does not appear to have broken down key support levels on this chart.
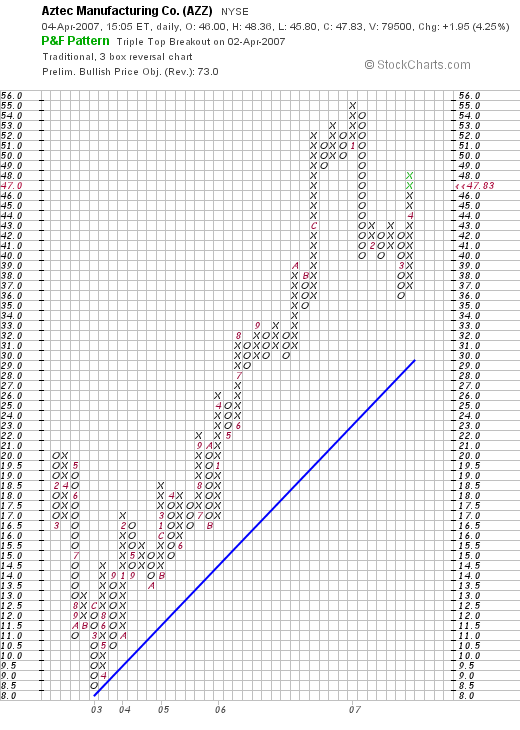
(You can see that AZZ was previously called Aztec Manufacturing)
Summary: What do I think about this stock?
Well, let me say that I chose to purchase this stock. I do not think I gave the reduced guidance for 2008 much attention, and this is a bit of a drag on the stock price. Otherwise, technically the stock is behaving well, the last quarter was very strong, the Morningstar.com report looks solid, valuation is reasonable and the balance sheet looks healthy. I am now a stockholder in this company which is really very small. Wish me well and I shall keep you posted.
Thanks again for visiting! If you have any comments or questions, please feel free to leave them on the blog or email me at bobsadviceforstocks@lycos.com.
Bob
Posted by bobsadviceforstocks at 3:00 PM CDT
|
Post Comment |
Permalink
Updated: Thursday, 5 April 2007 12:00 AM CDT
AZZ Inc. (AZZ) "Trading Transparency"
Hello Friends! Thanks so much for stopping by and visiting my blog, Stock Picks Bob's Advice! As always, please remember that I am an amateur investor, so please remember to consult with your professional investment advisers prior to making any investment decisions based on information on this website.
Earlier this morning I wrote about how I had managed to fortunately hit a first sale point in Jones Soda (JSDA), which for me is a 30% appreciation over my purchase price, and sold 1/6th of my holding....which out of 300 shares represented 50 shares. I also wrote about that darn nickel in my pocket :), which for me means that since I am at 18 positions in my Trading Account, well under my maximum of 25 positions, then with a sale of a portion of one of the 18, that gives me a "permission slip" to add a new position.
You don't have to ask me twice :).
Looking through the list of top % gainers on the NYSE this afternoon, shortly before the close of regular trading, I came across a new name for the blog, a name that I have seen showing up on these lists recently: AZZ Inc. (AZZ). As I write, AZZ is trading at $47.49, up $1.61 or 3.51% on the day. Briefly checking the Morningstar page on AZZ, and the latest quarterly report, things looked good enough for me and I went ahead and purchased 120 shares at $47.34. I shall try to get together a more in depth analysis of AZZ. Meanwhile, I purchased some shares and
AZZ INC. (AZZ) IS RATED A BUY
Thanks again for stopping by and visiting! If you have any comments or questions, please feel free to leave them on the blog or email me at bobsadviceforstocks@lycos.com.
Bob
Jones Soda (JSDA) "Trading Transparency"
Hello Friends! Thanks so much for stopping by and visiting my blog Stock Picks Bob's Advice! As always, please remember that I am an amateur investor, so please remember to consult with your professional investment advisers prior to making any investment decisions based on information on this website.
A few moments ago I sold 50 shares (1/6th of my 300 share holding) of Jones Soda (JSDA) at $24.52. The stock had hit my first 30% appreciation target yesterday but I was not aware of this until after the close of trading. (As I have indicated elsewhere, I am really pretty 'low-tech' about all of this and monitor my stocks and enter my trade orders manually). These shares were just purchased 3/12/07 with a cost basis of $18.22 so I had a realized gain on this sale of $6.30 or 34.6% on this trade. My next sale on the upside would be at a 60% gain or 1.6 x $18.22 = $29.16, at which time I would be selling 1/6th of 250 or 41 shares, or if the stock should decline, I shall sell all of my shares if the stock hits my purchase cost of $18.22. This doesn't change my outlook on this stock and....
JONES SODA (JSDA) IS A BUY.
Since I am now at 18 positions, this gives me a 'signal' to add a new position. I like to say that the nickel is burning a hole in my pocket already, but I shall be fairly busy during the day, so I don't know if I shall make a purchase or not. I shall keep you posted. Meanwhile, as always, I wish you the best of luck and a wonderful day.
Bob
Tuesday, 3 April 2007
"Revisiting a Stock Pick" Aeropostale (ARO)
Hello Friends! Thanks so much for stopping by and visiting my blog, Stock Picks Bob's Advice! As always, please remember that I am an amateur investor, so please remember to consult with your professional investment advisers prior to making any investment decisions based on information on this website.
 I was looking through the list of top % gainers on the NYSE this evening and came across an old favorite of mine, Aeropostale (ARO) which closed at $42.06, up $1.95 or 4.86% on the day. I do not own any shares nor do I own any options on this company.
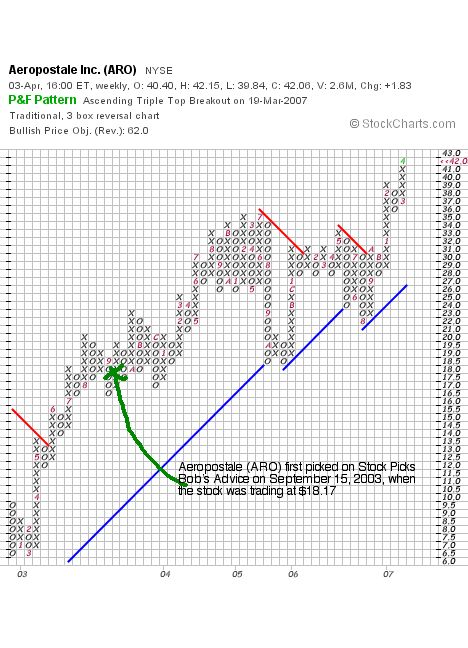
I first posted Aeropostale (ARO) on Stock Picks Bob's Advice on September 15, 2003, when the stock was trading at $27.25. On April 27, 2004, ARO had a 3:2 stock split making the effective stock pick price actually 2/3 of that amount or $18.17. Thus, with today's close, the stock has appreciated $23.89 or 131.5% since posting about 3 1/2 years ago.
Let's take an updated look at this company and I shall try to show you why I believe it still deserves a spot on this blog.
What exactly does this company do?
According to the Yahoo "Profile" on Aeropostale (ARO), the company
 "...operates as a mall-based specialty retailer of casual apparel and accessories for young women and men in the United States. It designs, markets, and sells active-oriented, fashion and fashion basic merchandise principally targeting 11 to 18 year-old young women and young men under its own brands. The company offers graphic t-shirts, tops, bottoms, sweaters, jeans, outerwear, and accessories."
How did they do in the latest quarter?
On March 15, 2007, Aeropostale reported 4th quarter 2006 results. During the quarter total sales increased 16.5% to $506.8 million from $435.2 million for the same quarter in 2005. Same-store sales, a better indicator of the health of a growing retail firm, grew a less robust 2.2%.
Net income for the quarter came in at $57.3 million or $1.08/diluted share. Excluding a 'vendor concession, the company "achieved net earnings of $1.00 per diluted share, representing an increase of approximately 31.6%, when compared to the $.76 per diluted share in the fourth quarter of fiscal 2005."
The company beat expectations of analysts of $.99/share.
How about longer-term results?
Examining the Morningstar.com "5-Yr Restated" financials on ARO, we find that revenue has steadily grown since 2002 when the company reported $202 million in sales. This grew to $1.2 billion in 2006 and $1.34 billion in the trailing twelve months (TTM).
Earnings have increased from $.93/share in 2004 to $1.50/share in 2006 and $1.66 in the TTM. During this same time the company managed to reduce the number of shares outstanding from 55 million in 2004 to 53 million in the TTM.
Free cash flow has been positive and growing with $68 million reported in 2004 increasing to $86 million in 2006 and $125 million in the TTM. The balance sheet appears solid with $203.3 million in cash and $194.7 million in other current assets. This total of $398 million of current assets easily can cover both the $189.5 million in current liabilities and the $101.5 million in long-term liabilities. In fact, the current ratio, which is found by dividing the $398 million in total current assets by the $189.5 million in current liabilities yields a 'healthy' current ratio of 2.1.
What about some valuation numbers?
Examining Yahoo "Key Statistics" on Aeropostale, we find that the market cap at $2.21 billion represents a mid cap stock. The trailing p/e is moderate at 21.20 with a forward p/e (fye 03-Feb-09) of 15.99 even more reasonable. The PEG ratio (5 yr expected) is 0.78, making it also quite reasonably priced. I generally find a PEG of 1.0 to 1.5 an acceptable value.
Looking at the Fidelity.com eresearch website, we find that the Price/Sales (TTM) is a bit rich at 1.51, with an industry average of 1.10. Every once in awhile, I like to point my readers to the wonderful article by Paul Sturm, when he reminded all of us that a Price/Sales ratio is most important when compared to other companies in the same industrial group.
The company while not a great buy on the Price/Sales ratio, is attractive however, because of its profitability--at least as measured by Return on Equity (ROE) (TTM). In this case, ARO comes in at a ROE (TTM) OF 36.55%, ahead of the industry average of 21.96%.
Finishing up with some more Yahoo information, the company has 52.57 million shares outstanding with 51.58 million that float. As of 3/12/07, there were 5.84 million shares out short representing 11.3% of the float or 5 trading days of volume. Personally, I have arbitrarily chosen to use a 3 day cut-off of the short ratio, so this 5 day number may well have the potential of a short squeeze if the company continues releasing strong financial results.
The company does not pay a dividend and the last stock split was the 3:2 stock split on April 27, 2004
What does the chart look like?
If we examine a "Point & Figure" chart on Aeropostale from StockCharts.com, we can see a fairly steady record of price appreciation.
Summary: What do I think about this stock?
Basically, this has been a great stock pick on this blog with a terrific performance. The latest quarter was strong, the company beat earnings expectations and guided in line with the analysts for the upcoming quarter. I was little non-plussed by the 2.2% same store sales growth. Personally, I would like to see a retail firm consistently post close to 5% or greater same store sales growth to really catch my attention--however, in today's relatively weak retail environment, steady growth is important. Keep an eye on this company's same-store numbers in the months ahead! The Morningstar.com report was solid, with steady revenue growth, earnings, free cash flow, decreasing shares outstanding and a solid balance sheet. Valuation shows the Price/Sales a bit rich, but profitability was outstanding as measured by return on equity.
Overall, the numbers are impressive and
AEROPOSTALE (ARO) IS RATED A BUY
Thanks again for stopping by! If you have any comments or questions, please feel free to leave them on the blog or email me at bobsadviceforstocks@lycos.com. Also, if you get a chance, be sure and visit my Stock Picks Podcast Website. I promise to try to get a new podcast up in the next few days. You know how one thing can lead to another and the day is never long enough for everything you figure on doing!
Bob
Sunday, 1 April 2007
"Looking Back One Year" A review of stocks picks from the week of November 7, 2005 and November 14, 2005

Hello Friends! Thanks so much for stopping by and visiting my blog, Stock Picks Bob's Advice! As always, please remember that I am an amateur investor, so please remember to consult with your professional investment advisers prior to making any investment decisions based on information on this website.
It is another weekend! And for me that means, if I don't skip this, doing my proverbial 'housework' around here and looking back at past stock selections on my blog. As part of my effort at transparency and to help make this website somewhat meaningful, I have found it helpful to review, in a systematic fashion, all of my past stock 'picks' when I am a year or so out. (I started almost exactly a year out and then, after missing a weekend here, a weekend there....you get the picture---I am now more like a 1 1/3 year out review!) Since there weren't any stock picks posted for the week of November 7, 205, and since I am already more than a year out, well instead of giving in to my almost joy at realizing there weren't any stocks to review, I decided to jump to the week of November 14, 2005, and take a look at those stock picks. (A I dedicated or what?...no answers please :))
These "reviews" do not reflect actual holdings of mine, my actual trading strategy, and the effects of taxes and partial sales of stocks, etc. These are simply a simplified way of looking at past stock selections and seeing simply if they moved higher or lower since being posted! In other words, the review of performance assumes a 'buy and hold' strategy and equal dollar purchases of each stock from the week involved. I calculate the average performance of the stocks by getting the mean of the performance of all of the stocks discussed.
In my own Trading Portfolio, and what I write about here, is a strategy that is very different. I recommend aggressively selling losing stocks quickly and completely, initially at 8% loss levels, and gaining stocks slowly and partially at targeted appreciation points. This strategy is key to my own portfolio management philosophy and the difference between 'buying and holding' and actively managing the portfolio would certainly make a difference in the outcomes. I use the buy and hold evaluation technique simply because I am actually fairly low tech in my approach. I do not have any software to assess what might have happened and simply put, I think a review like this is adequate to give you, the reader, an idea about these stocks.
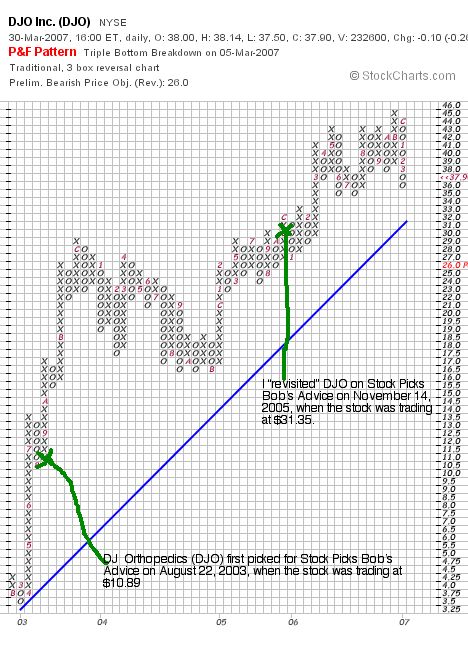
 On November 14, 2005, I 'revisited' DJ Orthopedics (DJO) on Stock Picks Bob's Advice when the stock was trading at $31.35. I use the term "revisit" because my first 'pick' of DJ Orthopedics (DJO) on this blog was on August 22, 2003 when the stock was trading at $10.89. Unfortunately, I have never owned any shares or options on this stock. DJO closed at $37.90 on March 30, 2007, for a gain of $6.55 or 20.9% since posting.
Here is a "Point and Figure" Chart on DJO from StockCharts.com:
 On February 12, 2007, DJO announced 4th quarter 2006 results. Net revenues for the quarter came in at $110.8 million, up 47.8% from the $75.0 million in the fourth quarter of 2005. Net income, however, dropped to $1.0 million down from $8.1 million in the prior year same period or $.04/share, down from $.35/share. Even using "Non-GAAP" numbers, removing impact of stock-based charges, cost of acquisitions, and the company move to a new headquarters, net income still dropped to $.31/share down from $.35/share. This company has a superb record of revenue growth, however, with the drop in income in the latest quarter, the best I can do is rate
DJ ORTHOPEDICS (DJO) IS RATED A HOLD

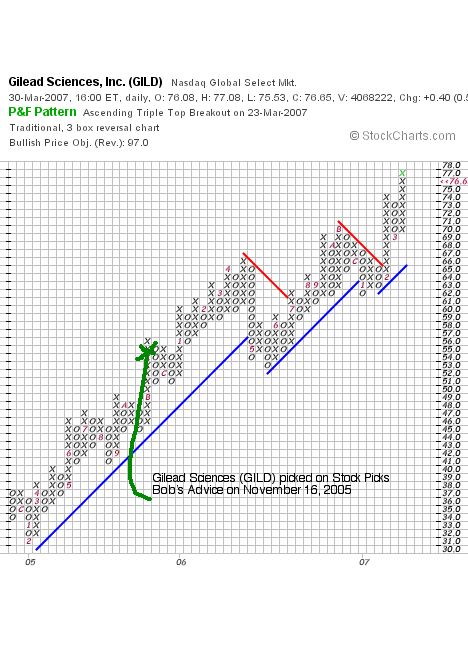
On November 16, 2005, I posted Gilead Sciences (GILD) on Stock Picks Bob's Advice when the stock was trading at $55.63. GILD closed at $76.65 on March 30, 2007, for a gain of $21.02 or 37.8% since posting. I do not own any shares nor do I have any options on this stock.
Here is a "Point & Figure" Chart on Gilead from StockCharts.com:
 On January 31, 2007, Gilead Sciences announced 4th quarter 2006 results. Total revenue for the fourth quarter of 2006 came in at $899.2 million, up 48% from prior year sales. GAAP net income was a net loss of $1.67 billion or $(3.62)/share, compared to a net income of $281.6 million or $.59/diluted share for the same quarter in 2005. Looking at 'Non-GAAP' net income was $372.8 million or $.78/share compared with last year's Non-GAAP net income for 2005 of $256.5 million or $.54/diluted share, which eliminates one-time tax expenses and expenses related to stock-based compensation and similar items. I much prefer GAAP results, but the prospects, if I may editorialize, for Gilead are such that I shall place
GILEAD SCIENCES (GILD) IS RATED A BUY
 On November 18, 2005 I "revisited" Marvell Technologies (MRVL) on Stock Picks Bob's Advice when the stock was trading at $55.70. I first looked at Marvell on May 21, 2004, when the stock was trading at $42.99. Marvell had a 2:1 stock split on June 29, 2004 and another 2:1 stock split on July 25, 2006, making the initial stock pick price $10.75, and the second pick price actually $27.85. MRVL closed at $16.81 on March 30, 2007, for a loss of $(11.04) or (39.6)% since the latest post.
Here is the "point and figure" chart on Marvell and my stock pick prices:
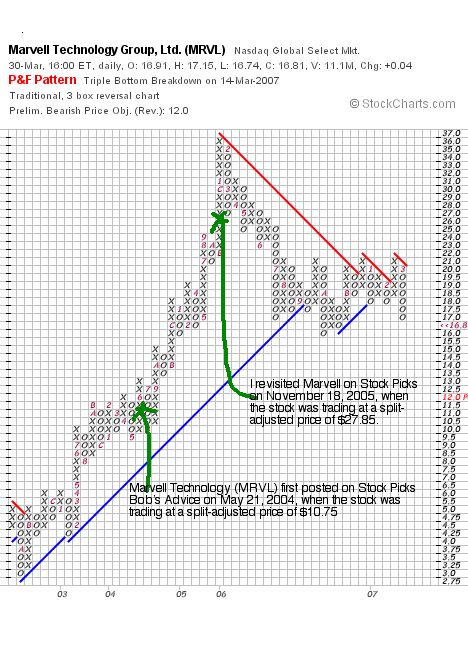
On Feberuary 26, 2007, Marvell reported preliminary 4th quarter 2006 results showing a 27% revenue growth from $489 million to $622 million in the latest quarter. The company, however, delayed earnings per share results as there is an ongoing review of stock option granting practice. A month later, the company continues to delay earnings results making assessment of the financial operations from my perspective most difficult.
In light of this,
MARVELL (MRVL) IS RATED A SELL
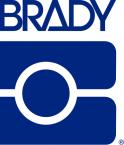 Finally, on November 18, 2005, I posted Brady Corp (BRC) on Stock Picks Bob's Advice when the stock was trading at $38.90. BRC closed at $31.20 on March 30, 2007, for a loss of $(7.70) or (19.8)% since posting.
On February 21, 2007, Brady (BRC) announced 2nd quarter 2007 results. Sales for the quarter were up a strong 39.1% to $321.3 million, compared to $231.0 million in the 2nd quarter of 2006. However, net income for the quarter fell 7.3% to $19.7 million from $21.3 million the prior year. Earnings per diluted Class A shares came in at $.36/share in the 2007 quarter, down from $.43 in the 2nd quarter 2006.
With the strong revenue growth and the anemic earnings results,
BRADY (BRC) IS RATED A HOLD.
The following is a "Point & Figure" chart on Brady (BRC) from StockCharts.com:
So how did I do with these four picks during the week of November 14, 2005?
Of the four stocks, two gained, and two lost money for an average performance of a loss of (.2)% on these four stocks!
Thanks again for visiting! If you have any comments or questions, please feel free to leave them on the blog or email me at bobsadviceforstocks@lycos.com. Have a great week trading and investing everyone!
Bob
Posted by bobsadviceforstocks at 11:53 AM CDT
|
Post Comment |
Permalink
Updated: Monday, 2 April 2007 1:22 AM CDT
Wednesday, 28 March 2007
Smucker J.M. (SJM)
Hello Friends! Thanks so much for stopping by and visiting my blog, Stock Picks Bob's Advice! As always, please remember that I am an amateur investor, so please remember to consult with your professional investment advisers prior to making any investment decisions based on information on this website.
 I was looking through the list of top % gainers today and came across Smucker (SJM) which closed at $53.44, up $2.06 or 4.01% on the day. I do not own any shares nor do I have any options on this stock but I must confess to being a regular peanut butter and jelly consumer and Smucker is certainly one of my favorite brands!
Let's take a closer look at this stock and I will share with you why I believe it deserves a place on this blog!
SMUCKER (SJM) IS RATED A BUY
What exactly does this company do?
According to the Yahoo "Profile" on Smucker, the company
 "...engages in the manufacture and marketing of branded food products worldwide. It provides peanut butter, shortening and oils, flour and baking ingredients, fruit spreads, baking mixes and ready-to-spread frostings, fruit and vegetable juices, beverages, dessert toppings, syrups, frozen sandwiches, pickles and condiments, and potato side dishes."
How did Smucker do in the latest quarter?
On February 16, 2007, Smucker (SJM) announced 3rd quarter 2007 results. Sales for the company declined in the quarter from $536.5 million in the quarter ended January 31, 2006, to $523.1 million in the same quarter ended January 31, 2007. O.K., I know I always pick stocks with revenue growing in the latest quarter! But I really like Smucker's jam and Jif peanut butter...and it has been a really lousy stock market and I need some comfort food like this to discuss :). But seriously, as the company points out, if it excludes discontinued Canadian businesses and U.S. industrial ingredient businesses, their sales actually increased 6%. Net income for the quarter did increase 29% to $40.4 million from $31.3 million, or a 31% increase on a per share basis from $.54/share in the third quarter of 2006 to $.71/share in the same quarter in the 2007 fiscal year.
This certainly was a mixed-news report, with the company missing revenue expectations of $534 million, but beating expectations for earnings of $.69/share. Apparently, Smucker was a beneficiary of the troubled Peter Pan peanut butter salmonella outbreak, as consumers turned to Jif for an alternative spread.
How about longer-term financial results?
Reviewing the Morningstar.com "5-Yr Restated" financials, we can see the large increase in revenue from $650 million in 2002 to $2.155 billion in 2006 and $2.156 billion in the trailing twelve months (TTM).
Earnings during this period have steadily increased from $1.31/share in 2002 to $2.45/share in 2006 and $2.63/share in the TTM.
The company has also been steadily increasing its dividend from $.68/share in 2002 to $1.08/share in 2006 and $1.11/share in the TTM. Since 2004, shares outstanding have increased from 50 million to 58 million in 2006 and 57 million in the TTM. Revenue and earnings have easily outpaced the growth in shares.
Free cash flow has been positive and growing with $39 million in 2004 increasing to $135 million in 2006 and $222 million in the trailing twelve months (TTM).
The balance sheet is good with $152.2 million in cash and $429.8 million in other current assets. This total of $582 million in current assets, when compared to the $247.5 million in current liabilities yields a current ratio of 2.35. The company does have a significant $653 million in long-term liabilities, but with the growing free cash flow, this doesn't appear to be a significant problem.
What about some valuation numbers?
Reviewing the Yahoo "Key Statistics" on Smucker, we can see that this company is a mid cap stock with a market cap of $3.03 billion. The trailing p/e is a reasonable 20.32, with a forward p/e (fye 30-Apr-08) estimated at 18.18. The PEG (5 yr expected) is a bit rich at 2.21.
Checking the Fidelity.com eresearch website, we can see that the valuation isn't too rich with a Price/Sales (TTM) of 1.36 with an industry average of 1.47. However, profitability, as measured by return on equity (TTM) comes in at 8.62%, less than the industry average of 20.69%.
Returning to Yahoo, we find that there are 56.62 million shares outstanding with 53.27 million that float. As of 2/12/07, there were 1.53 million shares out short representing 2.9% of the float of 7.9 trading days of volume (the short ratio). Using my '3 day rule', this short interest may well be significant with the stock moving higher today on an upgrade even while the rest of the market moved lower.
As noted above, the company pays a forward dividend of $1.12 yielding 2.20%. No stock splits are reported on Yahoo.
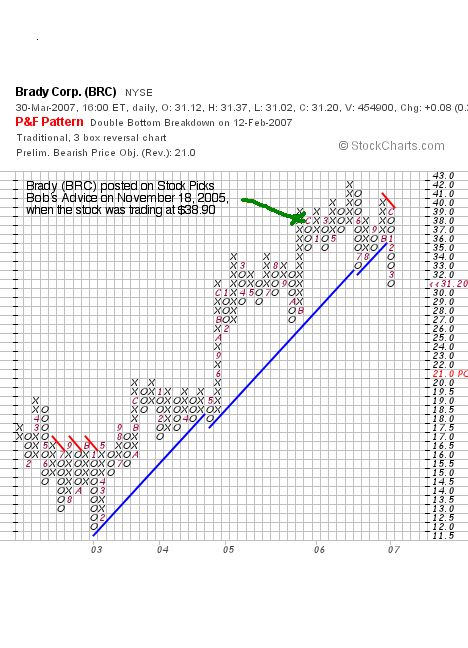
What does the chart look like?
If we examine the "Point & Figure" chart on Smucker from StockCharts.com, we can see a fairly steady progression from the $29 range in February, 2002 to the current $53.44 level. The company showed weakness early in 2006, but then recovered only to appreciate sharply throughout 2006 and into 2007. The chart looks strong to me.
Summary: What do I think about this stock?
I like Smucker (SJM) a lot. The latest quarterly report was imperfect, with revenue needing to be adjusted for discontinued business segments. However, the company has a nice Morningstar report, valuation is acceptable, the balance sheet is strong, the chart is solid, and the company makes a product that is high quality and easily understood. And I like Peanut Butter and Jelly.
Thanks so much for stopping by and visiting my blog! If you have any comments or questions, please feel free to leave your remarks right on the blog or email me at bobsadviceforstocks@lycos.com. If you get a chance, stop by and visit my Stock Picks Podcast Website.
Bob
Monday, 26 March 2007
MEDTOX Scientific (MTOX)
Hello Friends! Thanks so much for stopping by and visiting my blog, Stock Picks Bob's Advice! As always, please remember that I am an amateur investor, so please remember to consult with your professional investment advisers prior to making any investment decisions based on information on this website.
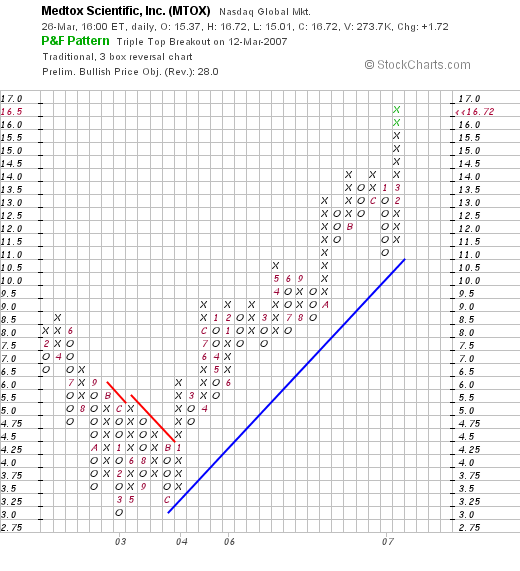
 I was looking through the list of top % gainers on the NASDAQ this afternoon, hoping to find a new name to share with you herre on the blog. A lot of my entries recently have been about stocks that I have recently bought, sold, or otherwise own in my Trading Account. MEDTOX Scientific (MTOX) was on the list, closing at $16.72, up $1.72 or 11.47% on the day. I believe that this small company deserves a place on the blog, and I would like to share with you some of the things that led me to this conclusion. I do not own any shares nor do I have any options on this stock.
MEDTOX (MTOX) IS RATED A BUY
What exactly does this company do?
According to the Yahoo "Profile" on MEDTOX, the company
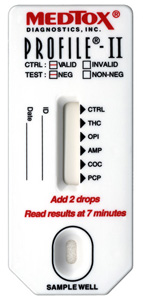 "...through its subsidiaries, provides specialty laboratory testing services and on-site/point-of-collection devices in the United States. The company operates in two segments, Laboratory Services and Product Sales."
How did they do in the latest quarter?
On February 27, 2007, MTOX announced 4th quarter 2006 results. Revenue for the quarter increased 16% to $17.3 million over the prior year. Operating income increased 48% to $8.2 million. Income before a one-time income tax benefit accrued in 2005 came in at $1.5 million vs. $.6 million in the prior year. Diluted earnings per share were actually unchanged when the tax benefit is included at $.13/share in 2006 and $.13/share in 2005.
What about longer-term financial results?
If we review the Morningstar.com "5-Yr Restated" financials on MTOX, we can see the steady rise in revenue from $49.1 million in 2001 (except for a slight dip in 2003) to $63 million in 2005 and $67.5 million in the trailing twelve months (TTM). Earnings have also been a bit erratic--climbing from $.36/share to $1.56/share from 2001 to 2002, then dipping to a loss of $(.04)/share in 2003. Since 2003, earnings have steadily improved and remained profitable with $.40/share in 2005 and $.52/share in the TTM. This small company has maintained their stock shares outstanding with little change with 7 million shares reported in 2001, increasing to 8 million in the TTM.
Free cash flow has been improving with $1 million in 2003, $3 million in 2004, $4 million in 2005 and $6 million in the TTM.
The balance sheet appears solid with $.8 million in cash and $18.2 million in other current assets, with the total of $19.0 million in current assets easily covering the $9.9 million in current liabilities (yielding a current ratio of 1.92), as well as the $3.4 million in long-term liabilities combined.
What about some valuation numbers on this stock?
Looking at Yahoo "Key Statistics" on MTOX, we find that this is a very small company with a market capitalization of only $137.27 million. The trailing p/e isn't bad at 32.34, with a forward p/e better at 18.79 (fye 31-Dec-08). The estimated PEG (5 yr expected) comes in at a very reasonable .95. Generally stocks with PEG's between 1.0 and 1.5 are considered reasonably priced. You can infer that a stock with a PEG under 1.0 like this one is relatively cheap, and that a stock with a PEG over 1.5 is relatively expensive.
According to the Fidelity.com eresearch website, MTOX is relatively cheaply priced when evaluated by the Price/Sales ratio coming in with a Price/Sales TTM of 1.75, compared to an industry average of 6.92. Looking at the Return on Equity (ROE) TTM, to evaluate profitability, we find that the company is much more profitable than the rest of the industry with a ROE of of 9.,76%, well above the industry average of 1.54% for its group.
Finishing up with Yahoo, we find that there are 8.21 million shares outstanding and 7.47 million that float. Of those that float, 0.1% are out short or 9,310 share representing 0.5 trading days of volume (the short ratio). No dividends are paid and no stock splits are reported on Yahoo.
What does the chart look like?
If we look at a "Point & Figure" Chart on MTOX from StockCharts.com, we can see that after a dip from $8.50 in April, 2002, to a low of $3.00 in March, 2003, the stock has steadily appreciated to its current level of $16.72, where it appears to be staying right above its support line and appearing to be heading for new higher territory. The stock chart looks strong to me!
Summary: What do I think?
Well I actually like this stock although it is much smaller than the average stock I look at here on this blog. The last quarter was strong and showed solid earnings growth (if you remove the one-time tax gain in the prior year) along with steady revenue growth as well. Certainly, the medical testing area has great growth potential. Longer-term, the company has shown steady growth the past few years and valuation-wise shows reasonable valuation with a PEG under 1.0, a Price/Sales low for its group, and a Return on Equity well above the industry average. Finally, the chart looks nice and there doesn't appear to be much in the way of technical weakness on this stock. I don't own any shares, am not planning right now to buy any shares, but if I were buying shares, this is the kind of stock that would attract me to make a purchase!
Thanks again for visiting! If you have any comments or questions, please feel free to leave them on the blog or email me at bobsadviceforstocks@lycos.com. And if you get a chance, be sure and visit my Stock Picks Podcast Website!
Bob
Posted by bobsadviceforstocks at 10:43 PM CDT
|
Post Comment |
Permalink
Updated: Monday, 26 March 2007 10:44 PM CDT
A Reader Writes "...but do you ever revisit a stock?"
Hello Friends! Thanks so much for stopping by and visiting my blog, Stock Picks Bob's Advice! As always, please remember that I am an amateur investor, so please remember to consult with your professional investment advisers prior to making any investment decisions based on information on this website.
Absolutely one of my favorite things about writing a blog is to receive comments and emails from readers. If you are interested in dropping me a line, please feel free to just leave comments write under the entries on the blog and I shall try to respond. If you would prefer, you can drop me a line at bobsadviceforstocks@lycos.com. While I cannot promise to get to every email I receive, I shall try to respond to as many as possible. If you would, please include your first name and where you are writing from.
 I received another email from Marcus A.L. who writes from Knoxville, Tennessee with a good question. Marcus wrote me yesterday:
"Hi Bob,
Do you trade on "news?" VCA Antech (Woof) should benefit from all the poisoned pet food frenzy that is gaining momentum in all forms of media. I know you have a strict rule of cutting your loses at 8%, but do you ever revisit a stock under any circumstances? Now that we're on the subject of news; do you follow the daily news of the market in general? Do you watch CNBC or read the Wall Street Journal to keep the temperature of the market?
Thanks,
Marcus A. L."
Marcus, you have written a great comment and let me try to respond. As you know, I recently wrote up and purchased shares in VCA Antech, a company that I greatly admire for many of the reasons I pick stocks. Great earnings, and great news. However, I hit my 8% loss and sold my shares, no matter how reluctantly.
I do revisit stocks and occasionally will purchase shares again. Currently I hold Kyphon (KYPH) which I initially sold at a loss, only to have the opportunity to repurchase a position. There are other stocks like Hibbett (HIBB) that I don't own, but would love to find the opportunity to re-establish a position. The same goes with WOOF.
I suspect that VCA Antech will benefit in some fashion from this rat poison in the food problem. But I doubt that will be significant for them. The real prognosticator for this stock will be their ability to continue to generate outstanding financial results quarter after quarter. I suspect they will indeed be able to do this, but time will tell.
My purchases of new positions (or re-establishing old positions) is dictated by my rigid trading indicators. I need to sell a portion of an existing position at a gain (my so-called 'good news' event), be under my 25 position maximum, and identify a stock that is THAT DAY on the top % gainers list that also meets my particular criteria.
So even if I wanted to add VCA Antech today if I had a sale that permitted me to expand my portfolio, if VCA Antech was not on the top % list that day....well I wouldn't be 'able' to pick it. Sounds terribly limiting and arbitrary doesn't it? But it seems to work.
This technique forces me to look at new names all the time. Instead of limiting my choices to stocks I am familiar with, I am continuously scanning the top % gainers list and reviewing the Morningstar.com facts and figures. However, if I am indeed interested in re-establishing a position in WOOF, then it is likely that the 'stars will all be aligned' and it will happen :). I hope.
I personally follow the market by listening to CNBC and watching CNBC when I get a chance, read the Investors Business Daily on occasion, and the business section from the NYTimes. I also like to scan through the stories on Marketwatch, I love to read Kiplinger's, Money Magazine, Fortune, Forbes, Smart Money, and rarely will pick up a copy of the Wall Street Journal.
But the temperature of the market is of relatively little importance to my trading strategy which depends on the activity within my own portfolio to determine my own actions.
I hope that my idiosyncratic methods are not too difficult to understand. However, they certainly aren't likely to be the best way to do things. They are just the way that I have found that has been working for me! Let me know how you have chosen to manage your own portfolio when you get a chance!
In fact if any of you have actually employed any of my strategies I discuss here, I would love to hear from you and hear how you have used them, improved upon them, and whether they have facilitated your success or have been unsuccessful for you.
Bob
Sunday, 25 March 2007
ResMed (RMD) "Weekend Trading Portfolio Analysis"

RESMED (RMD) IS RATED A BUY
Hello Friends! Thanks so much for stopping by and visiting my blog, Stock Picks Bob's Advice! As always, please remember that I am an amateur investor, so please remember to consult with your professional investment advisers prior to making any investment decisions based on information on this website.
 One of the things I like to do on this blog is to share with you my actual holdings in my Trading Portfolio, my actual trades, and the results of such activity. I started this a bit over a year ago, realizing that I hadn't been keeping you all posted as well as I should on what my actual stocks I own have been doing, and how I have been managing with them.
Two weeks ago I wrote up my Quality Systems (QSII) holding. Going alphabetically, I am up to ResMed (RMD) and shall try to update you on this position. I had some interesting comments on that entry and they were not entirely without merit. I should point out that all sales that I make have negative consequences of both the cost of the transactions (I use a discount broker but that is really necessary if you are going to make the many transactions that I make) and you also are going to incur tax consequences.
Furthermore, I write this blog not trying to assert that this is the only way, or even the best way to invest. I write this as my own personal journey through the investing world, sharing with all of you my thoughts and perspectives on investing. There are many other smarter minds out there, there are other approaches to identifying stocks and averaging up on stocks or whatever. This is merely my diary of my own technique, a technique that I have adopted after reading of many other approaches and experimenting in a mostly 'seat-of-the-pants' system of investing. My disciplined approach has been working well for me. I hope that all of you are able to learn from my successes and failures and utilize as many of my techniques as you find profitable.
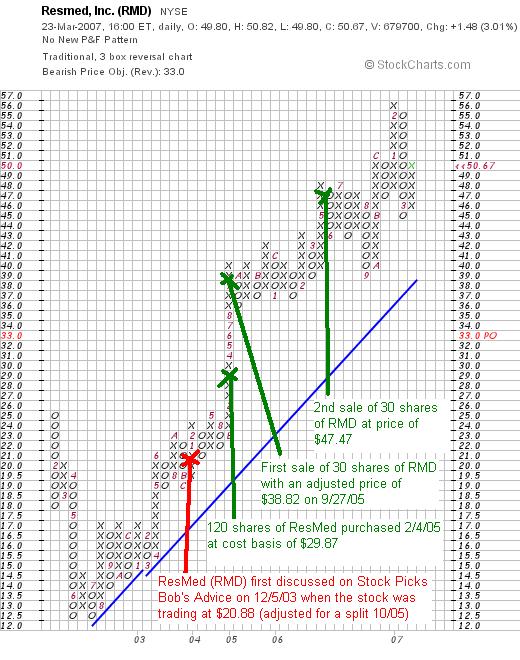
I first discussed ResMed on Stock Picks Bob's Advice on December 5, 2003, when the stock was trading at $41.76/share. This represents a price of $20.88 adjusted for the 2:1 stock split in October, 2005.
I currently own 150 shares of ResMed (RMD) that were acquired 2/4/05, at a cost basis of $29.87/share. My original purchase was reported on Stock Picks on the same day, February 4, 2005, as 120 shares purchased at $59.67. RMD had a 2:1 stock split on October 3, 2005, making my effective stock purchase price actually $29.87.
ResMed closed at $50.67 on March 23, 2007, giving me an unrealized gain on these remaining shares (I have sold portions of my holding as the stock has appreciated) of $20.80 or 69.6% on my current holding. My over-all performance with this stock is lower, because I have taken smaller gains, at both 30% and 60% levels on portions of my original purchase.
In fact, I sold 30 shares of my original holding (using my original strategy of selling 1/4th of my remaining shares at targeted appreciation points) on 9/27/05 at a price of $76.09/share, representing a gain of $16.42 or 27.5%, leaving me 90 shares before the 2:1 stock split. Then of my 180 shares, I sold another 30 shares of RMD on 5/5/06 at a price of $47.47, representing a gain of $17.60 or 58.9% above my original cost.
Going forward, my planned next sale would be 1/6th of my 150 shares or 25 shares at a 90% appreciation point or 1.90 x $29.87 = $56.75. On the downside, I plan on selling all of my remaining shares if the stock should trace back to a 30% appreciation point (1/2 of my highest sale point of 60%) or 1.30 x $29.87 = $38.31/share.
So can I calculate what my actual return has been (still not taking into consideration tax issues) on both my realized and unrealized holdings? To summarize, I purchased 120 shares of ResMed at $59.67 = $7,160.40. I have sold two portions of this stock, 30 shares in 9/27/05 with proceeds of $2,329.25 (price of $38.82 adjusted for the 10/05 2:1 split), and 30 shares 5/5/06 with proceeds of $1,424.20 (price of $47.47), giving a sum of $3,753.45 of sales. I have 150 shares remaining of RMD and with Friday's closing price of $50.67, that means I still have $7,600.50 of stock left. Thus if I add together the $3,753.45 with the $7,600.50 = $11,353.95. This represents a gain of $11,353.95/$7,160.40 = 1.586 or 59% appreciation on my original purchase. This is less than the 69.64% appreciation on the remaining shares but reflects the shares already sold and is fairly close to that figure as well!
I hope this more clearly reflects my selling strategy for this stock. I want things to be as transparent as possible with all of my discussions. I am not trying to overstate my performance which I believe stands on its own just fine!
Let's take a little closer look at ResMed and see if it still deserves a spot on the blog.
What exactly does this company do?
According to the Yahoo "Profile" on ResMed (RMD), the company
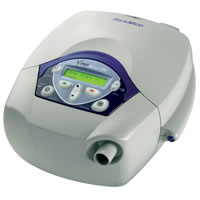 "...engages in the development, manufacture, and marketing of products for the screening, treatment, and long-term management of sleep-disordered breathing and other respiratory disorders. It offers medical equipment for sleep-disordered breathing (SDB), which includes obstructive sleep apnea (OSA) and other respiratory disorders that occur during sleep. The company�s products include airflow generators; diagnostic products; mask systems; headgear; and other accessories, including humidifiers, cold passover humidifiers, carry bags, breathing circuits, Twister remote, the Aero-Click connection system, and the AeroFix headgear."
How did they do in the latest quarter?
On February 6, 2007, ResMed announced 2nd quarter results. For the quarter ended December 31, 2006, revenue came in at $178.4 million, up 22% over the same quarter ended December 31, 2005. Net income was $29.0 million, up from $22.3 million last year, and diluted earnings per share came in at $.37/share, up from $.30/share the prior year.
The company came in a little light on revenue as analysts expectations were for revenue of $182 million.
How about longer-term financial results?
Reviewing the Morningstar.com "5-Yr Restated" financials on ResMed, we can see the beautiful progression in revenue from $204.1 million in 2002 to $607 million in 2006 and $675.5 million in the trailing twelve months (TTM).
Earnings have also steadily increased from $.55/share in 2002 to $1.16/share in 2006 and $1.32/share in the TTM. During this time, while revenue has been up over 200% and earnings have climbed about 100%, the number of shares outstanding has grown just a little over 20% from 64 million to 77 million in the TTM. This is an acceptable dilution of shares from my perspective. No dividends are paid.
Free cash flow has been a little erratic with $19 million in 2004, growing to $31 million in 2005, then falling to a negative $(4) million in 2006, but rebounding to a nice $27 million in the TTM.
The balance sheet is solid with $254.6 million in cash and $336.3 million in other current assets. This total of $590.9 million can easily cover both the $163.7 million in current liabilities as well as the $117.9 million in long-term liabilities combined. Looking just at the current ratio, comparing the total current assets of $590.9 million to the $163.7 million in current liabilities yields a very strong ratio of 3.61. (Generally I consider current ratios of 1.25 or higher as being 'healthy' all things considered.)
What about some valuation numbers?
Examining the Yahoo "Key Statistics" on RMD, we find that this is a mid-cap stock with a market capitalization of $3.89 billion. The trailing p/e is a bit rich at 38.18, with a forward p/e (fye 30-Jun-08) estimated at 25.72. The growth is expected to be vigorous going forward with a PEG (5 yr expected) estimated at 1.46. (PEG's of 1.0 to 1.5 are reasonable from my perspective.)
According to the Fidelity.com eresearch website on RMD, the Price/Sales (TTM) for RMD is a very reasonable 5.65 relative to the industry average of 30.09. Again, according to Fidelity, the Return on Equity (TTM) is just a bit under the industry average of 15.87%, with RMD coming in at 13.64%.
Finishing up with Yahoo, we find that there are 76.80 million shares outstanding with 74.38 million that float. Currently, there is a bit of a significant short interest on this stock with a short ratio of 5.3 trading days or 4.8% of the float. I generally use 3 days for my own idiosyncratic cut-off for significance. If the company continues to report good news, these short-sellers may well be 'squeezed' as they scramble to cover their 'shorts' buy buying shares on the open market. This could add to any price rise if such good news is forthcoming.
No dividend is paid, and as I noted above, the last stock split was a 2:1 split on October 3, 2005.
What does the chart look like?
If we review the "Point & Figure" chart on ResMed from StockCharts.com above, I think we can see that except for technical weakness back in January, 2002, through July, 2002, when the stock declined from $25 to a low of $12.50, the stock has been on a 'tear' with steady price appreciation the past four or five years. This has been a very strong stock and a strong chart to match!
Conclusion: What do I think?
Well, I still like this stock a lot. In fact, I own shares in this stock! And you should certainly take that into consideration. I don't talk much about my own personal life, but I can tell you that I personally use one of these CPAP machines and have slept better (when I am not blogging!) and have let my wife sleep better as well! The stock itself has been kind to me and represents the kind of stock I believe belongs in my portfolio.
The last quarter was solid. The past five years have been terrific. Valuation is a bit rich but with the steady performance of this stock, may well be worth the premium.
Thanks so much for stopping by and visiting! If you have any comments or questions, please feel free to leave them on the blog or email me at bobsadviceforstocks@lycos.com. If you get a chance, be sure and visit my Stock Picks Podcast Website. Hopefully, I shall also get a chance to write up and report on a new stock on the Podcast this week!
Bob
Posted by bobsadviceforstocks at 10:52 PM CDT
|
Post Comment |
Permalink
Updated: Tuesday, 27 March 2007 3:20 PM CDT
Newer | Latest | Older


