Stock Picks Bob's Advice
Sunday, 18 July 2010
Dr Pepper Snapple Group (DPS)
Hello Friends! Thanks so much for stopping by and visiting my blog, Stock Picks Bob's Advice! As always, please remember that I am an amateur investor so please remember to consult with your professional investment advisers prior to making any investment decisions based on information on this website.
 We have been having a heat wave in Boston, Southern California, in fact much of the United States, including New York City, as well as overseas in London, and across Russia. Putting it plainly, it has been a hot summer for many across the globe.
It is this hot weather and a bit of a sunburn today after doing a bit of bike-riding that leads me to think about Snapple, and in particular the Dr Pepper Snapple Group (DPS). I do not have any shares of this company but believe it is the kind of stock I would like to be owning! DPS closed at $38.25 on July 16, 2010, down $(.73) or (1.87)% on the day as the market sold off rather severely with the Dow closing at 10,097.50 down 261.41 or (2.52)% on the day. Full disclosure: Diet Peach Tea by Snapple is one of my favorite drinks!
 According to the Yahoo "Profile" on Dr Pepper Snapple Group (DPS), the company
"...operates as a brand owner, manufacturer, and distributor of non-alcoholic beverages in the United States, Canada, Mexico, and the Caribbean. It offers flavored carbonated soft drinks (CSDs) and non-carbonated beverages (NCBs), including ready-to-drink teas, juices, juice drinks, and mixers. The company offers its CSD products primarily under the Dr Pepper, Sunkist soda, 7UP, A&W, Canada Dry, Crush, Schweppes, Squirt, RC Cola, Diet Rite, Sundrop, Welch’s, Vernors, Country Time, IBC, Mistic, and Venom Energy brand names; and NCB products principally under the Snapple, Mott’s, Hawaiian Punch, Clamato, Yoo-Hoo, Country Time, Nantucket Nectars, ReaLemon, Mr and Mrs T, Rose’s, and Margaritaville brand names."
Snapple has a fascinating history beyond its recent association with Quaker Oats and with Dr Pepper:
"Snapple was founded in 1972 by Arnold Greenberg, Leonard Marsh, and Hyman Golden. Greenberg operated a health food store on the lower east side of Manhattan. His boyhood friend Marsh ran a window-washing service with his brother-in-law, Golden. In the early 1970s, the three founded Unadulterated Food Products, Inc., to sell pure fruit juices in unusual blends to health food stores. Products were bottled at a small plant in the New York metropolitan area. The partners ran the business in their spare time while all three kept their regular jobs, and the enterprise plodded along until the late 1970s.
In 1978, Unadulterated Foods began to market carbonated apple juice. The company called the product "Snapple," after purchasing the name for $500."
Dr Pepper Snapple Group (DPS) is a very young company:
"The company was established in 2008 following the spin-off of Cadbury Schweppes Americas Beverages (CSAB) from Cadbury Schweppes plc. On May 7, 2008, DPS became a publicly traded company listed on the New York Stock Exchange."
Snapple became part of Cadbury Schweppes in 2000 after it was purchased from Triarc Group which had acquired Snapple back in 1997.
In any case, in a Peter Lynch fashion, I like their tea and their financial results are attractive. On May 6, 2010, DPS announced 1st quarter results that were a bit less than stellar. Earnings came in at $89 million or $.35/share down from $132 million or $.52/share last year. Excluding one-time charges, the company earned $.40/share, which while behind last year's $.52 result, came in ahead of the $.32/share expected by analysts.
Revenue for the quarter dipped to $1.25 billion from $1.26 billion last year under the $1.28 billion expected by analysts. The company maintained sales guidance for the year with DPS expected to grow sales by 3-5% for the year. In addition, they raised earnings guidance to a new range of $2.29 to $2.37/share, up from prior guidance of $2.27 to $2.35. While reporting a mixed earnings report, the outlook was decidedly upbeat and the stock price has performed well since that report.
 Watching my weight (without much success) I also enjoy an occasional Diet Dr. Pepper (for full disclosure!)
If we review the Morningstar Income Statement on Dr Pepper Snapple Group Inc. (DPS), we can see that revenue has grown steadily from 2005 to 2007 from $3.2 billion to $5.7 billion. In 2008 this dipped to $5.7 billion and the company has reported $5.5 billion in the trailing twelve months (TTM).
Earnings dipped from $2.01 in 2006 to a loss of $(1.23) in 2008 and has come in at $2.17/share in the TTM.
Outstanding shares have been stable with 254 million reported in 2006 and 255 million in the TTM.
According to the Morningstar Balance Sheet, the company has $1.28 billion in current assets including $280 million in cash and has total current liabilities of $854 million, yielding a current ratio of nearly 1.5.
Looking at the Morningstar Cash Flow page, we can see that free cash flowhas improved from $373 million in 2007 to $405 million in 2008 and $548 million in 2009.
Some recent news stories affecting the company include an announcement on July 13, 2010, that the board approved a $1 billion buyback of shares to be completed over the next three years. In another positive development for the company, the Coca-Cola Co. (KO) announced on June 7, 2010, that they would be paying $715 million to the Dr Pepper Snapple Groups for rights to distribute Dr Pepper and Canada Dry in United States. They also will be distributing Canada Dr., C Plus, and Schweppes in Canada. Another bullish announcement was made on May 19, 2010, when the company announced a 67% increase in the dividend to $.25/share or $1.00/share on an annual basis.
Examining the Yahoo "Key Statistics" on DPS, we can see that this is a larger 'mid cap stock' with a market capitalization of $9.4 billion. The trailing p/e is a moderate 19.08 with a forward p/e of 13.66 (fye Dec 31, 2011). Thus, the PEG is reasonably valued at 1.37.
Other valuation numbers include the Price/Sales ratio (TTM) which comes in at 1.75, below the industry average of 2.62 according to the Fidelity.com eresearch website. However, profit margins which include Return on Sales (TTM) come in at 9.28% under the industry average of 14.96%. Similarly return on investment comes in at 7.28% below the industry average of 17.06%.
Yahoo reports that as of June 30, 2010, there were 6.25 million shares out short representing only 1.7 trading days, well below my own arbitrary 3 day rule for short interest. As noted above, the company pays a forward dividend of $1.00/share yielding a not-insignificant 2.60%. The company has a payout ratio of only 15%.
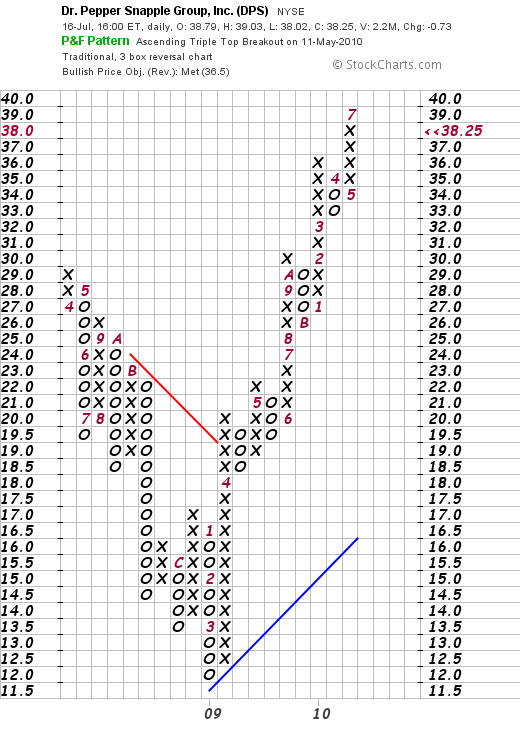
Reviewing the StockCharts.com 'point & figure' chart on Dr Pepper Snapple Group (DPS) we can see that after coming public in April, 2008, the stock peaked at $29 before slipping to a low of $12.00 in March, 2009. Since then the stock has been quite strong hitting a recent high this month at $39/share. Overall the chart looks quite strong if a bit extended.
To summarize, in the heat of this summer with the market acting quite cold, I would like to share with you a cold drink and a warm investment :). Dr Pepper Snapple Group (DPS) is a relatively new company with a stable of beverage products well established in the market. While their latest quarterly report was still showing the effects of the recession, the company guided earnings higher, maintained revenue growth expectations, and recently sharply increased the dividend and announced a three year $1 billion stock buy-back.
I do not own any shares and still limit my new position purchases from signals generated by my own portfolio as it reaches selling points on gains. These signals do not appear to be imminent but DPS is the kind of investment that deserves to be on your tray, or should I say an investment that deserves to be consumed over ice?
Thanks again for stopping by and visiting my blog! If you have any comments or questions, please feel free to leave them right here on the blog or email me at bobsadviceforstocks@lycos.com.
Yours in investing,
Bob
Tuesday, 29 June 2010
Ecolab (ECL) "Trading Transparency"
Hello Friends! Thanks so much for stopping by and visiting my blog, Stock Picks Bob's Advice! As always, please remember that I am an amateur investor, so please remember to consult with your professional investment advisers.
 The stock market had a miserable day today. The Dow closed down 268 points or (2.65)%, the Nasdaq was worse with an 85 point or (3.85)% loss. Even the S&P was hit, closing at 1041, down 33 or (3.10)% on the day.
In the midst of this bloodbath, my Ecolab (ECL) stock, which I had recently purchased last month on 4/30/10 in my swith from Schlumberger (SLB), was made at a cost basis of $49.10. I sold all 65 of my shares today at $45.05/share, yielding me a loss of $(4.05) or (8.2)% since purchase.
I did not sell this stock because of any particular fundamental piece of information that disturbed me. I like this company and would prefer to be a shareholder of its shares.
However, my own trading system demands of me to sell shares in companies in which I have made an initial purchase when they have declined (8)% since that purchase. That is exactly what happened to my Ecolab (ECL) shares.
It is also not surprising that this holding was a recent purchase.
It makes sense that the positions that would be 'undone' first would be the recent purchases that are most vulnerable to a downdraft in the market.
One of my goals in pursuing this blog and putting my own real holdings, my successes and failures out publicly is to test whether one can reall do what I am striving to do. I am working to minimize my losses both individually by selling stocks quickly should they decline and also to utilize that sale as an indicator in itself that something is rotten with the market. Thus the proceeds of this sale are remaining in cash.
My cash position is approximately 40% now. I didn't do this on purpose. It wasn't a stroke of genius. It was my own strategy of selling holdings on declines and putting the proceeds in cash. I am avoiding reinvesting these sales on losses so I shall not make a bigger mistake and compound these losses with additional sales on losses.
I shall be waiting for a sale on a gain to be adding a new holding. This may be awhile. Meanwhile, I shall be patient. Monitor my own holdings and am prepared to unload additional stocks until I am at my minimum of 5 holdings. Even then, I shall not tolerate losses but rather shall sell these at 8% declines, replacing them as well with new positions (because I need 5 holdings) but am planning to do this with even smaller in size positions as I work to reduce my exposure to equities as indicated by my own sales.
Thank you again for stopping by and visiting. I hope that my explanation is comprehensible for you. If not, please let me explain more. You can leave your questions or comments right here on the blog or contact me at bobsadviceforstocks@lycos.com.
Yours in investing,
Bob
Sunday, 27 June 2010
PetSmart (PETM) Podcast
Hello Friends! Thanks so much for stopping by and visiting my blog, Stock Picks Bob's Advice! As always, please remember that I am an amateur investor, so please remember to consult with your professional investment advisers prior to making any investment decisions.
Click HERE to get to my Podomatic Podcast page to listen to my podcast on PetSmart (PETM).
Thanks again for stopping by! If you have any comments or questions, please feel free to leave them here or drop me a line at bobsadviceforstocks@lycos.com.
Yours in investing,
Bob
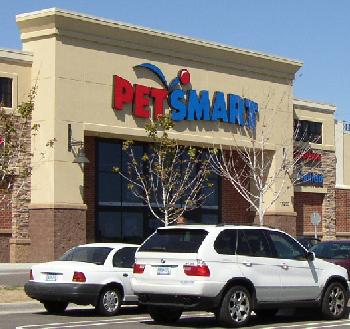
PetSmart Inc. (PETM) "Revisiting a Stock Pick"
Hello Friends! Thanks so much for stopping by and visiting my blog, Stock Picks Bob's Advice! As always, please remember that I am an amateur investor, so please remember to consult with your professional investment advisers prior to making any investment decisions based on information on this website.
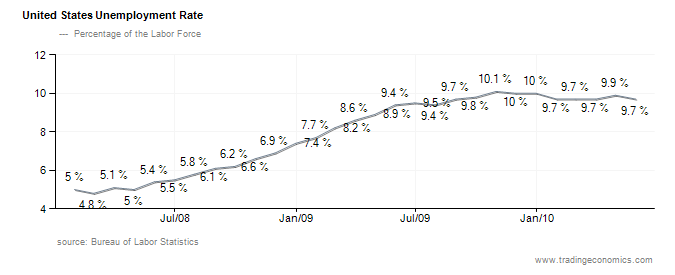
 The United States economy remains stuck in a slow recovery from a deep recession. Latest figures suggest that the first quarter resulted in a 2.7% growth rate, slightly under the 3% expected.
Meanwhile, the United States Unemployment rate remains mired just under 10% with 9.7% unemployed as of May, 2010. As the following chart reveals, while the deterioration in unemployment has stabilized, the United States has not yet convincingly turned the corner in reducing unemployment.
In the midst of this, Democrats in the Senate failed to get through any extension of unemployment benefits in a bill that also would provide federal aid to cash-strapped states and raise taxes on executives of buyout firms.
Republicans are concerned about the ever-growing national debt which just topped $13 Trillion. Democrats, however, argue that the time for dealing with debt is in times of expansion, and that the current economic environment requires expansionary fiscal policy. Republicans have built their recent rebound on Americans distrust of Keynesian economic theory that advocates government spending in times of economic weakness. As this poll suggests, most Americans believe we should be concerned about our debt even as our nation is mired in a recession.
It is in this environment that stock-picking is difficult at best. I remain committed to identifying the highest quality companies which show persistence in growth both in terms of revenue and earnings, and are also able to operate in a financially sound fashion.
There is some evidence that the pet industry may be a recession-resistant sector. PetSmart (PETM) is an important player in this field. I last reviewed PetSmart on May 21, 2009, when the stock was trading at $20.35/share. PetSmart (PETM) closed at $30.91 on June 25, 2010, for a gain of $10.56 or 51.9% since my write-up last year. Unfortunately, I no longer own any shares but do believe this is a stock that belongs in my blog and should be considered for my own portfolio.
Let's take another look at some of the things that keep me interested in this company!
 According to the Yahoo "Profile" on PetSmart, the company
"... together with its subsidiaries, operates as a specialty retailer of products, services, and solutions for pets in North America."
and
"As of March 25, 2010, it operated 1,149 retail stores; and 162 PetsHotels. Additionally, the company operated 740 hospitals under the registered trade names of Banfield and The Pet Hospital; and had 12 hospitals, which are operated by other third parties in Canada."
In terms of news, the company announced last week (6/22/10) two actions that should be considered 'bullish' for the company stock price. PETM announced that the quarterly dividend would be increased 25% to $.125/share. In addition, the company also announced a new $400 million share repurchase program to replace its current $350 million buyback.
On May 26, 2010, PetSmart announced 1st quarter results. First quarter earnings came in at $44.6 million, or $.46/share for the quarter, ahead of last year's $46.3 million or $.37/share. This exceeded analysts' expectations of $.43/share. Revenue came in at $1.4 billion, slightly ahead of analysts' expectations of $1.38 billion. As I like to see, PETM management also raised guidance for the full year to $1.82 to $1.92/share, ahead of current guidance of $1.73 to $1.83/share. Beating expectations and raising guidance are bullish indicators for a stock price.
The company was impacted by currency fluctuations with net sales positively boosted by $12 million. During the quarter, same-store sales growth was reported at 2.8%.
Reviewing the Morningstar.com "5-Yr Restated" financials on PetSmart, we can see that revenue growth steadily climbed from $3.76 billion in 2006 to $5.34 billion in 2010 with $5.4 billion reported in the trailing twelve months (TTM). Earnings, however, increased from $1.25/share in 2006 to a peak of $1.95/share in 2008, dipped to $1.52/share in 2009, increased to $1.59 in 2010 and $1.69 in the TTM as the company recovered its earnings growth.
The company pays a dividend and increased it from $.12/share in 2008 to $.33/share in 2010 and again to $.40/share in the TTM. With the quarterly increase to $.125/share noted above, the current dividend rate is at $.50/share. Outstanding shares have been decreasing recently from 146 million in 2006 to 125 million in 2010 and 123 million in the TTM.
Free cash flow is solidly positive, increasing from $38 million in 2008 to $454 million in 2010 with a slight decrease to $373 million in the TTM.
The balance sheet looks solid with $242 million in cash reported and $788 million in other current assets. This compares with $537.8 million in current liabilities yielding a 'current ratio' of 1.92.

(Image from article on 'The pet economy')
In terms of valuation, checking the Yahoo "Key Statistics" on PetSmart, we find that the company is a mid-cap stock with a market capitalization of $3.66 billion.
Yahoo reports the company with a trailing p/e of 18.33, with a forward p/e (fye Jan 31, 2012) estimated at 14.18. With the rapid growth in earnings predicted, this somewhat rich p/e is more reasonable in light of this growth with a PEG (5 yr expected) of 1.19, within my own range of 1.0-1.5 for 'value'. According to the Fidelity eresearch website, the company has a Price/Sales (TTM) ratio of 0.70, well under the industry average of 0.85. Its Return on Sales (TTM) at 3.84% is under the industry average of 5.37%, also its Return on Investment (TTM) of 11.83% also is a bit below the industry average of 15.41%.
According to Yahoo, there are 118.33 million shares outstanding with 117.07 million that float. 5.84 million shares are reported out short as of 6/15/10, with a short ratio of 3.60 slightly ahead of my own arbitrary 3 day rule of significance. (Higher short positions might be considered bullish.)
As I noted above, the company has a forward dividend yield of 1.60% based on a forward dividend rate of $.50/share annually. The last stock split was a 2:1 split back in July, 1996.
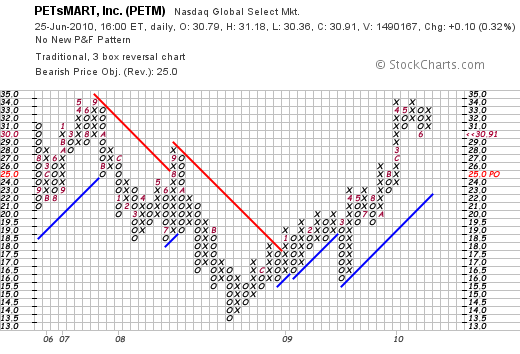
Reviewing the 'point & figure' chart on PETM from StockCharts.com, we can see that this stock bottomed back in August, 2008 at $13/share. Since then, except for a slight setback in March, 2009, the stock has shown remarkable strength as it currently trades above support lines just below the recent highs in the $34 range.
 OK maybe I do have a soft spot for animals. (This is a picture of my cat Rahmmy, who was named Mickey, when I picked him up at PetSmart! He was a cat from the Coulee Region Humane Society and couldn't be better! (except when he's naughty.) ). But seriously, PetSmart, a stock that I have owned in the past and have also reviewed deserves consideration.
They have recently raised their dividend, announced an expanded stock buy-back, and reported earnings which exceeded expectations and raised guidance for the full year. Their long-term financial record is excellent if not perfect, and their chart looks quite strong.
Now, if only the general economy would cooperate a bit!
Thank you for stopping by and visiting my blog. Please feel free to leave any comments or questions right here on the blog or email me at bobsadviceforstocks@lycos.com.
Yours in invesiting,
Bob
Posted by bobsadviceforstocks at 3:34 PM CDT
|
Post Comment |
Permalink
Updated: Sunday, 27 June 2010 9:29 PM CDT
Saturday, 12 June 2010
Johnson Controls (JCI) "Revisiting a Stock Pick"
Hello Friends! Thanks so much for stopping by and visiting my blog, Stock Picks Bob's Advice! As always, please remember that I am an amateur investor, so please remember to consult with your professional investment advisers prior to making any investment decisions based on information on this website.
 One of the last things I did in my portfolio was to unload shares of Schlumberger (SLB) on April 30, 2010, at $71.87 and purchase shares of Ecolab (ECL) at $48.98. I did so in the face of the Deepwater Horizon Gulf of Mexico oil spill which occurred on April 20, 2010. Both shares have been relatively weak but Schlumberger, an oil service contractor has been hit hard and closed June 11, 2010, at $59.48, down more than $12 or (17.2)% since my own sale. Ecolab (ECL) closed at $46.44 on June 11, 2010, giving me a loss of $(2.54) or (5.2)% since my purchase reflecting more the market's decline in May rather than any particular bias against the industry that SLB has been facing.
In the same fashion, I do believe that the tragic oil spill that is continue to pour raw petroleum into the Gulf of Mexico shall have effects that extend beyond the directly affected states into policy being developed in Washington D.C. and likely in other capitols around the globe. Much like Three Mile Island had a terribly chilling effect on nuclear power in America, so shall the Gulf oil spill result in changes in energy policy in the United States.
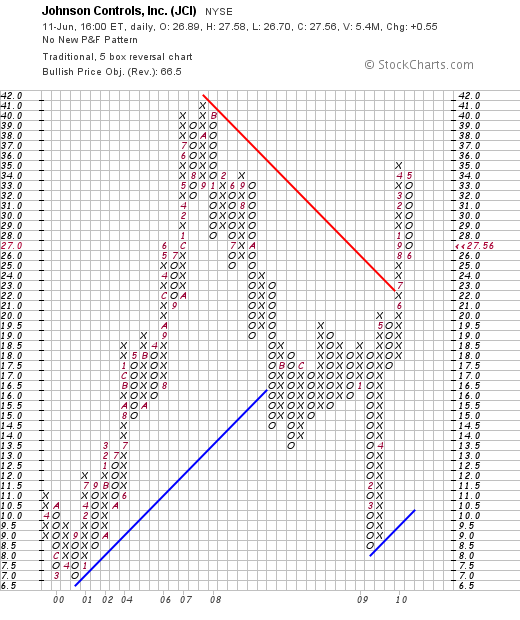
Johnson Controls (JCI) may ultimately benefit from the changes in energy utilization in America and around the world. I first wrote up this Wisconsin-based firm on July 9, 2004, when the stock was trading at $53.24. With the 3:1 stock split on October 3, 2007, this gives this pick an effective cost of nearly $18 per share. JCI closed on June 11, 2010, at $27.56.
I again revisited Johnson Controls (JCI) on October 12, 2005, when the stock was trading at $63.60 ($21.20 adjusted for the split). On October 10, 2006, I wrote up Johnson Controls (JCI) a third time on October 10, 2006, when the stock was trading at $81 ($27 adjusted for the subsequent split). Since that time I have briefly owned shares of the stock but at this time do not own any shares of Johnson Controls (JCI).
Let's take another look at this company and I shall share with you why I believe it is still an interesting stock and one that deserves a spot in my blog as well as probably a position in my own trading account in the future!
Johnson Controls (JCI) operates in three main businesses. According to the Yahoo "Profile" on the company, it
"...operates in building efficiency, automotive experience, and power solutions businesses worldwide."
Weakness in both the building industry as well as the automotive industry resulted in considerable weakness in the stock price. However, both of these areas appear to be bottoming and starting a slow recovery. This recent article points out signs of a recovery in building in the recession-laden Southern California market. Similarly the auto industry is showing signs of life and recent numbers continued the '8 straight month' of auto sales increases.
Johnson Controls (JCI) recently launched an unsuccessful bid for auto parts supplier Visteon (VSTNQ.PK) for $1.25 billion. Visteon has been a parts supplier for Ford (F). That bid was rejected but reflects JCI's ambitious effort to grow their business in the midst of the weak environment. JCI also spent $6.08 million recently to purchase a 3.4% interest in Azure Dynamics Corp., a Michigan supplier to hybrid vehicle market, a growing alternative to the internal combustion driven vehicles we are all have grown up with.
In the lastest quarterly financial report issued by Johnson Controls (JCI), they reported that their fiscal 2nd quarter flipped from a loss the prior year of $269 million to a profit of $274 million. This worked out to $.40/share this year vs. $(.33)/share the prior year. They managed to exceed analysts' expectations according to Thomson Reuters of $.39/share. Revenue also climbed 32% year-over-year to $8.32 billion, also exceeding analysts expectations of $7.92 billion in sales. Adding some additional bullish sentiment to the announcement, the company raised guidance on 2010 earnings to a range of $1.90 to $1.95/share, compared to prior guidance of $1.70 to $1.70/share on revenue of $33.5 billion.
Reviewing the Morningstar.com "5-Yr Restated" financials on JCI, we can see that from 2003 until 2008, revenue climbed from $27.5 billion to $38.1 billion. Revenue dipped in 2009 to $28.5 billion before climbing back to $31.6 billion in the trailing twelve months.
Earnings climbed from $1.56/share in 2005 to $2.09/share in 2007 before dipping down to $1.63/share in 2008 and a loss of $(.57)/share in 2009. The company has earned $1.71/share in the trailing twelve months.
The company increased its dividend from $.33/share in 2005 to $.52/share in 2008 and has kept it at that level since then. Outstanding shares have fluctuated with 583 million reported in 2005, increasing to 601 million in 2008. They dipped to 593 million in 2009 and have again increased to 637 million in the TTM.
Free cash flow has remained positive even with the dip in business, declining from $1.09 billion in 2007 to $270 million in 2009 but has increased to $1.5 billion in the TTM.
The balance sheet remains solid with JCI having $770 million in cash and $9.1 billion in other current assets, plenty to cover the $8.8 billion in current liabilities with another $5.6 billion of long-term liabilities reported by Morningstar.
In terms of valuation, reviewing the Yahoo "Key Statistics" on Johnson Controls, we can see that this is a large cap stock with a market capitalization of $18.54 billion. The company has a trailing p/e of $16.15 with a forward p/e (fye Sep 30, 2011) estimated at 11.39. With the rapid growth expected, the PEG ratio works out to a dirt cheap level of 0.49.
Yahoo reports 672.7 million shares outstanding with 622 million of them that float. As of 5/28/10, there were 7.01 million shares out short representing a short ratio of only 1.00.
Currently, the stock has a forward estimated dividend of $.52/share yielding 1.9%. This dividend is well covered with a payout ratio of only 31%. As I noted above, the company last split its stock with a 3:1 split back on October 3, 2007.
Looking at a 'point & figure' chart from StockCharts.com, we can see how the previous peak in the stock price was at $41/share back in October, 2006. The stock recently bottomed at $8.50/share back in March, 2009, has subsequently rallied out of that low through 2009 and now has broken through resistance levels in the $21 range. The stock, while correcting currently, still appears to be bullishly poised for further appreciation.
To summarize, Johnson Controls (JCI) appears to be a timely stock pick based on a changing economy with recovery in building, automotive interiors as well as a growing participation by JCI into the hybrid market with their own growing electric battery business. Furthermore, conservation is likely to be a growing concern with the ever-present understanding of making our energy dollars go further while conserving precious resources and our environment.
Thanks again for stopping by and visiting! If you have any comments or questions, please feel free to leave them on the blog or email me at bobsadviceforstocks@lycos.com.
Yours in investing,
Bob
Tuesday, 25 May 2010
Johnson & Johnson (JNJ) "Trading Transparency" and a Birthday Greeting
Hello Friends! Thanks so much for stopping by and visiting my blog, Stock Picks Bob's Advice! As always, please remember that I am an amateur investor, so please remember to consult with your professional investment advisers prior to making any investment decisions based on information on this website.
 Earlier today with the market declining sharply my 50 shares of Johnson & Johnson (JNJ) hit an 8% loss for me and triggered a sale of the entire position. I purchased these shares 12/28/09 at a cost basis of $65.15/share. I sold this position when the stock hit $59.64 representing a loss of $(5.51) or (8.46)% from my purchase price.
This sale is not based on my own like or dislike of Johnson & Johnson (JNJ) shares. It simply represents a part of my own trading discipline which requires me to part with shares that incur an 8% loss after an initial purchase. This is exactly what happened to JNJ and the shares were shold. Frankly, I would hope that I shall have another opportunity to own shares in this fine blue chip in the future. Meanwhile the funds are moved to cash.
Since this sale is on a decline in a holding and not a partial sale at a gain, this generates a signal, which is a 'bad news' signal requiring me to leave the proceeds of this sale in cash. As with the rest of the market, JNJ did rebound at the close closing at $60.35, down $(.22) or (.36)% on the day.
 On a lighter note, I should share with you the fact that this blog passed its seventh birthday and I am now going on to my 8th year blogging hear at Stock Picks Bob's Advice! Thank you all for stopping by and reading my amateur commentary on the stock market and my own attempt at dealing with the vagaries of investing in some sort of rational fashion.
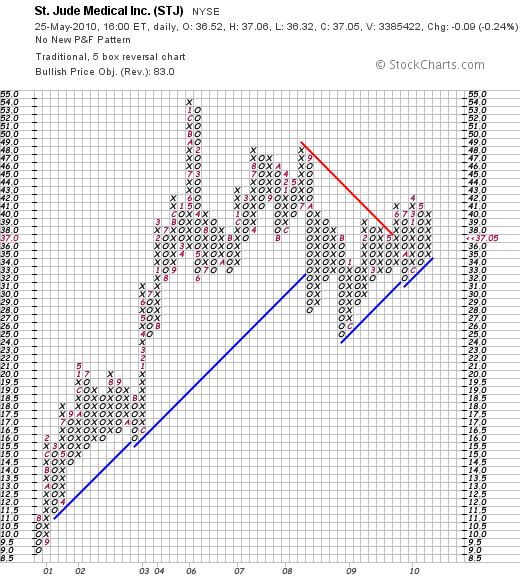
On May 12, 2003, I posted an entry on St Jude Medical (STJ) when the stock was trading at $53.30.
This is what I wrote:
May 12, 2003 St Jude Medical
This is one I picked up today. STJ is the stock symbol. I do not as I write and publish this own any shares. Am thinking about suggesting this to my stock club. Company had a great day today with a nice move on the upside. Last Quarter was good and the past five years have been steady growth. Closed at $55.30 up $2.92. So the daily momentum helped it make the list.
For reference, St Jude Medical (STJ) closed today (5/25/10) at a price of $37.05. St Jude split its stock 2:1 on November 23, 2004, making today's effective price $74.10, giving this pick a gain of $18.80 or 34% which isn't a shabby return in the difficult market we have all faced since 2003.
Since May 12, 2003, I have posted 1,994 entries discussing stocks, answering letters, commenting on my own trades, and making friends with all of you.
Probably my greatest honor has been to be recognized by ValueWiki as one of the 10 Great Finance Blogs Flying Under the Radar. You might enjoy reading Jon and Zach's review!
Later I was invited to participate over at SocialPicks and then on Covestor.com where I posted my actual trading portfolio. Covestor has been kind enough to invite me to become one of their model managers and I have been a participant over at Covestor Investment Management since they launched it with just 10 models. They are now up to 64 and I find myself rubbing elbows with some very prestigious investors and analysts over at that site.
Seeking Alpha has invited me to be a participant on their terrific website and they have been reposting my articles there for the last couple of years. Here is my profile page for your review! So many exciting things for this amateur investor and writer. I am very thankful.
Occasionally, I have made the time to put out an amateur podcast over at Podomatic.com. You are more than welcome to peruse those shows at well. Here is my homepage for my podcast.
In other words, the seven years have gone quickly and I thank all of you here at Lycos where my blog originated, SocialPicks which chose to encourage me on their website, Covestor.com which asked me to share my own portfolio with a larger audience and Seeking Alpha which asked me to share my content with them.
You are all wonderful and all my friends!
I hope that these entries have been of interest to many of you, may have encouraged some of you to dabble in stocks and may also have been of solace to those of you who can see that I am also an amateur faced with the same questions of what, when, and how to deal with the fickle stock market.
Here's for another 7 years!
Yours in investing!
Bob
Sunday, 9 May 2010
Portfolio Management in Difficult Markets
Hello Friends! Thanks so much for stopping by and visiting my blog, Stock Picks Bob's Advice! As always, please remember that I am an amateur investor, so please remember to consult with your professional investment advisers prior to making any investment decisions based on information on this website.
It is easy looking 'smart' when the market is strong and any place you put your money you seem to have a Midas touch. It is entirely another matter in a turbulent or correcting market where it doesn't seem to matter what your investment is but that it declines along with the rest of the financial world.
So what is an investor to do? Can we as individuals possibly survive in this market of high frequency trades and sophisticated electronic trading strategies? Quite frankly, I do not know if the individual investor can survive a future with machines taking over many of the investment decisions for large investors and funds. But I do know that there are some what I believe to be common sense approaches to investing that can give all of us half a chance at surviving into the future.
These strategies include limiting your losses, locking in gains, knowing when to be in cash and when to be in equities, and selecting quality stocks. Many of these strategies include approaches that I have adapted, borrowed or copied from other successful investors and strategies that are rather unique to me, that I have developed over the years.
One of the biggest problems in investors' portfolios is their reluctance to take losses when they are small and manageable. For me, after an initial purchase, I allow a stock to decline only 8% prior to initiating a sale. This has been popularized by William O'Neil and the CANSLIM strategy. However, it is a difficult strategy to implement and I have often found myself selling stocks at this loss limit that I had only purchased days earlier.
Furthermore, if we are going to limit losses by selling them quickly and completely at small loss levels, it makes sense to me, and I have developed a strategy, to sell stocks as they gain and reach appreciation targets. These sales are of course partial sales. Initially I tried selling 1/4 of my holding as the stocks appreciated, but these sales were too aggressive and the remaining size of my holding dwindled instead of grew as the stock price increased. Currently I am selling 1/7th of my remaining shares as my holdings reach appreciation targets which I have set at 30%, 60, 90, and 120% levels. After that I increase the interval by 30% and sell at 180%, 240, 300, and 360%. Once again intervals increase ad nauseum and continue at 450% etc. At each of these appreciation targets I sell 1/7th of my remaining holding.
From this the question arises as to what to do if these stocks which have appreciated 30% or more decline? Should I wait until they dip to an 8% loss or sell sooner? I have chosen to move up these selling levels as follows: after a single sale of 1/7th of a holding at a 30% gain, I move up my selling point to break-even. After two or more sales at 60% or higher, I move up the selling point to 1/2 the highese % appreciation reached. Thus if a stock was sold 3 times at 30, 60, and 90%, then I would sell the entire position should it decline to a 45% appreciation level or lower.
Finally I use these sales either on the upside (partial sales) or downside (complete sales of positions) as 'signals'. My own portfolio becomes the canary in the coal mine, letting me know whether I should be expanding my exposure to equities or moving more into cash. I currently use a minimum of 5 positions and a maximum of 20. When I am between 5 and 20 my response if obvious. If I sell at an appreciation target, this represents "good news" and gives me a signal to add a new position. On the other hand, a sale on a declining stock is "bad news" and means I should not be adding a new position, instead transferring the funds into the cash side of the account.
At the extremes, I do not follow these rules. At 20 positions, when given a "buy signal", I do not add a new position, but plan on putting these funds into cash. However, at the minimum number of positions--5--when given a "bad news" signal, I buy another position anyhow as my entire strategy requires on me holding at least five stocks---consider them 5 canaries---that let me know what I should be doing.
To reduce my exposure to stocks at the minimum of five holdings, when adding a replacement, I determine the average size of my other four holdings and make the new fifth holding only 80% of the average $ amount of the other positions. Likewise, as I add new positions, I do not just size it to the average but rather at 125% of the average of the other holdings already in the account. In this fashion, I continue to respond to the vagaries of the market by adding exposure to equities or limiting that exposure.
Above all, in order to get into the account, a stock must past my own muster of good earnings reports, Morningstar.com '5-Yr Restated' evaluations, reasonable valuation and solid financial footing. I do this to the best of my ability as an amateur investor without interviewing anyone but by reviewing readily available public information.
Will this system work? I don't know. But it is better, at least for me, than sailing in the dark and 'shooting from the hip' as stocks become attractive or scary for me to be in them.
Most investors don't have a clue when they should be buying, how much they should be buying, when they should be selling, and when to get the heck out of Dodge. I at least have some guidance which is more or less unemotional and unrelenting. I shall continue to keep you posted and let you know how it is going. If any of you have adopted similar strategies, I would love to hear from you and share your experiences with my readers.
If you have any comments or questions, please feel free to leave them on the blog or email me at bobsadviceforstocks@lycos.com.
Yours in investing,
Bob
Thursday, 6 May 2010
Lowe's Companies (LOW) "Trading Transparency"
Hello Friends! Thanks so much for stopping by and visiting my blog, Stock Picks Bob's Advice! As always, please remember that I am an amateur investor, so please remember to consult with your professional investment advisers prior to making any investment decisions based on information on this website.
 In the midst of the wild gyrations of the market today, my Lowe's shares hit a sale point on the downside exceeding an 8% loss, which is my loss limit for a new purchase. My 111 shares of Lowe's (LOW) which were just purchased 4/23/10 at a price of $28.1568, were sold today (5/6/10) at a price of $25.714. This represented a loss of $(2.4428)/share or (8.7)% since purchase in the brief period of only two weeks!
I do not second-guess my stocks after a purchase. I believe in the long-term potential of an investment in Lowe's and would like to believe that I can find the opportunity to re-invest with the purchase of shares. But meanwhile, I choose to manage my investments both big and small with the perspective that my efforts somehow mean something--that they can add value to an investment portfolio by assisting in the movement into and out of the market.
With the sale of Lowe's at a loss, this represented a "bad news" sale for me and the proceeds of the sale are left in 'cash' awaiting a "good news" signal so that I can utilize this cash for another position purchase. Good news signals, as I have explained previously, represent partial sales of the holdings within my portfolio as they hopefully reach appreciation targets.
I hope that tomorrow's activity is a bit more rational than today's as the volatility will scare away small and large investors alike who shall be looking into investing in possibly more stable investments like Federal Bonds or into more exotic investments like gold. I shall keep you posted.
Yours in investing,
Bob
Sunday, 2 May 2010
Ecolab (ECL) "Trading Transparency"
Hello Friends! Thanks so much for stopping by and visiting my blog, Stock Picks Bob's Advice! As always, please remember that I am an amateur investor, so please remember to consult with your professional investment advisers prior to making any investment decisions based on information on this website.
One of the biggest news stories this past week has been the British Petroleum oil spill from the Rig Deepwater Horizon in the Gulf of Mexico, which  now, according to this NASA satellite image, is approximately the size of Puerto Rico.
As this editorial points out, the spill may have long-lasting effects on oil exploration and put a damper on President Obama's proposal regarding opening up more areas of the country to exploration.
With all of that in mind, and the market and my own portfolio reeling Friday from a fairly sharp correction, I chose to unload my Schlumberger (SLB) shares and sold my 42 shares of Schlumberger (SLB) at $71.87/share. I had just purchased these shares on April 13, 2010, with a cost basis of $2756.85 or $65.64/share (including commission) and thus realized a gain of $6.23/share or 9.5% since purchase.
 However, this sale is completely out of my general trading strategy of sales of stock at gains and losses. This falls into my own 'disgression' to pull the plug on any holding when some fundamental news story makes me believe that the short-term prospects for the stock are less than stellar. This spill, and the almost guaranteed negative sentiment that will be generated as the oil hits shore, will likely slow down plans in the United States, if not globally, for expansion of exploration of offshore oil assets.
It is possible I was just in a panic and pulled the plug on this essentially great company way too soon. Time will tell, but I didn't want to really find out. My recent track record for these 'arbitrary' moves is relatively poor as I recently sold my shares of Walgreen (WAG) and purchased shares of Abbott (ABT) only to watch Walgreen shares move higher and Abbott (ABT) shares decline to my 8% loss limit.
Ironically, I chose to move my funds from a company now in an industry associated with oil spills and environmental catastrophes, into a company whose main purpose is 'cleaning up' messes--Ecolab (ECL). I last purchased shares of Ecolab (ECL) in February, 2009, and wrote up my thoughts about this stock at that time. I also discussed Ecolab on my blog in December, 2008, using it as an example of how I go about picking a stock.
With all of that in mind, I sold my shares of Schlumberger (SLB), even though it wasn't directly involved in the spill as far as I could tell, but rather because I was concerned about the near-term strength of that entire industry, and purchased 65 shares of Ecolab (ECL) at $48.98/share.
According to the Yahoo "Profile" on Ecolab (ECL), the company
"...develops and markets products and services for the hospitality, foodservice, healthcare, and industrial markets in the United States and internationally. It offers cleaning and sanitizing products and programs, as well as pest elimination, maintenance, and repair services primarily to hotels and restaurants, healthcare and educational facilities, quick service (fast-food and convenience store) units, grocery stores, commercial and institutional laundries, light industry, dairy plants and farms, food and beverage processors, and the vehicle wash industry."
Just last week, on April 27, 2010, Ecolab (ECL) reported first quarter 2010 results. Earnings climbed sharply to $95.6 million or $.40/share up from $57.4 million or $.24/share the prior year. Adjusted earnings came in at $.41/share beating expectations with analysts, according to Thomson Reuters, estimating $.39/share. Sales increase 6% to $1.43 billion also exceeding analysts' expectations of $1.42 billion. In addition the company raised guidance for earnings to a range of $2.21 to $2.26/share for the year, up from the prior guidance of $2.17 to $2.25/share. Analysts have been expecting earnings of $2.22/share.
Reviewing the Morningstar.com "5-Yr Restated" financials for a longer-term view, we can see that revenue climbed from $4.54 billion in 2005 to $6.14 billion in 2008 before slipping to $5.9 billion in 2009. Earnings climbed from $1.23/share in 2005 to $1.80/share in 2008 before dipping to $1.74/share in 2009. Dividends have been paid annually over this same period and have also increased each year from $.36/share in 2005 to $.58/share in 2009. Outstanding shares have been reduced each year from 260 million in 2005 to 240 million in 2009.
Free cash flow has also been strong with $436 million reported in 2007 increasing to $443 million in 2009.
The balance sheet appears solid with $74 million in cash and $1,741 million in other current assets. This total of $1.82 billion, when compared to the current liabilities of $1.25 billion yields a current ratio of 1.46. Ecolab also has $1.77 billion in long-term liabilities.
Checking Yahoo "Key Statistics" on ECL for some valuation numbers, we find that Ecolab is actually a large cap stock with a market cap of $11.5 billion. The trailing p/e is a bit rich at 25.75 with a forward p/e of 19.38 (fye Dec 31, 2011) as estimated. Again estimating the next five years of earnings, the PEG ratio is calculated at 1.68, again suggesting a fairly fully-valued stock.
According to the Fidelity.com eresearch website, valuation relative to other companies in the same industry isn't bad at all. The Price/Sales ratio works out to 1.93 compared to an industry average of 2.64. I frequently refer readers back to the wonderful article by Paul Sturm in SmartMoney who discussed the importance of looking at Price/Sales numbers when determining valuation of a particular company. The company also has a Return on Equity (TTM) of 23.88% compared to the industry average of 16.05%, a Return on Assets (TTM) of 9.24% compared to the industry average of 5.51%, and a Return on Investment (TTM) of 15.22% vs. the industry average of 7.6%.
Returning to the Yahoo information, there were 5.26 million shares out short as of April 15, 2010, with a short ratio of 3.00, my own arbitrary cut-off for significance. The forward annual dividend rate if $.62/share with a yield of 1.3%. The company has a payout ratio of only 31%
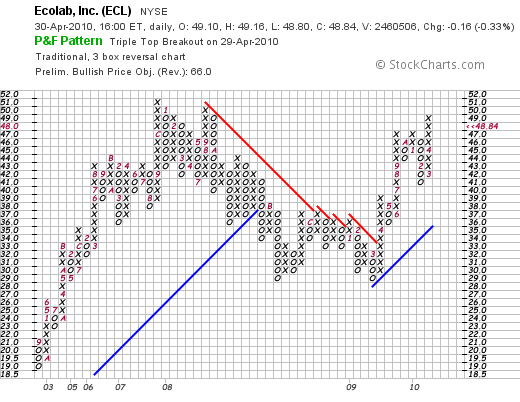
Reviewing the 'point & figure' chart on Ecolab (ECL) from StockCharts.com, we can see that the company stock was doing quite well from September, 2002, when it bottomed at $19/share, until September, 2007, when it hit a high of $51. The company turned lower and bottomed twice at the $29.5 level before rebounding in March, 2009, and moving higher to its current level of $48.84.
In summary, I chose to share my shares of Schlumberger (SLB) Friday, not because of any particular news I could attribute to the company, but rather my concerns about the short-term attractiveness of the entire oil service industry. I am an admirer of Schlumberger and would like to once again in the future add it back to my portfolio, but meanwhile I have chosen to switch into Ecolab (ECL). Generally, it is the best, not the worst, time to be buying a stock when a 'crisis' strikes. If you recall the Johnson & Johnson Tylenol "scare", you can remember how bad people expected the stock to perform---and it turned out to be a great time to buy the stock. (Ironically, Tylenol is once again being recalled as I write---this time it is the Children's Tylenol!)
In the future, I may well depend on the stock price itself rather than my own arbitrary decisions on pulling the plug on a stock. However, the size of this man-made disaster is threatening, and I wanted to get out of the way of this oil slick of an industry.
Thanks again for stopping by and visiting my blog. If you have any comments or questions, please feel free to leave them right on the website or email me at bobsadviceforstocks@lycos.com.
Yours in investing,
Bob
Posted by bobsadviceforstocks at 10:24 PM CDT
|
Post Comment |
Permalink
Updated: Sunday, 2 May 2010 10:26 PM CDT
Thursday, 29 April 2010
Iron Mountain (IRM) "A Friend Asks...."
Hello Friends! Thanks so much for stopping by and visiting my blog, Stock Picks Bob's Advice! As always, please remember that I am an amateur investor, so please remember to consult with your professional investment advisers prior to making any investment decisions based on information on this website.
Over the last seven years I have enjoyed getting up way too early to get myself over to the La Crosse Exercise and Health Program where I try to at least get out and walk a few miles with some really great people and graduate students. We manage to talk about our children, sometimes grandchildren, spouses, politics, the weather, and offer our sage advice to the University of Wisconsin, La Crosse graduate students getting their degrees in exercise physiology.
Recently I have been prompted a time or two about my thoughts on Iron Mountain (IRM) by Jerry H. (in the front in the middle below) a good friend of mine and fellow walker in our 3 mile walking group. Jerry has been very interested in stocks and has made some very good picks (Netflx (NFLX)) and other stock investments like Wachovia that haven't worked out quite as well.
 Recently he has been quite interested in Iron Mountain (IRM) which he recently switched for Cintas (CTAS). He has been asking me about this stock telling me he was putting limit prices and I suggested if he wanted to buy the stock to just go ahead and buy it at the market.
Jerry did that today and it didn't work out very well. In fact, in the midst of the big market rally today, his recent purchase of shares in Iron Mountain (IRM) moved in the opposite direction.
Jerry emailed me with this comment:
"Great! Been chasing the damn thing for a couple of weeks with limit order buys, then some guy in my exercise group says, “Just do a market order buy.” So I do that and the damn thing drops 8% at that very moment.
IRM Iron Mountain Inc (IRM) 25.80 -2.20 (7.86%)"
That "guy" was me.
Let's take a closer look at this stock and see if it looks like Jerry made a good purchase and that the stock price move should be ignored or whether this price decline may be a sign of greater weakness in the future.
 As Jerry pointed out, Iron Mountain (IRM) closed at $25.80, down $2.20 or (7.86)% on the day.
According to the Yahoo "Profile" on IRM, the company
"...provides information management and related services for various media in North America, Europe, Latin America, and the Asia Pacific. It offers records management, data protection and recovery, and information destruction services. The records management services include records management program development and implementation to help customers comply with specific regulatory requirements; implementation of policy-based programs that feature secure storage for media consisting of paper, flexible retrieval access, and retention management; digital archiving and related services for secure long-term archiving of electronic records; and specialized services for vital records and regulated industries, such as healthcare, energy, government, and financial services."
What drove the stock lower today was the 1st quarter 2010 results this morning which were reported this morning. Net income for the quarter came in at $26 million, down 11% from the $29 million in the prior year. This worked out to $.12/share down from $.14/share. 'Adjusted' earnings came in at $.23/share against last year's adjusted $.19/share. Revenue increased to $777 million, up from $723 million the prior year.
Since analysts, as assessed by Factset Research, were expecting $.22/share of earnings, on $778.2 million of revenue, the company actually exceeded earnings expectations and missed slightly on revenue results. At first glance it really seems like the selling got overdone. OK that doesn't get you any money back on your apparently poorly timed purchase. However, maybe there were whisper numbers on the earnings that just weren't loud enough to reach Western Wisconsin? Also, just meeting expectations or barely exceeding and selling off in the face of this news seems to indicate the frothy level of the market rally today. OK that doesn't make you feel any better either I know.
Longer-term, reviewing the Morningstar.com "5-Yr Restated" financials on Iron Mountain (IRM), we can see that revenue which came in at $2.08 billion in 2005, climbed to $3.06 billion in 2008, and dipped slightly to $3.01 billion in 2009. Earnings increased from $.56/share in 2005 to $.76/share in 2007, before dipping to $.40/share in 2008 and then rebounding to $1.08/share in 2009. Outstanding shares have been fairly stable at 198 million shares in 2005 increasing slightly to 204 million in 2009. No dividends are paid.
Free cash flow, per Morningstar, increased from $47 million in 2007 to $304 million in 2009. The balance sheet shows that the company has $447 million in cash and $765 million in other current assets which when compared to the $815 million in current liabilities yields a current ratio of 1.49, a healthy ratio. However, the company does have a significant amount of long-term liabilities totaling $3.89 billion. With the growing free cash flow, servicing this debt doesn't seem to be a problem.
In terms of valuation, the company is a mid cap stock with a market capitalization of $5.25 billion. The trailing p/e is a moderate 23.87, the forward (fye Dec 31, 2011) works out to 19.25 estimated. The PEG ratio is a bit rich at 1.65. (I find reasonable valueof growth stocks with PEG's at 1.5 or lower).
There are 203.6 million shares outstanding and 180.05 million that float. Currently there are 12.08 million shares out short (as of 4/15/10), and with the average daily volume of 1.36 million shares, this works out to a short ratio of 10.50, well above my own arbitrary '3 day rule' for significance. According to Yahoo the company does pay a small dividend of $.25/share with a yield expected to be at 0.9%. The last stock split was a 3:2 split in January, 2007.
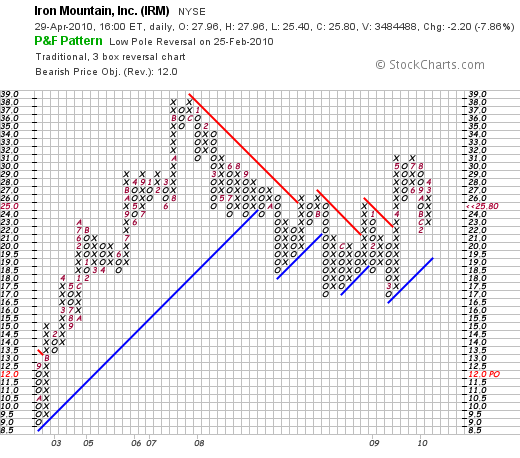
Reviewing the 'point & figure' chart on Iron Mountain (IRM) from StockCharts.com, we can see that the stock which traded as low as $9/share in October, 2002, climbed to $38/share in November, 2007, only to dip to $17/share in November, 2008, and once again in March, 2009. Recently, the stock has been moving higher as the entire market has recovered, breaking through resistance at $21, and hitting a recent high of $31/share. The stock is currently correcting from its recent break-out and does not appear wildly over-valued technically from this amateur's perspective.
To summarize, Iron Mountain is in an interesting business which I do not completely understand that apparently deals with record management, data storage and recovery. They overall are a successful company with reasonable earnings and revenue growth, decent balance sheet, and a reasonably strong technical performance for the stock.
As is often the case, earnings releases often result in unexpected price volatility as stock prices climb on expectations and whispered numbers. It is common for stocks to paradoxically drop on what appears to be good news and climb on what should otherwise have been a disappointment. Frankly, there is a lot of madness in the trading activity around earnings releases. I am sorry my friend that you got caught in this volatility.

Closing with a view of the Mississippi that we often see as we walk in the morning from UWL down to the River, I thank all of my good friends both here on the net as well as right at the University who provide me with great conversation, challenge and support my own ideas, and make sure that I get out and get some fresh air and exercise many mornings of the week!
If you have any comments or questions, please feel free to leave them right here on the blog or email me at bobsadviceforstocks@lycos.com.
Yours in investing,
Bob
Newer | Latest | Older


