Stock Picks Bob's Advice
Tuesday, 6 July 2004
July 6, 2004 Cal-Maine Foods (CALM)
Hello Friends! Thanks so much for stopping by!....please excuse the organization of this blog if you are a new visitor...I have hundreds of ideas to consider...but you will need to learn how to navigate around the website. Best place is to start here with recent posts and go backwards...if you like go to the
main website for Bob's Advice and along the left side you will see the links for the
"Current Trading Portfolio" and "Stock Picks 2003". Also, just below that you will find the link for
"Stock Picks 2004" where I have listed my picks for this year (2004)...and try to on occasion update current prices. If you find any particular stocks you wish to see the initial write-up, use those lists to get the date...I do NOT have it linked at this time, but then manually look at the lists of dates to the left side of this blog, and you can click on those dates and navigate that way....ok I hope that was helpful!
As always please remember that I am an amateur investor, I try to always share with you what I am doing and what I own, but please consult with your professional investment advisors prior to making any investment decisions. I CANNOT be responsible for the actions you take after reading what I write. There, I hope that disclaimer explains my thoughts on this website clearly!
Today, I was meeting with my "Investnut" buddies, and presented Cantel Medical (CMN). As you may realize, I
posted Cantel on March 2, 2004, when it was trading at $18.40. Cantel closed today at $24.68...so it has had a nice ride since my post. I also purchased some of these shares earlier this year....(6/4/04)...and have had a nice appreciation in share price as well!

I first heard about Cal-Maine (CALM) after it was mentioned in the Investors Business Daily (IBD)...some weeks ago. I believe it was in the "New America" section. I do NOT own any shares nor do I have any options on this stock. As close as I get to an EGG stock, lol, is Sanderson Farms (SAFM) that has been listed here, and I do own some shares of SAFM. Somehow, the old joke about which came first "the chicken or the egg"....well in my case, I have invested in chickens first but am ready for eggs now! I think much of the interest in these stocks is related to the ever-discussed "low-carb" phenomenon in which eggs which used to be "bad" are now "good" and "high-protein." This results in all of us who struggle with reducing carbohydrates, I confess I am among the many....taking another look at eggs (No yolk, I am serious!). sorry.
Excuse me for "scrambling" up this post....but CALM had a great day today closing at $15.09/share up $1.53 or 11.28% in an otherwise mediocre market.
According to the
Yahoo "Profile", Cal-Maine "...is primarily engaged in the production, cleaning, grading and packaging of fresh shell eggs for sale to shell egg retailers. The Company had sales of approximately 571 million dozen shell eggs during the fiscal year ended May 31, 2003." Now THAT is a LOT of french toast!
I found the 3rd quarter 2004 results on the
company website. These results were released March 29, 2004, and for the quarter ended February 28, 2004, net sales came in at $165.7 million compared with $106.8 million the prior year! Net income was $23.9 million or $1.98/basic share (?), compared with net income of $7.6 million or $.65/basic share the year earlier. CALM DID have a 2:1 split in April, 2004, shortly after this stock report, but STILL, the company earned, even adjusting for the split, nearly $1/share in a 3 month period. And the stock is currently trading at about $15/share. You do the math.
If we look longer-term at
"5-Yr Restated" financials on Morningstar.com, we can see that revenue came in at $288.0 million in 1999, was flat at $287.1 million in 2000, and then grew fairly steadily, with another pull-back in 2002, then to $533.4 million in the trailing twelve months.
Earnings have been very erratic, going from profits in 1999, to losses in 2000, profit in 2001, loss in 2002, and has improved subsequently. Consistency in earnings has NOT been a strength of this company! The company does pay a small dividend of $.03/share.
Free cash flow has also been a bit erratic dropping from $16 million in 2001 to $(15) million in 2002, back to $18 million in 2003, and now up to $73 million in the trailing twelve months. The balance sheet on Morningstar looks just fine with $55.1 million in cash and $84.1 million in other current assets, plenty to cover the $66.3 million in other current liabilities and to make a large "dent" in the $100.1 million of long-term liabilities.
What about Valuation? For this, I like to check
"Key Statistics" on Yahoo. Here we can see that this is a small cap company with a market cap of only $347.21 million. The trailing p/e is 6.85. No forward p/e is noted, and no PEG. You can just imagine what the p/e will do if the current results persist!
This stock HAS performed quite well and is actually up 393.09% the last 52 weeks! Are we late? That can only be told by what happens the NEXT 52 weeks...but we have missed out the portion of the rise that has already occurred.
There are 23.01 million shares outstanding and ONLY 4.00 million that float. There are 4.32 million shares out short representing 107.98% (!!) of the float. Or 11.306 trading days. With the stock moving UP today, I can only speculate that there are a LOT of short sellers scrambling, and I mean scrambling (no pun intended lol) to cover their shorts (before they LOSE their shorts!). Talking about a SQUEEZE!
The company as I noted does pay a small dividend yielding 0.37% and DID split 2:1 in April, 2004.
What about Technicals? If we look at a Point and Figure chart from Stockcharts.com:
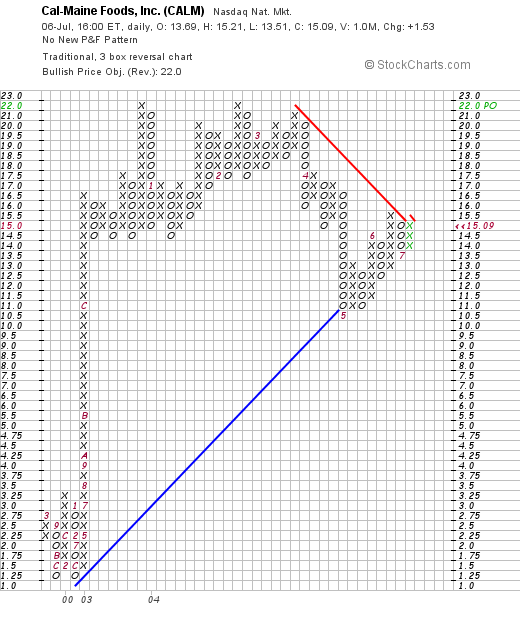
we can see that the stock has pulled back to its support level, but appears to be moving upward once again! I guess all of those short sellers ASSUMED the stock was a GREAT short because it had climbed so far. That is the error of looking at the past to determine its future fate. That is, just because it moved up TREMENDOUSLY does NOT MEAN that it should NECESSARILY retrace its price action. The move upward, with the P/E UNDER 10 currently, suggests was competely based on the stock being TERRIBLY UNDERVALUED....heck that is at least my take on the matter.
What do I think...I think I will take my eggs "Sunny-Side Up!"...o.k. seriously, this stock really DOES look interesting to me...the valuation is great, the revenue growth is terrific, the earnings consistency however is AWFUL...but they did earn $1 in the last quarter. If they could earn the same the next three quarters....well the stock would be selling for about a p/e of 4! The free cash flow and balance sheet are just fine. And I would love to be buying shares when all of those short-sellers are hanging out....sorry fellows....but why would you sell short in a stock with such a low float?
Thanks so much for stopping by! If you have any comments, questions, or words of encouragement, please feel free to email me at bobsadviceforstocks@lycos.com
Bob
Saturday, 3 July 2004
A Reader Writes "Check out KSWS"
Hello Friends! Well I JUST got done posting that weekend review....boy that can get to be a chore...so I hope you all enjoy that retrospective review....even WHEN the stocks have done relatively poorly! Please remember AS ALWAYS that I am an AMATEUR investor....so ALWAYS check with your own professional financial advisors before making any decisions based on information on this website!
I had the pleasure of receiving ANOTHER idea from Leon who I believe is based in New Zealand: Leon writes:
check out KSWS.....sales up nicely and eps up year on year......
no debt long term
Leon Well, let's take a look at K-Swiss (KSWS) and see how it fits into the scheme of things: (I do NOT own any shares of KSWS...but I do NOT know what Leon's ownership status is...)

KSWS closed at $20.68 on 7/2/04, actually UP $.41 or 2.02% in a down market.
My first step: what were the latest quarterly earnings?
On April 28, 2004, KSWS
reported 1st quarter 2004 results. Revenues increased 31.3% to $152 million from $116 million the prior year. Net earnings increased 59.5% to $21.8 million from $13.6 million the prior year. On a diluted per share basis, this was a 58.3% increase to $.57/share from $.36/share. Leon, I have to admit, these are GREAT earnings!
Second step: what about longer-term results?
Looking at
"5-Yr Restated" financials from Morningstar.com, we can see that except for a dip in revenue between 1999 and 2000 (from $287 million to $223 million), this stock has been doing quite well growing to $465.4 million in the trailing twelve months.
Earnings also dipped between 1999 and 2000, dropping to $.49/share from $.75, but have steadily increased to $1.32 in 2003 and $1.53 in the trailing twelve months. Again this looks nice.
Free cash flow has not only been positive but also GROWING. This is a big plus imho. Morningstar shows $20 million in free cash flow in 2001, $25 million in 2002, $31 million in 2003, and $55 million in the trailing twelve months. Again this looks EXCELLENT.
Balance sheet? Leon, you are right, this looks great too. It does appear that they do have some long-term debt, but Morningstar shows $90.2 million in CASH, enough to pay off BOTH their $48.8 million in current liabilities and $19.3 million in long-term liabilities. In addition, Morningstar shows $154.9 million in other current assets. Again, this is a BEAUTIFUL report.
My third step: What about valuation?

Looking at
"Key Statistics" from Yahoo, we can see that this is a small-cap stock with a market cap of $730.67 million. The trailing p/e is cheap at 13.38, and the forward p/e (fye 31-Dec-05) is even nicer at 12.61. The PEG is GREAT at 1.08, with a price/sales of 1.54. This is priced right!
There are 35.33 million shares outstanding and 25.30 million of them that float. Interestingly, there are 1.72 million shares out short...with a short raio as of 6/7/04 of 4.87. This is DOWN from the prior month's short level of 2.11 million shares...so there IS some short coverage going on, but with the ratio over 3.0, in my book, this is a bullish indicator.
The company even pays a small dividend of $.10/share yielding 0.49%. They last had a split, 2:1 just this past year in December 2003.
My fourth step: What about technicals?
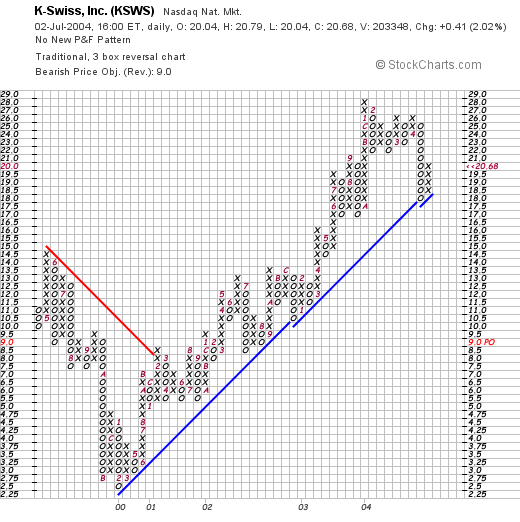
Again, this looks nice, after breaking through a resistance level of about $8.00 in February, 2001, this stock has traded very consistently higher along its support line. This was recently challenged with a pull back to $18.00 since April, 2004, but has rebounded back above its support level successfully. Again, I am NOT a master technician, but this chart looks fine to me!
What do I think? Well Leon, this stock looks terrific! It DOES fill the criteria that I like to look for. I do not know much about the shoe business except to say how fickle the consumer can be in regards to styles, etc., so on a Peter Lynch kind of level I do not know what to expect. On a purely numerical, technical basis, which is how I select stocks, this is a nice pick!
Please remember that I am an amateur investor! If you have any questions, or comments, please feel free to email me at bobsadviceforstocks@lycos.com
Thanks for writing Leon!
Bob
"Looking Back one Year" A review of stock picks from the week of June 23, 2003

Hello Friends! Well we made it to another Saturday. I hope you all have made 4th of July plans....hopefully will get to see some fireworks with the family Sunday....and do the usual 4th of July kinds of things. For any of you who are new around here, well of course make yourself at home, kick back and enjoy the posts. I am an amateur investor, I like to share my ideas about stocks and the market, but please remember to consult with your own professional investment advisor to make sure any investments discussed on this website are appropriate and timely for you. On Weekends, when I get around to it, I like to go back a full year to the early days of this blog and see how the stocks selected are doing now. This approach assumes a buy and hold strategy which is NOT what I do in practice. If a stock drops 8% from the purchase price it is gone. Otherwise, I do continue to hold them and sell portions as the price appreciates.

On June 23, 2003, I
posted Fresh Del Monte Produce (FDP) on Stock Picks at a price of $26.14. FDP closed at $25.45 on 7/2/04, for a decline of $(.69) or (2.6)%.
On April 27, 2004, FDP
reported 1st quarter 2004 results. Net sales increased 11% to $713.8 million for the three months ended March 26, 2004. However, earnings per share came in at $.81/share compared to $1.35/share in the same quarter in 2003. I really prefer to see earnings GROWTH each quarter when I am considering a stock pick.

On June 23, 2003, I
posted Factual Data Corp (FDCC) on Stock Picks at a price of $19.18. FDCC was acquired by Kroll (KROL) for $14.00 and .1497 shares of KROL. Currently with KROL at $36.88/share as of 7/2/04, this works out to $14.00 + (.1497)($36.88)= $19.52. This works out to a gain of $.34/share or 1.8%.

Bankrate (RATE) was
posted on this website at a price of $10.40. RATE closed at $8.12 on 7/2/04 for a loss of $(2.28) or (21.9)%.
On May 4, 2004, RATE
announced 1st quarter 2004 results. Revenue jumped 20% to $10.3 million for the quarter ended March 31, 2004, from $8.5 million last year. Net income rose 17% to $2.4 million or $.15/diluted share vs $2.0 million or $.13/diluted share last year. At least superficially, these are nice results. Things have NOT been that smooth for RATE, which on June 21, 2004,
announced the replacement of the CEO, and just a week ago, on June 23, 2004,
announced guidance for the 2nd quarter 2004: revenue fairly flat quarter over quarter at $10 - $10.2 million, and net income at $.14-$.15/share, which is BELOW last year's $.16/share results. Needless to say, the "street" was not real happy over these announcements!
 Digital Insight (DGIN) was picked
 for Stock Picks on 6/25/03 at a price of $17.96. DGIN closed at $19.61 on 7/2/04 for a gain of $1.65 or 9.2%.
News-wise, it was
just announced that DGIN will be added to the Standard & Poor's SmallCap 600 Index. Being added to an index is usually bullish for a stock as index funds are then required to purchase shares. On April 22, 2004, DGIN
reported 1st quarter 2004 results. Revenues for the quarter ended March 31, 2004, increased 29% to $45.7 million from $35.5 million the prior year. Net income grew 46% to $4.2 million or $.11/diluted share from $2.9 million, or $.09/diluted share in 2003. Once again we can see the correlation between good earnings report and price performance of a stock!

On June 25, 2003, I
posted Biosite (BSTE) on Stock Picks at a price of $48.15. BSTE closed at $43.60 on 7/2/04 for a loss of $(4.55) or (9.4)%.
On April 28, 2004, BSTE
reported 1st quarter 2004 results. Revenues came in at $57.7 million, a 44% increase over the prior year. Net income was $8.9 million or $.55/diluted share, a 50% increase over the same 2003 quarter. Citing strong sales performance in the first quarter, BSTE RAISED 2004 annual growth target range to 25-35% revenue growth and 25-35% earnings growth on a diluted share basis. These are really nice results...but the stock price still lags my selection price!
HANG IN THERE....just three more selections to review!

In a relatively WEAK performance for Stock Picks, Biovail (BVF) was our weakest! BVF was
selected for Stock Picks on June 26, 2003, at a price of $49.30. BVF closed on 7/2/04 at $18.90 for a loss of $(30.40) or (61.7)%.
On April 29, 2004, this Toronto-based company
announced 1st quarter 2004 results. Revenue for the quarter ended March 31, 2004, came in at $186.6 million DOWN from $191.4 million for the same quarter last year. Net income came in at $21.1 million or $.13/share compared to $57.6 million or $.36/share last year. You can see why the stock has been weak!

I
posted CACI Intl (CAI) on this blog at $34.27 on June 27, 2003. I suppose it DOES help to sometimes have a handle on WHAT a firm does, as CACI as received
bad press recently as the private contractor involved in the interrogation of Iraqi detainees. ANYWAY, CAI closed at $39.79 on 7/2/04 for a gain of $5.52 from our "pick" price or 16.1%.
This stock has held up due to the strong underlying financial performance. CAI, on May 26, 2004,
issued 1st quarter 2006 guidance. They expect revenue to grow 51-55% to approximately $360 million and net income to grow 23% to approximately $16.3 million. These are strong numbers! However, the uncertainty regarding the prison abuse allegations is of great concern to me.

Finally, on June 27, 2003, I
selected Online Resources (ORCC) for Stock Picks at a price of $6.17. ORCC closed at $6.57 on 7/2/04 for a gain of $.40/share or 6.5%.
On April 21, 2004, ORCC
reported 1st quarter 2004 results. For the quarter ended March 31, 2004, excluding one-time events, revenue grew to $9.8 million compared to $8.8 million the prior year. Net income came in at $419,000 or $.02/share compared with "breakeven" the prior year.
So how BAD was the weak actually? During the week of June 23, 2003, to the present time, those stocks had four winners and four losers. However, the BIG loss on Biovail (BVF) (61.7)%...really pulled down the average performance. The average LOSS for the week worked out to an average loss for the 8 issues of (7.8)%.
Thanks so much for stopping by! If you have any comments, questions, or words of encouragement, please feel free to email me at bobsadviceforstocks@lycos.coma nd I will try to get back to you ASAP!
Happy 4th of July everyone!
Bob
Thursday, 1 July 2004
"Trading Transparency" DJO
Hello Friends! Well THAT nickel sat in my pocket for a total of seventeen seconds. Scanning through the lists of gainers, I came acroo DJ Orthopedics (DJO) an old favorite on this website, and saw that it was making a nice move. I took a peek at the latest Morningstar.com financials, the latest earnings report....and bought 300 shares for $24.04 a few moments ago!
Thanks so much for stopping by! Remember I am an AMATEUR investor, so please do your own investigation and consult with your investment advisors before making any investment decisions based on information on this website. If you have any comments, or questions, please feel free to email me at bobsadviceforstocks@lycos.com
Bob
"Trading Transparency" LWAY
Hello Friends! This is a quick note to update you on activity in my trading account. A few moments ago I sold 50 shares of my 200 share position of Lifeway Foods (LWAY) at $16.32. I had JUST purchased LWAY on 6/25/04 at a price of $12.76, so this was a gain of $3.56 or 27.9%. Close to my 30% sell point, I sold my 1/4 position of LWAY into a market that is actually quite weak. And that allows me to look for a NEW position...yipppeee....you know how much I like BUYING stock :).
Thanks again for stopping by! Remember, I am an amateur investor, so please check with your professional investment advisors prio to making any decisions based on information on this website. For questions or comments, please feel free to email me at bobsadviceforstocks@lycos.com
Bob
July 1, 2004 Tempur-Pedic Intl (TPX)
Hello Friends! I guess the "street" didn't like that quarter point move...and the jobless numbers up 1,000 weren't that impressive for a booming economy that requires the Fed to tighten...now I am just an amateur as I repeat over and over....but does that old term "STAGFLATION" come to mind to anybody else besides me? Please remember that I am an amateur investor, so please do your own investigation of all investments discussed on this website and consult with your professional investment advisors.

Tempur-Pedic Intl (TPX) had a nice day in an otherwise ugly trading session closing at $14.45, up $.44 or 3.14% on the day. I do not have any shares of TPX nor any leveraged positions.
According to the
Yahoo "Profile", TPX "...is a vertically integrated manufacturer, marketer and distributor of premium visco-elastic foam mattresses and pillows that it sells globally in 54 countries, primarily under the Tempur and Tempur-Pedic brands."
On April 22, 2004, TPX
announced 1st quarter results. Revenue was $153.1 million, up 45.7 from the prior year, and fully diluted earnings per share came in at $.16, up 33% from the $.12/diluted share the prior year.

In addition, TPX increased guidance for the balance of 2004.
Looking longer term, we can examine the
"5-Yr Restated" financials from Morningstar.com. Here we see the steady growth in revenue from $73.6 million in 1999 to $479.1 million in the trailing twelve months (TTM). Earnings were break-even in the TTM, but clearly are positive and growing from the latest quarterly report.
Free cash flow which was negative at $(16) million in 2001, has improved to $14 million in 2003.
The balance sheet looks o.k., although the long-term debt is a bit steep, the cash is at $14.2 million with $131.2 million in other current assets, enough to cover the current liabilities of $90.5 million and make a small dent in the $407.2 million in long-term liabilities.

What about "valuation?" Taking a look at
"Key Statistics" from Yahoo, we see that this stock is a mid cap issue with a market cap of $1.41 billion. The trailing p/e is a bit rich at 35.50, but the anticipated growth leads to a forward p/e (fye 31-Dec-05) of 16.06. This rapid growth results in a calculated PEG of 0.80. Price/sales not quite as nice at 2.59.
Yahoo reports 97.41 million shares outstanding with 28.40 million of them that float. 70.85% of the shares are held by insiders...usually a bullish indicator. Only 872,000 shares are out short as of 6/7/04, representing a moderate short ratio of 3.218 trading days.
Yahoo reports no cash dividend and no stock split is noted on Yahoo either.
What about "technicals?" Taking a look at a point & figure chart from Stockcharts.com:
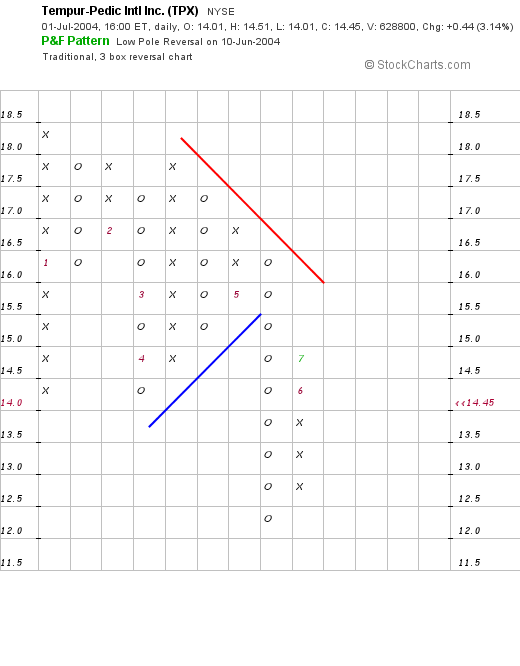
This chart is a bit less than convincing with TPX struggling with a resistance level and actually trading lower. I would like to see the stock break through the resistance level of about $16 to higher territory before calling this graph bullish.
What do I think? The latest earnings result is very nice....as is the record of the past 5 years. The free cash flow is also good to see, however, the company DOES have a good amount of long-term liabilities to deal with. Valuation is nice with a PEG under 1.0...and lots of insiders hold shares. However, the technicals are a bit weak.
In conclusion, I LOVE their material. (I have a Tempur-Pedic pillow I adore), but I do not at this time own any shares, nor am I convinced that this is the BEST opportunity for my limited resources. Thanks so much for stopping by! If you have any comments or questions, please feel free to email me at bobsadviceforstocks@lycos.com
Bob
Posted by bobsadviceforstocks at 11:37 AM CDT
|
Post Comment |
Permalink
Updated: Thursday, 1 July 2004 9:51 PM CDT
A Reader Writes "Check out MDCC!"
Hello Friends! Happy Thursday everyone. Thanks so much for stopping by. If you are new at this site, please make yourself at home, explore what is available here, and remember that I am an amateur investor, so please do your own investigation of all investment matters discussed on this website and please consult with your professional investment advisors prior to making any investment decisions to make sure they are appropriate and timely for your investment needs!
Leon was kind enough to write again. He writes:
Check out MDCC !
That might satisfy your requirements and they are now in the process to merrge with an aussie company with a nice product line coming to market which should help MDCC with more revenue growth.....
PE around 17x i think.....not much debt less than 20m when equity is more than 150m
revenue and eps growing last few years.
actually eps positive for few years now......
LeonI actually am a little familiar with this company and I DO think Leon is onto something here! Let me take a closer look at MDCC:

First of all, Molecular Devices (MDCC), closed at $17.78 yesterday. According to the
Yahoo "Profile", MDCC "...is a supplier of bioanalytical measurement systems that accelerate and improve drug discovery and other life sciences research." I personally do NOT own any shares of MDCC, although I do not know whether Leon does or doesn't.
On April 22, 2004, MDCC
reported 1st quarter 2004 results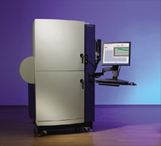
Revenues for the quarter came in at $27.3 million, an 11% increase compared to the prior year. Net income came in at $1.4 million, compared to $721,000 the prior year. On a diluted per share basis this came in at $.10/share vs $.05 per share, a 100% increase. This was a nice earnings report. In addition, MDCC projected continued growth for the upcoming quarters.
What about longer term? Taking a look at the
"5-Yr Restated" financials on Morningstar.com, we can see a relatively uninterrupted revenue growth from 1999 to the latest twelve months (except for a small dip between 2000 and 2001), with revenue growing from $71.9 million to $118.4 million in the TTM.
Earnings have also been a bit erratic, growing from $.26, but dipping to $(.32) in 2001, and then increasing steadily to the $.56 reported by Morningstar in the TTM.
Free cash flow also looks very nice with $10 million in 2001, $13 million in 2002, $16 million in 2003, and $18 million in the TTM. Not only is it positive but it is growing!
Balance Sheet? Couldn't be prettier! They have $50.4 million in cash, enough to pay off their TOTAL liabilities almost 3x over! They also have $46.2 million in other current assets with NO long-term liabilities and only $17 million in current liabilities. Very nice indeed....Leon you and I are thinking alike!
How about Valuation? Looking at
"Key Statistics" on Yahoo, we can see that this is a small company with a market cap of $253.4 million. The trailing p/e is a bit richer than the 17 you suggested Leon, and is actually at 31.64 with a forward p/e (fye 31-Dec-05) of 21.42. However, with the rapid growth anticipated, a PEG of 1.17 is reported which looks just fine to me.
Yahoo reports 14.25 million shares outstanding with 13.60 million of them that float. Of these 459,000 shares are out short as of 6/7/04, giving us a short ratio of 5.598 trading days. This is also bullish for the stock...WHO in their right mind would be going SHORT against these numbers? O.K. I just don't understand the short strategy.
No dividend is paid and Yahoo does not report any prior stock splits.
What about Technicals? Taking a look at a point and figure chart from Stockcharts.com:
I would have to say that sometime in February, 2004, this stock turned down, failing after several attempt to break through its resistance level. I would like to see this break through the $19.5 level in a strong fashion, maybe with some additional good news, before committing funds to this stock. Now I am NOT a very good chart reader, but what do you think?
Overall the company looks great. They have had great earnings, revenue growth, free cash flow, balance sheet is pretty, PEG only just a bit over 1.0, but the charts looks suspect....maybe the SHORTS do know something I don't. One thing I do is watch CLIMBING stocks that are showing a lot of same-day momentum so that I know that at least for the moment, the technicals are in my favor. This company should stay on the screen for this website....Thanks so much for following up with another question!
If YOU have questions, or comments, please feel free to email me at bobsadviceforstocks@lycos.com or post them right on the website.
Bob
Wednesday, 30 June 2004
June 30, 2004 Boston Scientific (BSX)
Hello Friends! Well I have gotten to enjoy the single posts on this blog for stocks but Boston Scientific (BSX) came up today on some positive comments, and the numbers just cannot be ignored. In the past, I have posted Surmodics (SRDX) which makes the stent for Johnson & Johnson....but BSX is pulling in the lion's share of the market.
As ALWAYS, please consult with your PROFESSIONAL investment advisors as I am just an amateur investor, before taking action regarding this or any other investment on this website to make sure such investments are timely and appropriate for you!

Boston Scientific (BSX) had a nice day today closing at $42.80, up $1.81 or 4.42% on the day. According to the
Yahoo "Profile", BSX "...is a worldwide developer, manufacturer and marketer of medical devices whose products are used in a range of interventional medical specialties, including interventional cardiology, peripheral interventions, neurovascular invtervention, electrophysiology, vascular surgery, endoscopy, oncology, urology and gynecology."

This is a GREAT picture of the Taxus covered cardiac stent, the device that is used to maintain the patency, that is keep the coronary arteries OPEN after angioplasty....hopefully preventing the need for bypass surgery.
On April 20, 2004, BSX
announced 1st quarter 2004 results. For the quarter ended March 31, 2004, net sales came in at $1.08 billion compared to $807 million, a 34% increase. Even removing the favorable currency exchange effects, the revenue growth came in at 27%. Net income jumped 100% to $194 million or $.23/diluted share vs. $97 million, or $.11/diluted share the prior year. These are great results!
Checking the
"5-Yr Restated" Financials from Morningstar.com, we can see that revenue was fairly stable between 1999 when it was $2.8 billion, and 2002 when $2.9 billion of sales were reported. Since, then, sales have grown to $3.8 billion in the TTM, on the back of the fabulous reception BSX's drug-coated stents have received (about 70% of the market agains J&J's Cypher stent.)
Earnings dropped initially from $.45/share in 1999 to a loss of $(.07)/share in 2001, then has increased each year to $.68/share in the TTM.
The free cash flow has been SOLID. $369 million reported in 2001, $624 million in 2002, $599 million in 2003, and $485 million in the TTM.
The balance sheet is adequate with $615 million in cash and $1.37 billion in other current assets vs. $1.74 billion in current liabilities and $882 million in long-term liabilities.
What about Valuation? Looking at
"Key Statistics" on Yahoo, we can see that this is a Large Cap stock with a market cap of $35.74 billion. The trailing p/e is rich at 63.79, but the company is growing its earnings so quickly (estimated) that the forward p/e (fye 31-Dec-05) comes in at 17.98. Thus the PEG is only 1.16, and the Price/sales is a bit rich at 9.13.
Yahoo reports 835.08 million shares outstanding with 567.6 million of them that float. There are 14.18 million shares out short as of 6/7/04, representing 2.50% of the float, but only 1.942 trading days...so this isn't that much imho.
Yahoo reports NO cash dividends, but the company DID relatively recently split the stock 2:1 in November, 2003.
How about Technicals? Looking at a nice "Point & Figure" chart from Stockcharts.com:
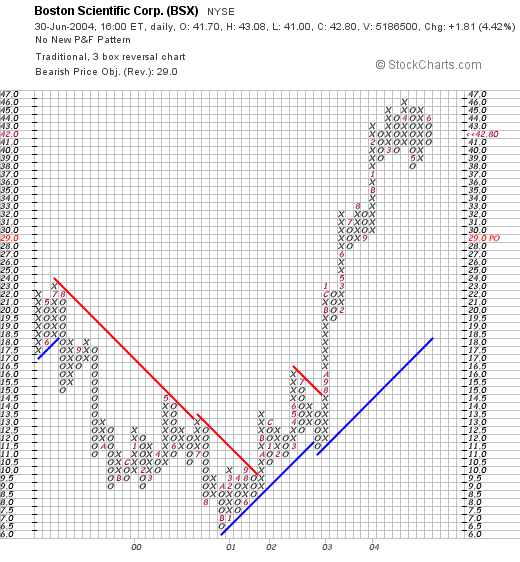
we can see that this stock, which traded lower from $24/share in July, 1999, dropped to a low of $6.5 in September 2000, only to climb steadily until breaking out in August 2003, when it broke through a resistance line of about $14.5 and has now traded very strongly higher....if anything maybe a bit ahead of itself.
What do I think? Well, the numbers are intriguing. The free cash flow is impressive, the valuation isn't that bad as long as the growth continues as the PEG is barely over 1.0. Technicals look nice as well. However, I would NOT write off J&J and their stent....and if that giant pharmaceutical firm every wakes up and stretches it big paws....relatively smaller fish like BSX may have to pay attention!
Thanks again for stopping by. It is getting late here, I posted the three posts I promised!....so off I go. If you have any questions, or comments, please feel free to email me at bobsadviceforstocks@lycos.com
Bob
Posted by bobsadviceforstocks at 11:13 AM CDT
|
Post Comment |
Permalink
Updated: Wednesday, 30 June 2004 11:06 PM CDT
June 30, 2004 The Scotts Company (SMG)
Hello Friends! Scotts (SMG), the lawn company looks like it deserves a spot on this blog. I came across it earlier today and will take a bit of a closer look at the company tonight. As always please remember that I am an amateur investor, so please consult with your professional investment advisors before taking any action based on information on this website!

Scotts Co. (CMG) had a nice day today closing at $63.88, up $3.58 or 5.94% on the day. I do NOT own any shares of Scott, nor do I own any options or leveraged positions. Earlier today, Scotts
updated 2004 financial forecasts and the street 'liked' what it heard!
On April 27, 2004, Scotts
announced 2nd quarter 2004 results. For the quarter ended March 27, 2004, adjusted for currency exchange rates, net sales were up 5% to the reported $729.2 million. Net income came in at $73.1 million or $2.21/diluted share compared with $62.5 million or $2.00/diluted share last year.
Taking a look at the
"5-Yr Restated" financials on Morningstar.com, we can see a steady, if not rapid, growth in revenue from $1.6 billion in 1999 to $2.0 billion in the trailing twelve months.

Earnings have been a bit erratic, but have increased from $2.27/share in 1999 to $2.81/share in the TTM. Free cash flow has been solid with $2 million reported in 2001, increasing to $163 million in the TTM. The balance sheet looks just fine with $14.2 million in cash and $1.3 billion in other current assets, plenty to cover the $593.3 million in current liabilities AND make a nice dent in the $1.2 billion in long-term liabilites.
What about Valuation? Taking a look at
"Key Statistics" from Yahoo.com, we can see that the Market Cap is a mid-cap $2.09 Billion, with a trailing p/e of 23.46 and a forward p/e (fye 30-Sep-05) of 14.13. The PEG is very nice at 1.18, as is the price/sales at 1.00.
Yahoo reports 32.65 million shares outstanding with only 11.20 million of them that float. Of these floating shares fully 9.12% of them are out short as of 6/7/04, representing 7.794 trading days of volume. This is a significant amount of trading volume waiting to be 'covered'...and is bullish for the stock.
No dividend is reported on Yahoo, and no stock splits are noted either.
What about technicals? If we look at a "Point & Figure" on Scotts:
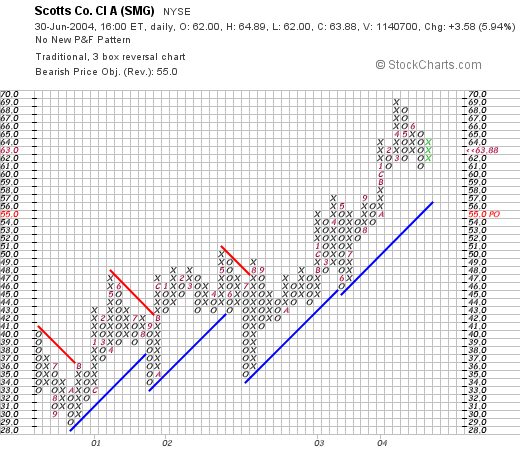
we can see that this stock has a BEAUTIFUL graph, it has been climbing from $29.00 in October, 2000, and has steadily been moving ahead just right on its support line. With the latest good earnings report, I frankly don't see any reason why this shouldn't continue!
What do I think? Well, you KNOW I don't have any MONEY to buy anything....but if I did, I just might. The revenue growth is a little subdued for me...but the outlook looks nice, the valuation is excellent, the balance sheet is fine and technicals are superb. With the recent news upping earnings/revenue estimates....well that is just the ICING on this cake...or should I say it is the FERTILIZER....yuck yuck.
Anyhow, thanks so much for stopping by! I hope you enjoy my posts and continue to visit here often! Please feel free to share your own trading experience....especially if you have chosen to invest in some of the companies discussed on this website! If you would like to comment, or have any questions, please feel free to email me at bobsadviceforstocks@lycos.com
Bob
Posted by bobsadviceforstocks at 10:38 AM CDT
|
Post Comment |
Permalink
Updated: Wednesday, 30 June 2004 10:37 PM CDT
June 30, 2004 Navarre Corp (NAVR)
Hello Friends! Thanks so much for stopping by! Just trying to catch up with some of my earlier brief posts. I hope some of my longer posts recently have helped clarify my investment strategy for you. Please remember that I am an amateur investor, so that means you must do your own investigation of all stocks mentioned on this website and consult with your professional investment advisors to make sure they are appropriate for you!

I came acrosse Navarre Corp. (NAVR) earlier today while looking through the lists of greates percentage gainers today. I do NOT own any shares nor do I have any options on this stock. NAVR closed at $14.39 today, up $.84 or 6.20% on the day. According to the
Yahoo "profile", NAVR "...is a provider of distribution, fulfillment and marketing services for a broad range of home entertainment and multimedia products, including personal computer (PC) software, audio and video titles, and interactive games."
On May 26, 2004, NAVR
reported 4th quarter 2004 results. Net sales for the quarter ended March 31, 2004, increased 70% to $142.6 million from $83.6 million the prior year. Net income for the quarter increased 641% to $3.3 million or $.12/diluted share vs. $442,000 or $.02/diluted share in the prior year. The company ALSO announced estimates for 2005 with revenue in the $550 to $580 million range, and earnings in the $.69 to $.77/share range.
Looking at the
Morningstar "5-Yr Restated" financials, we can see the steady revenue growth from $210.4 million in 1999 to $416.3 milllion in the TTM. It is interesting that even though revenue dipped slightly in 2002 it more than made up for it to maintain the trent in the 2003 year.
During this period, earnings have also fairly steadily improved from a loss of $(4.41) in 1999 to the first profit of $.12/share in 2002, and $.26/share in the trailing twelve months. From the latest quarter results mentioned above, the company is anticipating earnings of about $.70/share in 2005. This also looks nice!
Free cash flow has been less than exciting with $9 million in 2001 dropping to $0 in 2003. The balance sheet is just fine with $14.2 million in cash and $125.7 million in other current assets, enough to easily cover the $110.3 million in current liabilities and the $0 in long-term liabilities.
What about valuation? Looking at
"Key Statistics" on Yahoo.com, we can see that the market cap is a small $368.86 million. The trailing p/e is rich at 55.35, but the forward p/e (fye 31-Mar-05) is downright cheap at 15.99. This is due to the RAPID growth expected. This leaves us with a PEG of 0.80 (anything under 1.0 is great in my humble opinion), and a Price/Sales of 0.83.
Yahoo reports 25.68 million shares outstanding with 21.80 million of them that float. Of these, 8.58% or 1.87 million are out short representing only 1.87 trading days as of 6/7/04. No cash dividend is paid and the last stock split was a 2:1, according to Yahoo, in June, 1996.
How about technicals? Taking a look at a "Point & Figure" chart from Stockcharts.com, we can see:
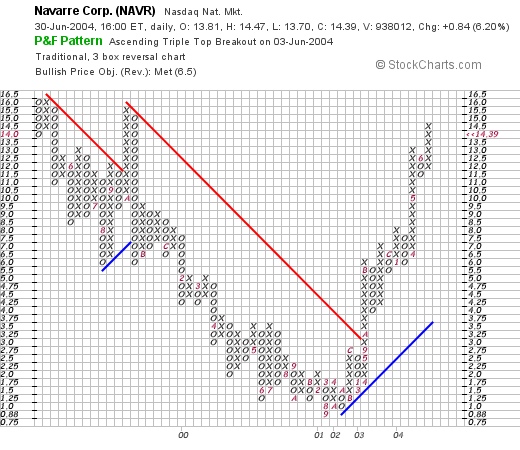
This stock traded steadily lower between May, 1999, from $16/share to a low of $.88 in September, 2001. It has since that time traded steadily higher, and in my humble opinion, the graph looks strong if a bit extended from its support line.
What do I think? I like this stock. If I had some available cash I might just buy a few shares! The revenue and earnings growth looks nice. The free cash flow is marginal...but the balance sheet is just fine. Valuation-wise, the p/e is a bit high, but the company IS growing so fast that the PEG is actually under 1.0. Technically, the chart looks just fine to me.
Anyhow, THAT's NAVR. Thanks so much for stopping by! If you have any questions or comments, please feel free to email me at bobsadviceforstocks@lycos.com
Bob
Posted by bobsadviceforstocks at 10:04 AM CDT
|
Post Comment |
Permalink
Updated: Wednesday, 30 June 2004 10:10 PM CDT
Newer | Latest | Older


