Stock Picks Bob's Advice
Thursday, 2 June 2005
"Revisiting a Stock Pick" Abercrombie & Fitch (ANF)
Hello Friends! Thanks so much for stopping by and visiting my blog,
Stock Picks Bob's Advice. Please always remember that I am truly an amateur investor, so please consult with your professional investment advisors to make sure that all investments discussed on this website are appropriate, timely, and likely to be profitable for you!

Looking through the
list of top % gainers on the NYSE today, I saw that Abercrombie & Fitch (ANF) had made the list. As I write, ANF is trading at $65.12/share, up $7.13 or 12.30% on the day. I do not own any shares of this stock nor do I own any options.
I first
posted ANF on Stock Picks on May 28, 2003 when it was trading at $29.07. Thus, we have a gain of $36.05 on that pick which was made just under two years ago, representing a 124% appreciation in stock price!
According to the
Yahoo "Profile" on ANF, the company "...operates as a specialty retailer of casual apparel in the United States. It operates stores that sell casual apparel for men, women, and kids under the Abercrombie & Fitch, abercrombie, Hollister, and RUEHL brands."
What drove the stock higher today was a
terrific May sales report; the company reported total Company net sales jumped 43%, with total company comparable store sales increasing 29%. Just to get a high single digit same store sales number is great in today's retail climate, but a same store sales number of 29% is incredible!

About two weeks ago, on May 17, 2005, ANF
reported 1st quarter 2005 results. Total company sales for the quarter increased 33% to $546.8 million with a 19% same store sales growth reported for the quarter. Operating income jumped 46% to $68.3 million, and net income per share rose 50% to $.45/diluted share, up from $.30/diluted share in the same quarter in 2004. These were great results!
How about longer-term? Taking a look at the
Morningstar.com "5-Yr Restated" financials, we can see steady revenue growth from $1.2 billion in 2001 to $2.02 billion in the trailing twelve months (TTM).
Earnings have also grown consistently from $1.55 in 2001 to $2.28 in the TTM.
Free cash flow has been positive and growing, albeit not quite as steadily, from $200 million in 2003 to $241 million in the TTM.
The balance sheet is also solid if not overwhelming with $350.4 million in cash and $301.9 million in other current assets; plenty to cover both the $413.9 million in current liabilities and $264.5 million in long-term liabilities.

What about "valuation" and other "key statistics"? Taking a look at
Yahoo "Key Statistics" on ANF, we can see that this is a large cap company with a market capitalization of $5.63 billion.
The trailing p/e isn't bad (imho) at 26.79, with a forward p/e (fye 29-Jan-07) at 17.73. The PEG (5 yr expected) is even nicer at 1.04.
In addition the Price/Sales ratio is 2.32. Withing the "apparel stores" industrial group, ANF is actually the highest Price/Sales stock, with American Eagle (AEOS) at 2.3, Pacific Sunwear (PSUN) at 1.3, Gap (GPS) at 1.1, and Ann Taylor (ANN) at 1.0. So the stock is priced a bit steaper than the competitors....but still look at those same store sales figures!
Taking a look at some other Yahoo statistics, we can see that there are 86.25 million shares outstanding with 85.99 million of them that float. Currently, as of 5/10/05 there are 2.85 million shares out short representing 3.4% of the float or 2.1 trading days of volume. With my arbitrary 3 day cut-off on significance, this doesn't look too bad.
The company does pay a small dividend of $.50/share yielding 0.86%. Yahoo reports the last stock split, a 2:1 split in June, 1999.
What about the chart? Taking a look at the
Stockcharts.com "Point and Figure" chart on ANF:
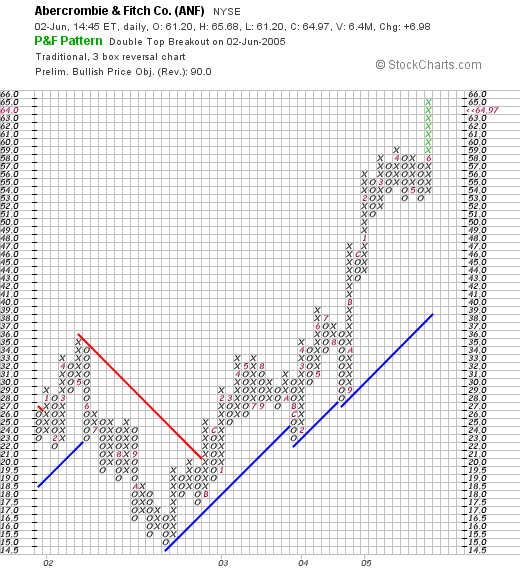
we can see that the stock peaked in May, 2002, around $34/share, then dropped to a low of $15/share in October, 2002. Since that time, the stock has been trading strongly higher and has actually accelerated its ascent since early this year. The graph looks quite strong to me. I can never tell if it is overextended, but the stock is trading above its support line.
So what do I think? Well, I wish I had purchased some of those Abercrombie shares in 2003! I still don't own any :(. The same store sales numbers are incredible! In fact, the 19% same store sales numbers the latest quarter not including this month are also amazing! The last quarter was great, the last five years have been strong, the free cash flow is solid, the balance sheet is great, valuation-wise, the p/e and PEG are where I like them. The Price/Sales is a bit rich next to similar stocks, but I don't think those other stocks are reporting numbers like Abercrombie. And the graph is strong.
There isn't much not to like imho. Now, if I could sell something at a gain, then I could be adding another issue in here :). Oh well. Back to sitting on my hands....waiting.
Thanks again for stopping by. Please feel free to leave any comments or questions right here on the blog or email me at bobsadviceforstocks@lycos.com.
Bob
"Trading Transparency" CMN
Hello Friends! Thanks so much for stopping by and visiting my blog,
Stock Picks Bob's Advice. As always, please remember that I am an amateur investor, so please consult with your professional investment advisor prior to making any investment decisions based on information on this website.
A few moments ago, I unloaded my remaining shares of Cantel Industries (CMN), a great company that apparently disappointed today with their
3rd quarter 2005 earnings results. Cantel came in at $.23/share, which was a penny lighter than the previous quarter and which were $.03/share under estimates.
I did not sell on the news however. I sold on the fact that the stock was down sharply and hit a sale point of mine. These 150 shares had a cost basis of $13.36/share, and I have previously sold four times portions of stocks up to a 120% gain on the shares. They were acquired on 6/4/04, almost exactly a year ago, so they haven't been a bad performer at all in my portfolio.
The 150 shares were sold a few moments ago at $20/share, so I actually had a gain of $6.64/share or 49.7%. This is in addition to the other four partial sales that I have already made on this holding! I sold because my last sale was at the 120% point, and at the current price, CMN is as I write trading at $19.40/share, the stock has dropped below my "trailing 50% of my greatest sale point", that is it dropped below 60% gain level, and my "strategy" requires I unload the stock.
Especially with my margin level, this preserves my gain. However, I shall now be sitting on my hands with the proceeds, waiting for a sale at a gain to add a new position.
Bob
Wednesday, 1 June 2005
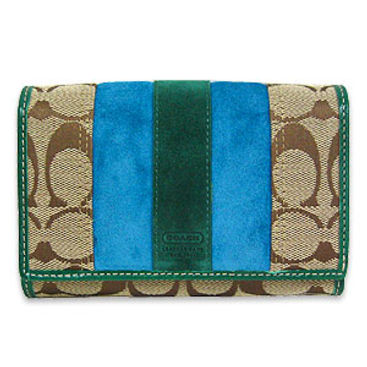
"Revisiting a Stock Pick" Coach (COH)
Hello Friends! Thanks so much for visiting my blog,
Stock Picks Bob's Advice. As always, please remember that I am an amateur investor so please consult with your professional investment advisors prior to making any investment decisions based on information on this website. Only they are qualified to know if investments for you are appropriate, timely, and likely to be profitable!

Looking through the
list of top % gainers on the NYSE today, I was hoping to find a new name for you, but the best stock I could see was an old favorite of mine, Coach (COH), which closed $30.67, up $1.63 on the day or 5.61%. I own shares of COH in my trading portfolio.
I first
posted COH on Stock Picks on June 2, 2003, at a price of $51.53. COH declared a 2:1 split on 10/2/03, and another 2:1 split on 4/5/05. Thus, our pick price was actually $12.88 adjusted for the splits. Thus, the stock has appreciated $17.79 or 138.1% since posting!
According to the
Yahoo "Profile" on COH, Coach "...engages in the design and marketing of American classic accessories in the United States and worldwide. Its primary product offerings include handbags, women's and men's small leather goods, business cases, weekend and travel accessories, outerwear, and related accessories."
On April 26, 2005, COH
reported 3rd quarter 2005 results. Quarterly income grew by 53% to $89.2 million or $.23/share, up from $58.3 million, or $.15/share the prior year. Revenue for the quarter increased 33% to $415.9 million from $313.1 million last year. More amazing, same store sales for the quarter climbed 19.3% (!) with factory store sales up 28.5%, and retail stores climbing 12.9%. The company also guided higher for the quarter increasing revenue targets to $415 million from analysts expectations of $405.7 million and earnings of $.23/share, ahead of analysts expectations of $.22/share for the quarter. This was a beautiful report imho.
How about longer-term? Taking a look at the
"5-Yr Restated" financials from Morningstar.com, we can see what again looks gorgeous to me! First of all, check out the beautiful ramp-up of revenue growth from $.5 billion in sales in 2000 to $1.5 billion in the trailing twelve months (TTM).
Earnings have also consistently been growing from $.24/share in 2002 to $.84/share in the TTM.
Free cash flow has been positive and has been dramatically increasing from $65 million in 2002 to $454 million (!) in the TTM.
Thus, the balance sheet looks gorgeous as well with $526.6 million in cash alone, enough to cover both the $338 million in current liabilities AND the $81.7 million in long-term liabilities combined. In addition, Morningstar.com reports an additional $384.2 million in other current assets.
What about "valuation"? Reviewing
"Key Statistics" for COH on Yahoo, we can see that this is a "large Cap" stock with a market capitalization of $11.57 billion.
The trailing p/e is a bit rich at 33.56 but the forward p/e isn't quite as bad at 25.77 (fye 03-Jul-06). Thus, the 5-yr expected PEG isn't too bad at 1.31.
The Price/Sales ratio is 6.72. On this parameter, Coach is very expensive relative to other companies in the "Textile-Apparel Footwr/Ac" industry group. Nike (NKE) is at 1.6, Timberland (TBL) is at 1.6, Deckers Outdoor (DECK) is at 1.3, and Reebok (RBK) comes in at 0.6.
Other key statistics from Yahoo include the fact that there are 377.12 million shares outstanding with 371.13 million of them that float. Currently there are, as of 5/10/05, 7.89 million shares out short with a short ratio of 2.6 trading days of volume. This represents 2.10% of the float.
No dividend is reported, and as noted above, the last stock split was a 2:1 split just about two months ago on 4/5/05.
What about the chart? Taking a look at the
"Point & Figure" chart from Stockcharts.com:
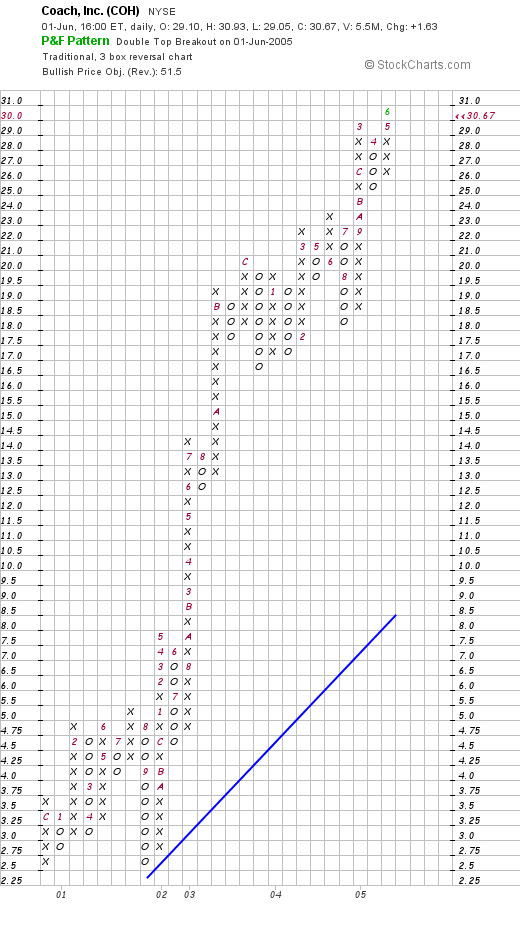
, we can see an absolutely spectacular run from a low of $2.50 in September,2001, to the recent high of $30.67, where it closed today! If anything, the stock looks a bit overextended, trading high above its "support line".
So what do I think? Well, I own the stock at a much lower price and have sold portions of the stock already multiple times for gains. The last earnings report was spectacular with same store sales growth in the high teens (!), the five year Morningstar report is beautiful, with steady earnings and revenue growth, rapidly expanding free cash flow, and a very nice balance sheet.
The valuation questions show that the p/e is just a bit rich, but the Price/Sales puts it way ahead of its peers. The chart is strong but the price is no bargain. I love Coach, but this is not a bargain. But then again, I never claimed to be a value investor!
Thanks again for stopping by and visiting! If you have any questions or comments, please feel free to leave them right here on the blog or email me at bobsadviceforstocks@lycos.com.
Bob
Tuesday, 31 May 2005
"Revisiting a Stock Pick" American Vanguard (AVD)
Hello Friends! Thanks so much for stopping by and visiting my blog,
Stock Picks Bob's Advice. As always, please remember that I am an amateur investor. So please consult with your professional investment advisors prior to making any investment decisions based on information on this website!

I was scanning the lists of top % gainers today on both the NASDAQ and NYSE, but didn't find much to pique my interest. However, taking a look at the list of
top % gainers on the AMEX, I came across an 'old name', American Vanguard (AVD) that as I write is trading at $18.00, up $.82 or 4.77% on the day.
I first
posted American Vanguard on Stock Picks on December 29, 2003, when it was trading at $38.69. AVD has had two stock splits since that post: a 3:2 split on 4/19/04, and a 2:1 split on 4/18/05, making our effective pick price actually $12.90, thus the stock has actually gained $5.10 or 40% since being "picked" on the blog! Unfortunately for me, I never purchased any of these shares, and do not currently own any shares or options on this company.
According to the
Yahoo "Profile" on AVD, American Vanguard "...operates as a diversified specialty and agricultural products company. It develops and markets products for crop protection and management, turf and ornamentals management, and public and animal health. The company provides chemicals that include insecticides, fungicides, molluscicides, growth regulators, and soil fumigants...."

As my regular readers will note, one of my first "screens" in picking a new stock is to check the latest quarterly result. Simply put, I am looking for increasing earnings in conjunction with growth in revenues as well!
On May 5, 2005, AVD announced
1st quarter 2005 results. For the quarter ended March 31, 2005, net sales rose 20% to $41.2 million, net income was up 42% to $3.1 million or $.16/diluted share, from $2.2 million, or $.12/diluted share the prior year. This was a solid quarter for the company!
Having established that the latest quarter was great, I move on to Morningstar.com and try to see if the company has been doing well for the last few years as well. Why is this important? It is my experience, that a company may well have an overall momentum. That is, if the company is doing well the last several years, did well the latest quarter, it is probably more likely than random chance, to continue to do well! Whether this is due to the particular niche the company sits in, the management, or a combination of many other factors is not material to me.
On Morningstar, I have been using the page where the "5-Yr Restated" finances are located. For AVD, this is located
here.

Looking at this Morningstar page, we can start at the top and review the revenue growth. This is illustrated as a series of purple "bars" on a chart, which moving from left to right, shows the progression in revenue growth from $78 million in 2000 to $150.9 million in the trailing twelve months (TTM).
This consistent revenue growth is quite impressive!
What about the earnings? A few lines lower, we can see that earnings/share have grown
consistently from $.24/share in 2000 to $.76/share in 2004. Again a pretty picture!
In fact, this company even pays a dividend, and has been increasing its dividend from $.01/share in 2000 to $.03/share in 2001, $.04/share in 2002, $.05/share in 2003 and $.07/share in 2004. The fact that this company, as small as it is, pays a dividend and has been increasing its dividend regularly makes the stock attractive as well!
What about "free cash flow". I am not an accountant, but in simple terms, I understand this to be the amount of real "cash" that this venture is producing. I insist on positive free cash flow in stocks I like, and if possible, growing free cash flow. AVD was free cash flow even at $0 in 2002 and 2003, but had $7 million in free cash flow in 2004.
The last bit of data I use on this Morningstar sheet is a look at the balance sheet. Again, I am
not an accountant but my understanding of entries is that assets are things that you
own and liabilities are things that you
owe! Current means that they are either due or available within 12 months, and long-term means the same but greater than 12 months.
For my purposes, I love seeing lots of assets and very little liabilities :). I prefer to see lots of cash, but if there are lots of current liabilities, this is almost as good.
In AVD's case, the balance sheet on Morningstar shows $500,000 in cash and $73.6 million in other current assets. This is balanced agains $37.6 million in current liabilities (easily covered), and $20.6 million in long-term liabilities. Clearly the current assets are significantly larger than both the current liabilities
and the long-term liabilities combined! This is a plus for me.
My next step in looking at a stock is to think about "valuation". There are many ways to "value" a stock. I look at three basic indicators for this blog, the P/E which is the Price compared to the Earnings on a trailing basis, the PEG, and the Price/Sales ratio.
The less you have to pay for a given amount of earnings, the more "value" you have in each stock purchased. Thus, the lower the P/E, in general, the better the value.
However, in a growth stock, if the next year and the year after is anticipated to bring HUGE earnings growth, then obviously, an investor will be more willing to pay for a stock with less significant current earnings results. Thus, we have the PEG ratio, which looks at the earnings growth rate, relative to the P/E. For instance, if a stock is
estimated to be growing at 25%/year in earnings the next five years, and the P/E is 25, then the PE/G or PEG ratio would be 1.0. I hope you follow!
For AVD, we can check the
Yahoo "Key Statistics" on American Vanguard. Here we can see that this is a small cap stock (under $500 million) at a capitalization of $326.33 million. (Market capitalization is calculated by figuring out the value of the entire company if you multiplied the current price/share by the number of shares outstanding).
The P/E is moderate at 22.35, with a forward p/e of 17.90 (fye 31-Dec-06). No PEG is reported. I suspect that this is due to the small size of this company and the relatively limited number of analysts who probably follow this stock.
Price/Sales is 1.98. This ratio is calculated by dividing the entire sales of the company by the number of shares. This is a valuation statistic that is most useful when comparing the company to other companies similar to it. In other words, other companies in the same "industry group".
I use information from my Fidelity.com account to get other companies in the same group. And actually, AVD is a bit "pricey" relative to the other companies in the "Agricultural Chemicals" group. Syngenta (SYT) is at 1.6, Scotts Miracle-Gro (SMG) is at 1.1, Agrium (AGU) is 0.9, Central Garden (CENT) is at 0.7 and Bunge (BG) is cheapest at 0.3.
Yahoo also shows that there are 18.23 million shares outstanding. 1.76 million of these shares are out short (as of 4/12/05). Yahoo states this is 204.60% of the float...but that doesn't make much sense imho. However, the short ratio is still gigantic at 38.1, with my 3.0 days as being significant. If we are in the midst of a "short squeeze" with 27,281 shares on average being traded....we could really see this stock price spike!
As I have noted, this stock does pay a small dividend of $.16/share yielding 0.88%, and the last stock split was just last month when the stock split 2:1 on 4/18/05.
How about "technicals"? I prefer the "point & figure" charts from Stockcharts.com. These charts give a feeling for the ebb and tide of a stock price, that is the 'o's' show declines in stock price and the 'x's' show increasing stock prices.
The
AVD "point & figure" chart:
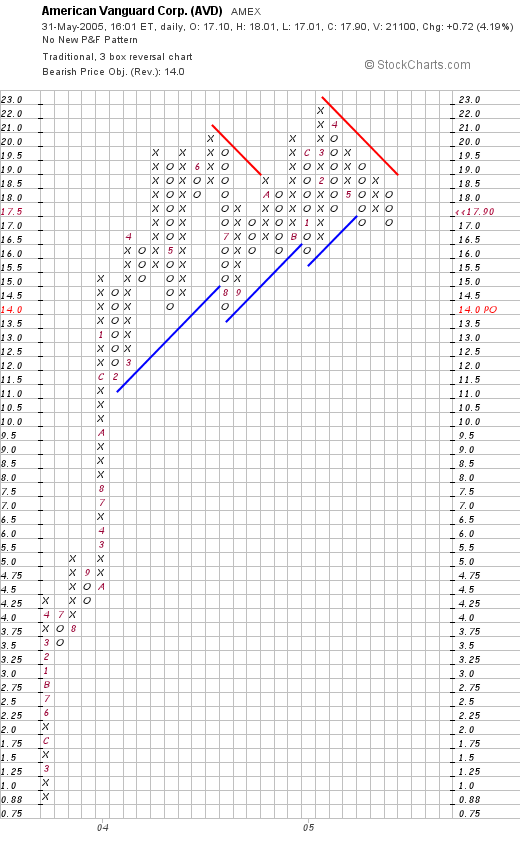
the chart looks strong with a large run up from $.88/share in March, 2003, to the current $18.00 level. I am not a technician, but just like I prefer growing companies, I prefer to see charts that appear to be moving higher in a steady fashion!
So what do I think? Well, this is not exactly what I would call a "green" stock, insofar as environmental issues are concerned, but the company looks green to me insofar as generating lots of $'s in both revenue, growth, and free cash flow! The valuation appears reasonable, although the Price/Sales ratio puts it at the top for valuation in its group. There is also an amazing # of shares out short....either they know something that I don't or they are going to be hustling trying to find a share to buy to cover their pre-sold shares! The chart also looks strong.
If I were in the market to buy a new position, this would be the type of company I would be adding to my own portfolio!
Thanks so much for stopping by! I hope that my more indepth explanation was helpful for some of you and didn't bore the rest of you to tears. :).
If you have any comments, questions or words of encouragement, please feel free to email me at bobsadviceforstocks@lycos.com.
Bob
Sunday, 29 May 2005
"Looking Back One Year" A review of stock picks from the week of April 5, 2004
Hello Friends! Thanks so much for stopping by and visiting my blog,
Stock Picks Bob's Advice. As always, please remember that I am an amateur investor so please consult with your professional investment advisors prior to acting on any information on this website.

I came across this World War II vintage war poster on the Illinois State Museum website.
I hope you are all having a happy and healthy Memorial Day Weekend. We should all pause this weekend and remember all of the men and women who have served this country in our nation's history. And the many who are serving in harm's way even as I write!

Since it is the weekend, it is time to do a little reviewing around here. If you are new to this website, I like to pick lots of stocks, some of which I do add to my own portfolio, but most, I just present for consideration and my own observations as they fit many of the criteria that I use to pick stocks! In order to get a feeling for what actually happened to the many stocks mentioned here, I use the weekend to review my past stock ideas. I am a little more than a year out from my reviews.
This simple analysis depends on a "buy and hold" strategy. Simply put, I am assuming that I purchased each of the stocks I discussed at the mentioned price, and I am assuming I still hold those same stocks. In reality, I actually stop out of my stocks at an 8% loss on the downside and sell portions of my stocks on the upside as they make targeted gains. Thus, in practice, my own actual performance would be different than what I am now reviewing!
During the week of April 5, 2004, I posted two stocks: Juno Lighting on April 7, 2004, and ValueClick (VCLK) on April 8, 2004.
 JUNO was selected on April 7, 2004, at a price of $33.50. JUNO closed at $39.97 on 5/27/05, for a gain of $6.47 or 19.3%.
 On March 24, 2005, JUNO reported 1st quarter 2005 results. For the three months ended February 28, 2005, revenue jumped 20% to $60.8 million from $50.9 million. The company earned $1.5 million or $.48/share, up from $493,000 or $.19/share the prior year. These were solid results with both strong revenue and earnings growth reported!
 I selected ValueClick for Stock Picks on April 8, 2004, when it was trading at $12.16. VCLK closed at $10.69 on 5/27/05, for a loss of $(1.47) or (12.1)%.
 On May 4, 2005, VCLK reported 1st quarter 2005 results. Revenue grew nicely to $51.4 million from $38.7 million the prior year. However, earnings came in at $8.7 million, or $.10/share, down from $13.4 million or $.16/share the prior year.
So how did we do with these two selections on Stock Picks? Juno was up 19.3% from the pick price, and ValueClick was down (12.1)% from the selection price, thus the average performance of these two was a gain of 3.6%.
I just haven't had much luck with those small dot-com stocks! Thanks again for stopping by! If you have any questions or comments, please feel free to email me at bobsadviceforstocks@lycos.com.
Again, I am wishing all of you a happy and safe Memorial Day Weekend!
Bob
Thursday, 26 May 2005
"Revisiting a Stock Pick" Michaels Stores (MIK)
Hello Friends! Thanks so much for stopping by and visiting my blog,
Stock Picks Bob's Advice. As always, please remember to consult with your professional investment advisors, as I am truly an amateur investor, prior to making any investment decisions based on information on this website.

Looking through the
list of top % gainers on the NYSE today, I came across Michaels Stores, which as I write, is trading at $41.25, up $1.73 or 4.38% on the day. I do not own any shares or options on this stock.
Michaels (MIK) is an old favorite of mine here on Stock Picks, even though I haven't made the plunge and purchased any shares (I can't own EVERYTHING :)!) I first
posted Michaels Stores (MIK) on Stock Picks on August 28, 2003, when it was trading at $43.01. MIK closed at $22.38 on that day, adjusted for a 2:1 stock split on 10/13/04, our stock pick price was actually at $21.51. Thus, the stock has appreciated nicely since my original post.

According to the
Yahoo "Profile" on MIK, Michaels "...is a national arts and crafts specialty retailer providing materials, ideas and education for creative activities." I know about Michaels personally, because that is one of the places I go to for all of my kids' projects at school!
Taking a look at the
1st quarter 2005 results report, which came out after the close yesterday, we can see that for the first quarter ended April 30, 2005, total sales increased 13.1% to $821.0 million from $725.9 million the same quarter the prior year. Same-store sales grew 7.8% for the quarter, a super result! Net income increased 58.6% to $46.5 million from $29.3 million the prior year, and diluted earnings per share jumped 57.1% for the quarter to $.33/share vs $.21/share in the same quarter in 2004. I almost wish I had reviewed
this stock prior to buying the GCO....oh well.

How about longer-term results? Taking a look at the
"5-Yr Restated" financials on Morningstar, we can see that revenue has grown steadily from $2.2 billion in 2001 to $3.4 billion in the trailing twelve months (TTM).
Earnings during this period have consistently been growing from $.58/share in 2001 to $1.45 in the TTM.
Free cash flow, which was a bit weak in 2003 at $1 million, has grown fabulously, to $337 million in the TTM.
The balance sheet is solid with $586.2 million in cash and $985 million in other current assets. This is plenty to cover both the $511.9 million in current liabilities and the $302.6 million in long-term liabilities as reported by Morningstar.com.

How about "valuation"? Checking
"Key Statistics" from Yahoo on MIK, we can see that this is a large cap stock with a market capitalization of $5.59 billion. The trailing p/e is nice at 22.87, with a forward p/e (fye 29-Jan-07) even nicer at 19.58. Thus, with the nice growth rate, we have a "5 yr estimated" PEG at 1.09, barely over parity (1.0).
The price/sales for MIK is 1.58. However, if we look at other stocks in the "Toy & Hobby Stores" Industry Group, we can see that the stock is moderately priced, under the 1.8 price/sales of Build-a-Bear Workshop (BBW), but above the 0.8 price/sales of Brookstone (BKST), and the 0.5 price/sales ratio of Toys R Us (TOY).
Other points on Yahoo reveal that there are 135.28 million shares outstanding with 125.80 million that float. As of 5/9/05, there were 3.26 million shares out short, up significantly from the 2.04 million our short the prior month. This represents 3.247 days of trading or only 2.59% of the float. I don't think this is a big factor moving this stock in any particular direction.
The company does pay a small dividend of $.40/share yielding 1.02%. The last stock split, as noted earlier, was a 2:1 split on 10/13/04.
How about the chart? Taking a look at the
"Point & Figure" chart on MIK from Stockcharts.com:
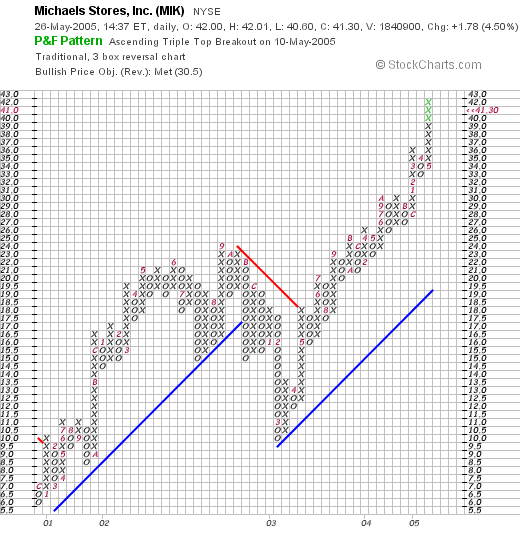
we cam see that this stock was moving higher from $6.00/share in January, 2001, to a peak of $25/share in September, 2002. The stock then pulled back to $10.50 in March, 2003, and has moved strongly higher since. The stock chart looks strong to me!
So what do I think? Well, how do I love thee, let me count the ways :). First, the stock moved higher today. That's a given! This was due to a GREAT stock report released yesterday after the close. Both revenue, earnings, and same-store sales growth were strong. The company has consistently been growing its revenues and earnings. Is generating large amounts of free cash, and has a solid balance sheet. Valuation is reasonable with a PEG just over 1.0, and the price/sales is moderately priced. Finally, the chart looks great.
This is certainly a stock I would be buying if I did have a buy signal, and hadn't already bought some GCO, although I like the numbers on GCO as well!
Please remember that I am an amateur, so do your own investigation, check with your financial advisors, and take all necessary precautions prior to investing based on anything on this website!
If you have any comments, questions, or words of encouragement, please feel free to email me at bobsadviceforstocks@lycos.com.
Bob
"Trading Transparency" Genesco (GCO)
Hello Friends! Thanks again for stopping by and visiting my blog,
Stock Picks Bob's Advice. As always, need I repeat?, please remember that I am an AMATEUR investor so PLEASE consult with your professional investment advisors prior to making any investment decisions based on information on this website.
As you may know, if you are reading my previous post, I just sold some shares of AFFX at a 30+% gain, thus entitling me to add a new position, #24.
My goal is a 25 position portfolio, and I use an internal portfolio signal to add a position. Simply put, if I sell a portion of one of my holdings at a gain, I use this sale as a signal that the market is acting in a "bullish" fashion and that I can, if I am under my 25 position limit, add a position.
Getting to the point, a few moments ago I purchased 200 shares of Genesco (GCO) in my trading account at $34.36/share. I have previously reviewed GCO on this blog, and can do an update later, if I get a chance :). Genesco made the list of top % gainers today, a first requirement for any stock pick, and as I write, is trading at $34.45, up $3.05 or 9.71% on the day.
GCO reported solid earnings and revenue growth with solid same store sales growth (they are a shoe retailer), and raised guidance. That is a positive signal imho.
Thanks again for visiting. If you have any comments, or questions, please feel free to email me at bobsadviceforstocks@lycos.com.
Bob
Posted by bobsadviceforstocks at 12:42 PM CDT
|
Post Comment |
Permalink
Updated: Thursday, 26 May 2005 12:52 PM CDT
"Trading Transparency" Affymetrix (AFFX)
Hello Friends! Thanks so much for stopping by and visiting my blog,
Stock Picks Bob's Advice. As always, please remember that I am an amateur investor, so please consult with your professional investment advisor prior to making any investment decisions based on information on this website.
My Affymetrix (AFFX) stock hit the first targeted sale point at a 30% gain earlier today. I sold 40 shares of my 160 share position a few moments ago at $53.38. They were purchased earlier this year on 1/27/05 with a cost basis of $40.98. Thus, I had a gain of $12.40/share or 30.3%. My next targeted sale of 1/4 of my holdings (30 shares) would be if it declines back to break-even on the downside or at a 60% gain on the upside. Wish me luck!
Since I am at 23 positions, under my goal of a 25 position portfolio, this "entitles" me to add a new position, and I can tell you, that that nickel is already burning a hole in my pocket! :)
Thanks again for stopping by! If you have any questions or comments, please feel free to email me at bobsadviceforstocks@lycos.com.
Bob
Tuesday, 24 May 2005
May 24, 2005 Forward Industries (FORD)
Hello Friends! Thanks so much for stopping by and visiting my blog,
Stock Picks Bob's Advice. As I always do, I would like to remind you that I am truly an amateur investor, so PLEASE consult with your professional investment advisors before making any investment decisions based on information on this website. I cannot be responsible for any losses you incur trading ideas found here, nor shall I ask for any portion of your gains that you may accrue!

Scanning through the
list of top % gainers on the NASDAQ, I came across Forward Industries (FORD). I have looked at this company before, although I do not believe I have ever posted anything here. This is a very small company, and try as I did to ignore it, the stock has repeatedly been showing up in the top % gainers list. I do not own any shares or options on this company.
FORD is having a good day today, trading at $20.43, up $1.14 or 5.91% on the day as I write. According to the
CNN.Money "Snapshot" on FORD, the company's "...principal activity is to design, manufacture and market customized soft-sided carrying cases made from leather, nylon, vinyl and other synthetic fabrics. The products are utilized for transporting portable electronic products such as cellular telephones, medical instruments and computers."

What has been the driving force, imho, in moving the stock higher was the
2nd quarter 2005 earnings report released for Forward Industries on April 21, 2005. Net sales for the quarter jumped 125% to $11.24 million, net income quadrupled to $2.02 million or $.27/diluted share from $490,000, or $.08/diluted share in the same quarter a year ago!
How about a longer-term assessment? Looking at the
"5-Yr Restated" financials on Morningstar.com, we can see that revenue has grown from $14.4 million in 2000 to $30.7 million in the trailing twelve months (TTM).
Earnings, while erratic, have grown from $.01/share in 2000 to $.67/share in the TTM.
Free cash flow, while small, has stayed positive at $1 million in the trailing twelve months. The balance sheet also looks great with $5.3 million in cash and $10.1 million in other current assets balanced against $3.5 million in current liabilities and NO long-term liabilities at all reported on Morningstar.com.
What about some "valuation" statistics on this stock? First of all, looking at
Yahoo "Key Statistics" on Forward Industries (FORD), we can see that this is truly a micro-cap stock with a market capitalization of only $140.03 million. The trailing p/e is 30.84, but no PEG is listed, probably because there are no easily available estimates for future earnings! Price/sales is 4.25.
Yahoo reports 6.78 million shares outstanding with 6.30 million that float. As of 4/8/05, there were 581,000 shares out short representing 9.22% of the float or 0.468 trading days of volume. Since I use an arbitrary 3 day figure for significance, this isn't a large short-interest on this stock.
There are no cash dividends reported by Yahoo and no stock split is reported either.
What about "technicals"? Taking a look at a
"Point and Figure" chart on FORD from Stockcharts.com:
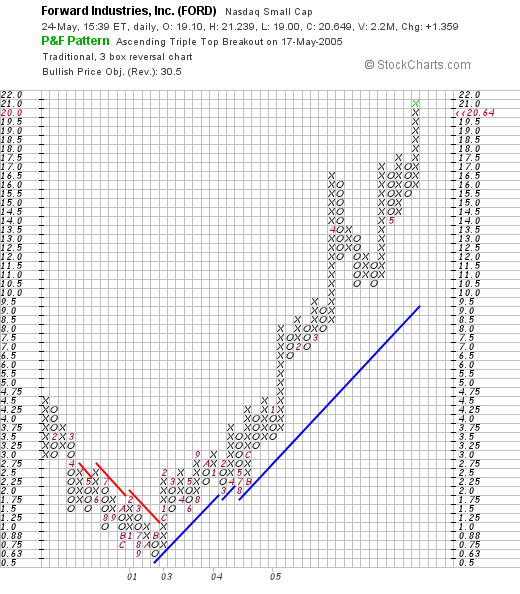
you can see that this stock, which was trading lower through 2000, and into 2001, bottomed at about $.63/share, and has traded higher since August, 2002, climbing in a rather impressive fashion to its current levels at around $22/share!
So what do I think? Well, it is a terribly small company with a market cap under $200 million. However, the numbers reported in the last quarter were very impressive. I know nothing about their business and am concerned about the questions about "moats" that the Morningstar.com folks like to discuss, but on face value, the past five years have shown rather steady growth in revenues and earnings, the free cash flow while small is positive, the balance sheet is solid, and the graph looks great!
On the downside, a tiny stock like this is prone to volatility, so I certainly would be cautious and be aware of all the risks before jumping into a stock like this!
Thanks so much for stopping by and visiting! If you have any questions or comments, please feel free to leave them here on the blog or email me at bobsadviceforstocks@lycos.com.
Bob
Monday, 23 May 2005
May 23, 2005 Dynamic Materials (BOOM)
Hello Friends! Thanks so much for stopping by and visiting my blog,
Stock Picks Bob's Advice. As always, please remember that I am an amateur investor and that you need to consult with your professional investment advisors prior to making any investment decisions based on information on this website.

I was looking through the
list of top % gainers on the NASDAQ today and realized that Dynamic Materials Corporation (BOOM) had made the list by gaining $6.25 or 19.91% on the day, to close at $37.64/share. I do not own any shares nor any options on this stock.
According to the
Yahoo "Profile" on BOOM, Dynamic materials "...is engaged in the explosive metalworking business, which uses explosives to perform metal cladding and shock synthesis. The Company's explosive metalworking business includes the use of explosives to perform metal cladding and shock synthesis of industrial diamonds."
On May 5, 2005, BOOM
reported 1st quarter 2005 results. Sales for the quarter ended March 31, 2005, increased 72% to $17.5 million from $10.2 million in the same quarter in 2004. Net income increased 692% to $1.6 million, or $.28/diluted share vs. net income of $.2 million or $.04/diluted share in the year ago quarter. These were phenomenal results!
How about longer-term? Taking a look at the
"5-Yr Restated" financials on Morningstar.com, we can see a nice progression in revenue from $24 million in 2000 to $62 million in the trailing twelve months (TTM). Earnings have been a bit more erratic, improving from a loss of $(.43)/share in 2000 to $.77/share in the TTM.
Free cash flow has been positive if not growing at $4 million in 2002, and $4 million in the TTM.
The balance sheet on Morningstar looks solid with $1.5 million in cash and $22.2 million in other current assets, balanced against $12.3 million in current liabilities and $6.6 million in long-term liabilities.
What about "valuation"? Looking at
Yahoo "Key Statistics" on BOOM, we can see that this is a very small company with an almost microcap capitalization of $205.78 million. The trailing p/e is a bit rich at 37.27. No estimates are noted on Yahoo for any forward p/e. The Price/Sales is 2.79.
This P/S ratio puts it at the top of the "Industrial Metals/Minerals" industry. Other stocks includ Inco (N) with a Price/Sales of 1.6, Massey Energy (MEE) at 1.5, Consolidated Energy (CNX) at 1.5, Peabody Energy (BTU) at 1.5, and Arch Coal (ACI) at 1.4. Thus, BOOM is the most expensive of the stocks in this particular industrial group by this measurment of "value".
Other "Key Statistics" from the Yahoo site of note include the number of shares, small at 5.47 million, with only 2.60 million of them that float. Currently there are 758,000 shares out short (as of 4/8/05), representing 29.15% of the float, but only .282 trading days of volume. Thus, the short sales don't appear to be too significant.
No cash dividend and no stock split is reported on Yahoo.
How about a chart? If we take a look at the
Stockcharts.com chart on BOOM:
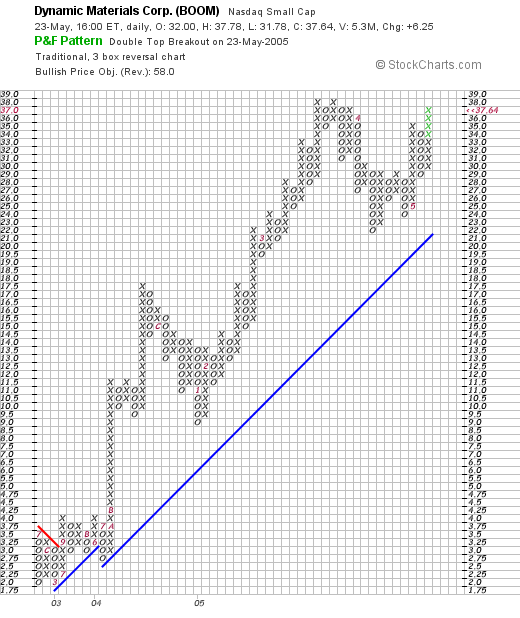
we can see, in my simplistic technical skills, that the stock chart looks exceptionally strong as this stock marches ahead above its support line since July, 2004, when it bottomed at around $2.50/share, and has subsequently soared to its $37.64 level today.
In conclusion, this stock made a large move higher today, the last quarter results were spectacular, I do not have any idea about estimates going forward, but both revenue and earnings growth was solid in the latest report. The last five years have shown fairly steady growth in both revenue and earnings, with positive free cash flow and a solid balance sheet. Valuation is a bit steep, both with a p/e that is a bit high, and a price/sales ratio placing the stock ahead of its peers. Finally the chart looks exceptionally strong.
Going against BOOM is the very small nature of this company with the limited liquidity resulting in possible volatility. However, with good news, I have found that stocks with solid results, like TASR, end up being "rockets" with prices soaring into the stratosphere!
Thanks again for stopping by! If you have any questions, comments, or words of encouragement, please feel free to email me at bobsadviceforstocks@lycos.com.
Bob
Newer | Latest | Older


