Stock Picks Bob's Advice
Friday, 21 May 2004
May 21, 2004 Marvell Technology Group (MRVL)
Hello Friends! Thanks as always for taking the time to stop by and read my blog. I mean if you guys didn't come and visit, there would be NO reason for me to be writing. Remember, though, as polished as I try to make this blog, that I am an AMATEUR investor, that you need to do your own research on all investments discussed on this blog prior to making any investment decisions, and that you need to discuss these decisions with a PROFESSIONAL investment advisor who can let you know whether they are appropriate, timely, and even likely to be profitable for you!
I came across Marvell Technology Group (MRVL) today on the list of greatest gainers.

As I write, MRVL is trading at $42.99, up $3.16 on the day or 7.93%. According to Yahoo, Marvell "...is a global semiconductor provider of high-performance analog, mixed signal and digital signal processing integrated circuits." Clearly this is NOT one of those Peter Lynch kind of investments that your daughter happened to bring home from the mall!
But their numbers look great to me, so let's take a closer look!
Yesterday, Marvell
reported 1st quarter 2005 results. Net revenue came in at $269.6 million, a 60% increase over the net revenue of $168.3 million in the same quarter in 2004...and an 11% sequential increase from the net revenue of $243.3 million, the prior quarter. Net income (GAAP), came in at $14.5 million, or $.10/diluted share vs. $4.4 million, or $.03/dilued share the prior year. These are nice numbers!
If we look at
Morningstar "5-Yr Restated" financials, we can see that revenue has grown explosively from $21.3 million in 1999, to $727.3 million in the trailing twelve months. It really is a pretty series of bar graphs!
Earnings have improved from losses of $(3.55) in 2001, $(3.63) in 2002, to a profit this past year. Free cash flow has also improved from $0 in 2001, to $25 million in 2002, $12 million in 2003, and $92 million in the trailing twelve months.
The balance sheet as presented by Morningstar.com is gorgeous (!) with $400.3 million in cash, more than twice the amount of Current Liabilities ($164.8 million) and Long-Term Liabilities ($55.2 million) combined. In addition, MRVL has another $213.8 million of OTHER current assets. This company is quite solvent in my humble opinion.
What about "valuation"? Looking at
"Key Statistics" on Marvell, the company has a pricey trailing p/e of 133.46...due to the fact that they are JUST turning profitable....yet the growth is so fast that the forward p/e (fye 31-Jan-06) is modest at 24.99. Thus the PEG is downright cheap at 0.77. (anything under 1.0 on a PEG is cheap imho.) The price/sales is rich at 6.42 however.
There are 132.23 million shares outstanding per Yahoo, with 62.40 million of them that float. Of these, 8.89 million are out short as of 4/7/04, representing 2.982 trading days or 14.25% of the float. This is DOUBLE the short interest of 4.40 Million from the prior month. These shares NEED TO BE COVERED....and the price rise on good news might just be a bit of a "short squeeze" in here.
No cash dividend is paid, and Yahoo does not report any stock splits.
What about technicals? If we look at a recent Point & Figure chart on MRVL:
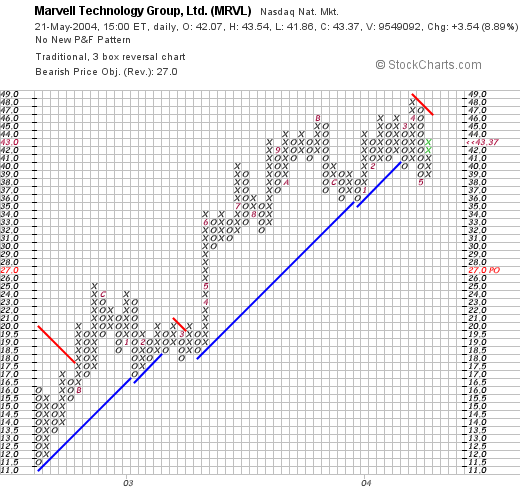
we can see what looks like a possible breakdown in price recently through a support level at about $42 in late April, 2004. However, the stock is moving higher at this point, and I do not see the long-term trend interrupted. However, please review the chart yourself as I am certainly a NOVICE technician!
What do I think? I like this stock. The revenue growth is fabulous. The earnings are growing nicely. The company is generating lots of free cash on an already beautiful balance sheet. The trailing p/e IS a bit rich (over 100 lol), but with a PEG under 1.0, the anticipated growth in a company that is just turning profitable, makes the p/e tolerable in my opinion. Technically, it doesn't look too bad.
I just don't have any cash to invest...am down to 19 positions...will need to update that trading portfolio soon....but am waiting for one of my 19 to hit a sell point on GOOD news....but that is an OLD story....Meanwhile, I am sitting on my hands!
Thanks again for stopping by! If you have any comments, suggestions, questions, or words of encouragement, please email me at bobsadviceforstocks@lycos.com
Have a GREAT weekend everyone!
Bob
Thursday, 20 May 2004
May 20, 2004 Petsmart (PETM)
Hello Friends! Thank you so much for stopping by. Each day I scan the lists of advancing stocks looking for something I can share with YOU! And when you come visit, and my hit-counter goes up a notch, I am grateful for your interest! As always, please remember that I am an amateur investor so please always do your own investigation of all stocks on this website before making any purchase or sell decisions, and consult with your professional investment advisor.

I came across Petsmart (PETM) on the greatest percentage gainers in a relatively flat market today. I do NOT own any shares of this nor do I have any leveraged positions. PETM had a nice day today closing at $28.40, up $2.14 or 8.15% on the day. According to Yahoo, Petsmart, or PETsMART as it is sometimes written, "...is a provider of products, services and solutions for the lifetime needs of pets in North America. It operates 643 retail stores in North America."
And guess what? EARNINGS RESULTS drove the price higher today. I strongly believe that good earnings and revenue growth drive a stock higher in price over both the short and the long-term. They
reported 1st quarter results today for the quarter ended May 2, 2004. Sales were up 14.5% to $796.3 million and earnings rose to $35.8 million or $.24/share from $24.6 million or $.17/share a year earlier. These are nice results in my opinion.
If we look at the
Morningst.com "5-Yr Restated" financials, we can see that revenue growth has been steady since 1999 when it was $2.1 billion, and has grown to $2.9 billion in the trailing twelve months. Earnings have been a bit erratic dropping to a loss of $(.28)/share in 2001, but have improved steadily since then to a level of $.73/share in the trailing twelve months. Free cash flow has also been steadily positive (is that good English???), with $66 million reported in 2001, $85 million in 2002, $59 million in 2003 and $40 million in the trailing twelve months.
The balance sheet looks great with $234.3 million in cash and $428.1 million in other current assets, more than enough to pay off BOTH the current liabilities of $317.0 million AND the long-term liabilities of $202.6 million combined.
Looking at
"Key Statistics" on Yahoo Finance, we can see that PETM is a large cap stock with a market cap of $4.10 billion. The trailing p/e isn't bad at 29.99, and the forward p/e (fye 1-Feb-06) is even nicer at 20.14. The stock is reasonably priced, in my opinion, with a PEG of 0.93, and a price/sales of only 1.27.
Yahoo reports that there are 144.36 million shares outstanding with 142.40 million of them that float. Currently there is a significant short interest, as of 4/7/04 per Yahoo, of 6.12 million shares, almost a million more shares out short than the prior month. This represents 5.393 trading days or 4.30% of the float. The current stock rise may well represent a bit of a short "squeeze".
The stock DOES pay a small dividend of $.12/share yielding 0.46%. No stock split is reported on Yahoo.
If we look at a recent Point and Figure chart on Petsmart:
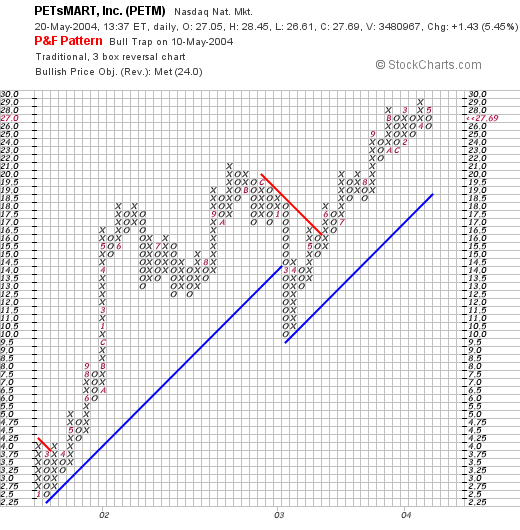
we can see that the stock has actually been heading higher faily steadily since late 2001, and broke through a support level in March 2003, only to advance again to a higher level in a fairly uninterrupted fashion. I do not think my description is highly un-sophisticated....but you can look at the chart and see for yourself!
So what do I think? I like PETM a lot. Of course I don't have any money to buy any shares (LOL)...but the earnings results are nice, the valuation is excellent with a p/e under 30...but a PEG under 1.0! The balance sheet is superb, and the company continues to generate generous amounts of free cash.
If you have any questions, comments, or words of encouragement, please feel free to email me at bobsadviceforstocks@lycos.com Please also spend time with the little calendar in the upper left part of the page and look through the pages and pages of past posts....as the old Ronald Reagan joke goes, "There must be a pony in there somewhere!" Have a great Thursday evening everyone!
Bob
Wednesday, 19 May 2004
May 19, 2004 Advanced Neuromodulation Systems (ANSI)
Thanks so much for stopping by! The trading portfolio is doing a bit of a recovery today as the market improves....two days does not make a bull market...but maybe after a third? As always, please remember to consult with your investment advisors and do your own due diligence on all stocks discussed on this website!

Scanning through the lists of greatest gainers today, I came across Advanced Neuromodulation Systems (ANSI). I do not own any shares of this stock nor do I have any options or leveraged positions. ANSI is trading, as I write, at $33.03, up $3.56 on the day or 12.08%. According to Yahoo.com, ANSI "...designs, develops, manufactures and market advanced implantable neuromodulation devices that improve the quality of life for people suffering from chronic pain."

This morning, ANSI
announced 1st quarter 2004 results. For the three months ended March 31, 2004, revenue increased 35% to $26.6 million from $19.6 million the prior year. Net income for the quarter increased 51% to $4.0 million or $.19/diluted share from $2.6 million or $.13/diluted share last year. Bottom line, this company had a terrific quarter and the stock price has responded accordingly!
If we look at a
"5-Yr Restated" financials from Morningstar.com, we can see a fairly impressive and steady growth in revenue from $23.4 million in 1998 to $83.6 million in the trailing twelve months. The company, extrapolating the just reported revenue figures, is operating at a $100 million/year rate for 2004.
Earnings dipped from $.46/share in 1998 to $.06/share in 2000, but have increased steadily and dramatically since then.
Free cash flow which was negative at $(1) million in 2000, has turned positive at $1 million for the trailing twelve months.
The balance sheet is gorgeous! With $96.6 million in cash alone enough to cover the current liabilities of $7.7 million AND the long-term liabilities of $5.4 million, about EIGHT TIMES OVER! And they also have $39.8 million in OTHER current assets. This part of the equation is a "no-brainer".
If we look at
"Key Statistics" from Yahoo, we can see that the Market Cap is a small $659.97 million with a trailing p/e of 47.35 which sounds rich, but the company is growing so fast that the forward p/e (fye 31-Dec-05) is only 27.97. Thus, the PEG is at 0.91...making valuation less of a problem. Price/sales is also a bit rich at 6.01.
Yahoo reports 20 million shares outstanding with 18.60 million of them that float. There are a good number of shares out short, with 2.25 million reported as of 4/7/04, representing 12.11% of the float or 3.798 trading days. This is at a level, that with good news, as we got today, we may see a bit of a panic, or squeeze, as the short-sellers scramble to cover their shorts.
Yahoo does not report any cash dividend and the last stock split reported was a 3:2 split in July, 2003.
If we look at the ANSI Point & Figure graph:
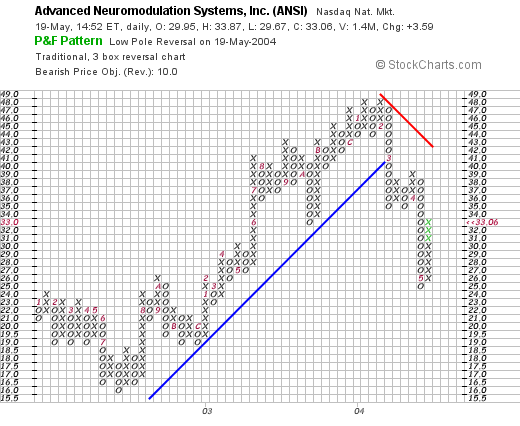
we can see that this stock was trading quite nice between August, 2002 and February, 2004, and actually has broken down from its recent support level of $40. Technically, imho, would like to see the stock break through its resistance level at around $41 before reporting its "technical good health"....but then again, I am but an amateur in reading these charts so you may have a different take in this matter!
What do I think. Well, if I didn't have some trading rules REQUIRING ME TO SIT ON MY HANDS, I would probably be picking up some of these shares. However, I still have lots of margin and my trading rules demand that I sell some stock at a targeted gain before adding another position. Oh well, but that is old news to you of course!
Thanks so much for stopping by and visiting! If you have any comments, questions, or words of encouragement please feel free to post them right here or email me at bobsadviceforstocks@lycos.com
Bob
Posted by bobsadviceforstocks at 1:57 PM CDT
|
Post Comment |
Permalink
Updated: Wednesday, 19 May 2004 2:26 PM CDT
Tuesday, 18 May 2004
May 18, 2004 Staples (SPLS)
Hello Friends! At least we got a little reprieve from that downward spiral we have ben in for the last few weeks. The Dow finished at 9,968.51, up 61.60 on the day and the NASDAQ finished at 1,897.82, up 21.16 on the day. As always, please remember that I am an amateur investor so you always need to do your own investigation of all stocks discussed on this website and please consult with your own investment advisors!

I came across Staples (SPLS) as I was scanning the lists of greatest percentage gainers today. SPLS closed at $26.39, up $1.97 on the day or 8.07%. According to Yahoo, Staples is "...an office supplies retailer that sells its products through a superstore concept."
This morning, SPLS
reported 1st quarter results. For the quarter ended May 1, 2004, net income rose to $125.7 million or $.25/share, up from $24.8 million or $.05/share a year earlier. Total sales for the chain were up 12% to $3.45 billion, and North American same store sales (open at least a year) were up 5%. Most importantly, the $.25/share exceeded analysts expectations of $.22 by $.03. SPLS announced that it expected earnings of $.22/share for the second quarter which is an increase over analysts expectations of $.16/share for that quarter. These results are just what the stock needed...and the price result subsequently developed as the day progressed!
Morningstar is down as I write, but the "5-Yr Restated" financials look just fine with growing revenue, solid free cash flow, and a nice balance sheet.
If we look at
"Key Statistics" on Yahoo.com, we can see that the trailing p/e is moderate at 26.93, a forward p/e (fye 31-Jan-06) is even nicer at 16.92. The PEG is thus reasonable at 0.93, and the Price/sales is also under 1.0 at 0.93.
There are 499 million shares outstanding with 495 million of them that float. Currently, there are 4.99 million shares out short, which isn't really that bad with 1.01% of the float out short representing only 1.038 trading days.
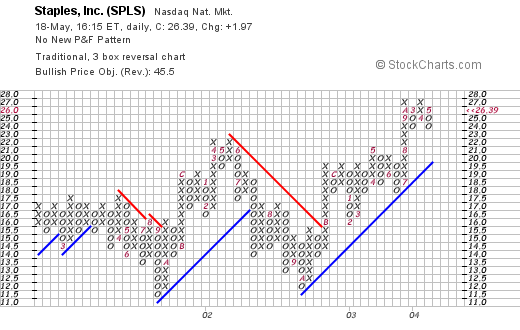
If we look at the point & figure chart on SPLS we can see that the stock was trading sideways through 2001 and 2002. In Septemeber, 2002, SPLS broke through a resistance level at around $15 and has traded higher since.
What do I think? I like this stock a lot. The valuation is nice, the sales are nice, the balance sheet/free cash flow is great, an all this with a PEG under 1.0. Now, if I only had some cash to invest! LOL.....thanks again for stopping by! If you have any questions, comments, or words of encouragement, please feel free to email me at bobsadviceforstocks@lycos.com
Bob
Monday, 17 May 2004
"Trading Transparency" CLE and VIVO
Hello Friends! Thanks again for stopping by. The market is continuing to act weak and I have hit a couple of stops on two of my recent purchases: Claire's (CLE), and Meridian Bioscience (VIVO). I like both of these but out they went this morning.

I sold 300 shares of CLE this morning at $18.28. I purchased these shares on 2/5/04 at a cost basis of $20.17/share. Thus, I had a loss of $(1.89) or (9.4)%.
Later this morning, my shares of Meridian Bioscience (VIVO) were sold, with 400 shares being sold at $10.46. These shares were JUST purchased on 4/22/04 for a cost basis of $11.46/share for a loss of $(1.00)/share or (8.7)%. I loved this stock too, I mean it EVEN pays a dividend! But that 8% rule is one thing I am trying HARD to follow.

Hopefully, I can sit on my hands before rebuying any shares of another company!
Anyhow, I am trying to keep you up to date as we all deal with this correction! If you have any questions, comments, or words of encouragement, please feel free to post them right here or email me at bobsadviceforstocks@lycos.com
Bob
Posted by bobsadviceforstocks at 12:29 PM CDT
|
Post Comment |
Permalink
Updated: Monday, 17 May 2004 12:31 PM CDT
Saturday, 15 May 2004

Hello Friends! Thanks so much for stopping by! The weekend is the time for me to review my past selections: The "good, bad, and the ugly." (apologies to Clint Eastwood.) As always, please remember that I am an amateur investor and that you should do your own investigation on all of the stocks discussed here and consult with your investment advisors to make sure investments are suitable and timely for your investment needs!

The first stock picked on Stock Picks Bobs Advice (whatever am I going to do about THAT missing apostrophe...oh well...) was St Jude Medical (STJ) which
was selected for the blog on 5/12/03 at $55.30. STJ closed on 5/14/04 at a price of $74.74 for a gain of $19.44 or 35.2%.
What about recent news? On April 21, 2004, STJ
announced 1st quarter 2004 results. Net sales were up 24% (about 6% of that was due to currency exchange effects), to $549 million from $441 million the prior year. Earnings for the first quarter were $96 million, a $16 million or 20% increase over net earnings of $80 million. Per diluted share this came out to $.52 in 2004 a 21% increase over the $.43/diluted share in the first quarter of 2003 ended March 31st.

On May 14, 2003, J2 Global Communications (JCOM)
was selected for the blog at $32.60. They had a 2:1 split so the adjusted pick price was $16.30. JCOM closed at $22.96 on 5/14/04 for a gain of $6.66 or 40.9%.
On April 19, 2004, JCOM
reported 1st quarter results. Revenues for the quarter ended March 31, 2004, increased 51% to $22.9 million from $15.2 million in the same quarter the prior year. GAAP Net Earnings per diluted share increased 25% to $.25/share from $.20/share the prior year. JCOM appears to be doing just fine!

HealthExtras was
selected for Bobs Advice on 5/14/03 at a price of $5.70/share. HLEX closed on 5/14/04 at $14.00/share for a great gain of $8.30 or 146%.
HealthExtras
reported 1st quarter 2004 results on April 28, 2004. Revenues totaled $110.5 million, a 21% increase over last year's revenues of $91.7 million. Net income came in at $3.4 million or $.10/share, a 79% increase over first quarter 2003 earnings of $1.9 million or $.06/share. HLEX appears to be right on track!

AMN Healthcare Services (AHS) was
posted on Bob's Advice on 5/15/03 at a price of $10.05. AHS closed at $15.21 for a gain of $5.16 or 51.3% during this period.
On April 28, 2004, AHS
reported 1st quarter 2004 results. Revenue was $161.3 million, down from $199.8 million for the first quarter of 2003. Net income came in at $4.6 million or $.15/share compared to $12.4 million or $.29/share the prior year. However, these results were slightly better than the PRIOR quarter...so the market did not punish the stock price much at all. My judgement on this one is out. Certainly this stock does not fulfill the requirements of this blog to be picked as a possible purchase, but then again, we have a nice gain on the pick (although I do NOT own any shares)...so if I owned it, I would be sitting tight...letting the market price dictate my actions.

On May 16, 2003, I
picked Agree Realty (ADC) for the blog at a price of $23.41. ADC closed 5/14/04 at $23.05 for a loss of $(.36) or (1.5)%.
On April 23, 2004, ADC
reported 1st quarter 2004 results. Since this is a REIT, the results are not typical for some of our other companies: funds "from operations" increased 17.4% to $4.3 million compared to $3.6 million the prior year. Diluted funds from operation were $.60/share compared to $.71/share the prior year. Net income, however, increased 29% to $2.9 million or $.45/share compared with net income the prior year of $2.2 million or $.50/share. Clearly there are more shares out this year diluting some of the income. Overall this is a satisfactory if not exciting result imho.
So how did we do that first week in May when I set out to start picking stocks for this blog? Of the five stocks picked a year ago, I recorded gains (Of these stocks I currently only own some shares of STJ in my trading account, and I believe I have some shares of HLEX in a managed account that I do not decided purchases or sales) ranging from +35.2% to +146%, with a single loss of (1.5)%, for an average performance of a gain of 54.4%. This was a GREAT week and a GREAT start for this blog!
Thanks so much for stopping by! I have added some of these LOGOS to add some spice to the site. Please let me know if it slows down the loading too much! If you have any questions, comments, or words of encouragement, please feel free to leave them right here on the blog or email me at bobsadviceforstocks@lycos.com
Have a great Sunday everyone!
Bob
Posted by bobsadviceforstocks at 3:29 PM CDT
|
Post Comment |
Permalink
Updated: Sunday, 16 May 2004 12:13 AM CDT
Friday, 14 May 2004
May 14, 2004 Panera Bread (PNRA)
Hello Friends! Thanks for stopping by! As always, please remember to do your own investigation of stocks and consult with your financial advisors before acting on any information discussed on this website.
The market is acting anemic but at least it is not plummeting as I write. In fact, in my trading account, I have not hit any sell points. In some ways, this has been a problem as I have had to "pony-up" some cash to deal with the high margin level. Today Panera Bread (PNRA) hit the list of top gainers.

As I write, PNRA is trading at $35.63, up $2.18 or 6.52% on the day. According to Yahoo, PNRA "...operates a retail bakery-cafe business and franchising business under the concept names Panera Bread Company and Saint Louis Bread Company."
On May 13, 2004, Panera reported
1st quarter 2004 results. Company revenue jumped 29% to $130 million from $101 million in 2003. (Franchise revenue jumped 25% from $199 million to $248 million in the same period). Earnings per diluted share increased 24% to $.31/share for the 16 weeks ended April 17, 2004. On a comparable store basis, sales jumped 1.8% during the period. An interesting note on this company, is the fact that it was formed in 1981 under the name Au Bon Pain Co. In 1993, Au Bon Pain purchased the Panera Bread assets. By 1999, the Au Bon Pain division was sold and the name of the company was switched to Panera Bread.

Reviewing Morningstar.com
"5-Yr Restated" financials, we can see that the revenue was dropping through 2000 from $249.7 million in 1998 to a bottom of $151.4 million in 2000. At this time, the company was transitioning to the Panera Bread Concept, and revenues have grown steadily since then to the current $334.2 million in trailing 12 month revenue.
Earnings, which also bottomed at $(.03)/share in 1999, have improved steadily each year since with $.91 reported in the trailing twelve months.
Free cash flow has improved from a break-even $0 in 2000, to $29 million in the trailing twelve months. Looking at the balance sheet on the same Morningstar site, we can see that the company has $45.1 million in cash and $34.0 million in other current assets, enough to pay off BOTH the $34.7 million in current liabilities and the $6.7 million in long-term liabilities.
Looking at
"Key Statistics" from Yahoo, we can see that the Market Cap is a mid cap $1.06 Billlion, the trailing p/e is 32.86 with a forward p/e of 21.44 (fye 27-Dec-05). The PEG on this stock is very nice at 0.87, with a price/sales of 2.60.
Yahoo reports 30.11 million shares outstanding with 23.10 million of them that float. There ARE 7.09 million shares out short which is a BIG short level, representing 8.96 trading days or 30.68% of the float as of 4/7/04. The move upwards in the stock price today MIGHT be due to all of this pent up demand for shares by the shorts! No cash dividend is paid, and the last stock split reported by Yahoo was in January, 2002.
If we look at the stockcharts.com point & figure chart:
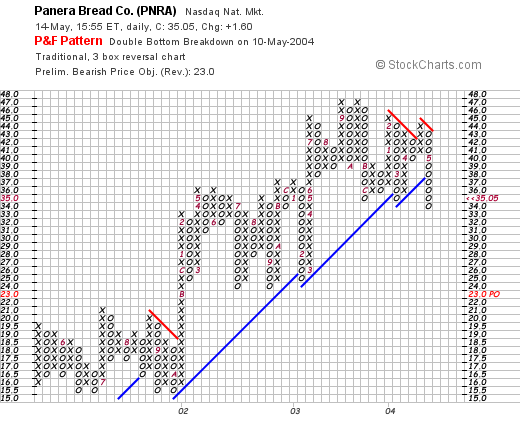
We can see that the stock HAS actually demonstrated some weakness lately...having broken through the support level at $38.
What do I think? First of all, I do NOT own any shares nor do I have any options or leveraged positions. That being said, PNRA actually looks pretty interesting to me. The valuation is nice with a PEG under 1.0. I would rather have a bit stronger level of same store sales...better than the 1.8% reported. However, with all of the short interest chasing shares, we may just see a nice price rise!
Thanks so much for stopping by! If you have any questions, comments, or words of encouragement, please feel free to email me at bobsadviceforstocks@lycos.com.
Bob
Thursday, 13 May 2004
New Blog Links Category
O.K. so I am a year old. That doesn't sound like I should be old enough to drive a car! Anyhow, I am FINALLY getting around to reading OTHER PEOPLE's blogs. Alright I have been trying to get other people to read MY blog...but I have resigned myself to a level or readership somewhere under stellar. So I am starting to realize there are a lot of AWESOME blogs out there. Came across
sugarmama as a link from a link or something or other. By the time I am into three links back....well I can never remember EXACTLY where I started. Anyway, I am going to try to expand upon my endless stock comments and start to talk to you about more than stocks....well a little anyhow!
Have a great evening everyone, and come back and visit often now!
Bob
May 13, 2004 MapInfo (MAPS)
Hello Friends! You know for a 'one-year-old', I really feel pretty mature. I mean, with this BLOG one year old (lol), and here I am WRITING at twelve months, reading, telling awful jokes...heck...I am even potty-trained! Thanks so much for stopping by. As always, remember to do your own investigation on all stocks discussed on this blog and consult liberally with your investment advisors...as I am an AMATEUR investor who just likes to discuss ideas and look at stocks. If you have any questions, comments, or words of encouragement, please feel free to post them right here....just click under the posts where it says "comments" and start a discussion...or email me at bobsadviceforstocks@lycos.com and I will probably respond to you right in the blog!
As I noted in my last post, the stock market really does appear to be looking for a support level in here. I find it hard to believe that the only thing that will move this stock market higher is BAD economic news...news that will not mean that interest rates will be raised. Quite frankly, with the rates at 40 year lows, what can we expect but some normalization of interest rates in here. If rates get so high that they seem to be shutting down the economy....well then that would be something different...but all of this hysteria, in my opinion, of the first rate rise...well is this overdone or what? Anyhow....
Was looking over the big movers today and came across MapInfor Corp. (MAPS).

MapInfo is having a fairly nice day today trading at $10.50, up $.56 or 5.63% as I write. According to Yahoo.com, MapInfo "...is a global software company that designs, develops, licenses, markets and supports location-based software and data products, application development tools and industry-focused solutions." I guess the key to all of that 'jargon' is the term "location-based". Sort of like a map!

On April 21, 2004, MAPS announced 2nd quarter 2004 results: revenue came in at $31.4 million vs $27.1 million in the prior year same quarter. Net income came in at $1.07 million vs a loss of $(742) thousand last year. On a per share basis, this was $.07/share vs $(.04)/share last year.
If we look at Morningstar.com "5-Yr Restated" financials, we can see a slightly erratic growth in revenue from $74.4 million in 1999 to $114.0 million in the trailing twelve months. Earnings peaked in 2000 at $.54/share dropping to a loss of $(.16)/share in 2002 and have been improving each year since. Free cash flow which was $(1) million in 2001, $(7) million in 2002, turned positive in 2003 at $3 million and has improved to $6 million in the trailing twelve months.
The balance sheet on Morningstar.com shows $35.4 million in cash and $27.8 million in other current assets, easily covering the $41.5 million in current liabilities, with enough left over to pay off the long-term liabilities of $17 million if that were necessary or desirable.
Looking at "Key Statistics" from Yahoo, we see that this is a SMALL cap stock with a market cap of $206.46 million. The trailing p/e is steep at 50.10 (as the company is just returning to profitability), but the growth is so FAST that the forward p/e (fye 30-Sep-05) is only 21.04. Thus the PEG, which isn't cheap, isn't nearly that bad at 2.21. The price/sales is 1.65.
Yahoo reports 19.62 million shares outstanding with 19.60 million of them that float. Thus, the insider holdings are only 0.13%. There are only 180,000 shares out short representing 0.92% of the float or only 0.677 trading days as of 4/7/04, so this is not much of an issue. No cash or stock dividends are reported on Yahoo.
Looking at technicals with a "point and figure" graph:
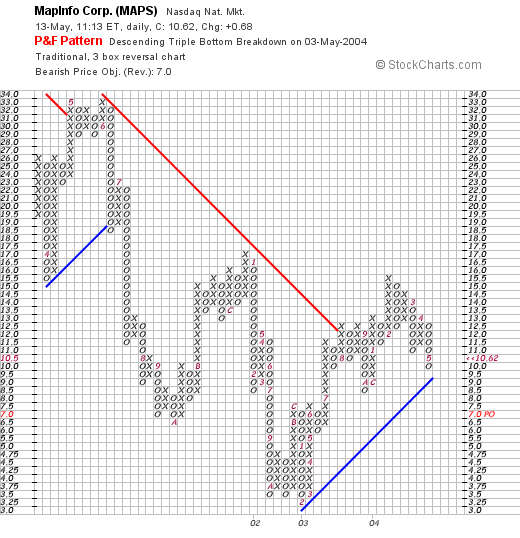 We can see that MAPS was trading lower throughout 2002, bottoming out in January, 2003, at about $3/share, Since that time, it has moved higher, breaking through a resistance level at about $12 in August, 2003, to its current level around $10.
By the way, I do NOT own any shares nor have any leveraged position on this issue. What do I think? I prefer stocks a little higher than $10.50/share. With an 8% stop, I seem to hit this point over and over in the lower-priced investments. Other than that, I like this stock! The valuations isn't bad, the technicals look nice, and the recent earnings report is encouraging.
If you have any questions, comments or words of encouragement, please feel free to email me at bobsadviceforstocks@lycos.com
Bob
P.S., meanwhile, enjoy a slice of birthday cake: a beautiful picture from one of my favorite artists: Wayne Thiebaud!

Wednesday, 12 May 2004
Technicals on NASDAQ
Hello Friends! I do NOT have any stocks to present today. Saw that SEM has fallen apart...and my stock club has that one so out it will need to go. Was looking at the NASDAQ chart:
in my humble opinion, this 1890 level appears to be a critical area that may determine whether more selling will develop. I do not claim to be a brilliant technician, but what do you think? It looks like if this level holds, this would represent some sort of "double bottom" and we may see some upside from here. Otherwise, look out below!
On the other hand, the NYSE composite index graph:
looks like it has broken through the prior support level, so I am not sure what to make of it except where is the next level of support?
I don't make many technical observations, so if there are better technicians out there, just email me at bobsadviceforstocks@lycos.com, and we can share your comments with everyone!
Bob
Newer | Latest | Older


