Stock Picks Bob's Advice
Thursday, 2 December 2004
December 2, 2004 Gildan Activewear (GIL)
Hello Friends! Thanks so much for stopping by and visiting my blog,
Stock Picks Bob's Advice! I hope that your visit is enjoyable and that my thoughts also help you to think about ways of looking at stocks. Please remember that I am an AMATEUR investor, so please consult with your professional investment advisors before making any investment decisions based on information on this website. If you have any questions, comments, or words of encouragement, please feel free to email me at bobsadviceforstocks@lycos.com .

Today, while looking through the
top % gainers of the NYSE list, I came across Gildan Activewear, Inc. (GIL), which currently is trading at $32.65, up $.97 or 3.06% on the day. I do not own any shares of GIL nor do I own any options.

According to the
Yahoo "Profile" on Gil, Gildan "...is a vertically integrated manufacturer and marketer of branded basic activewear for sale princiapply in the wholesale imprinted activewear segment of the Canadian, United States, European and other international apparel markets."
What pushed the stock higher today, was the
announcement of 4th quarter earnings. Sales for the quarter came in at $145.6 million, up 33.3% from $109.2 million in the same quarter last year. Net earnings came in at $16.8 million or $.56/diluted share up 18.3% and 16.7% from $14.2 million or $.48/diluted share last year. These were solid results! In addition, the company provided guidance for 2005 predicting $2.60/share in earnings on sales of $620 million. This is in contrast to $2.02/diluted share in 2004 on $533.3 million in sales.

How about longer-term? If we look at a
Morningstar "5-Yr Restated" Financials on GIL, we can see that revenue has been steadily increasing from $221.6 million in 1999 to $533.3 million as just reported in 2004. Earnings have grown steadily (except for a dip in 2001) from $.67/share in 1999 to the just-reported $2.02/share in 2004.
Free cash flow, which was a negative $(40) million in 2001, has improved and came in at $21 million in the trailing twelve months. In addition, the balance sheet, per Morningstar, shows $68.8 million in cash and $174.9 million in other current assets, as balanced against $88.9 million in current liabilities and $74.2 million in long-term liabilities. This looks just fine to me!
How about "valuation"? Using
Yahoo "Key Statistics" on GIL, we can see that this is a "mid-cap" stock with a market cap of only $968.01 million. The trailing p/e is a reasonable 16.31, and the forward p/e (fye 5-Oct-05) is even nicer at 12.47. With the current growth rate, the PEG has to be substantially under 1.0, but none is reported on Yahoo. Price/sales is 1.83.
Yahoo reports 29.63 million shares outstanding with only 10.10 million of them that float. Of these, 738,000 shares are out short, representing 7.31% of the float, or a whopping 25.448 days of trading volume. If we were going to see a squeeze, this is one of the higher short "ratios" I have seen for awhile! No cash dividend is reported, and no stock dividend is noted on Yahoo.
How about a chart? Taking a look at
Stockcharts.com for a Point & Figure chart on GIL:
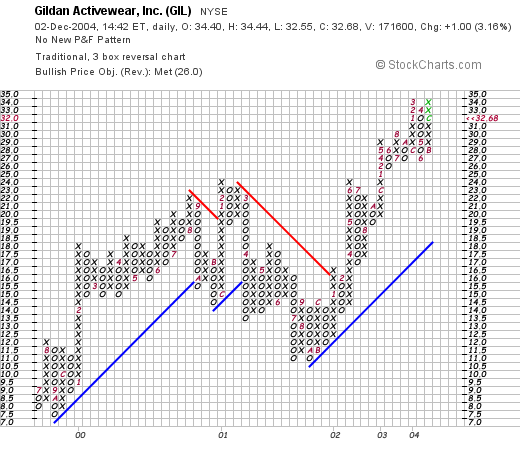
We can see that this stock was trading higher from June, 1999, and hit a temporary peak at $25 in February, 2001, (recall that earnings dropped precipitously in 2001 and then reversed upward just as fast), the stock dropped to $11/share in September, 2001, then has climbed steadily higher to its current level around $34. The chart looks nice to me!
 So what do I think? The stock looks very nice to me. I don't know anything first-hand about the company or their products, but it is a bit different than one of those high-tech firms! I guess I know what a tee-shirt is! Their latest earnings report is solid, they are guiding for higher growth in 2005, their Morningstar numbers look great with steady earnings and revenue growth for the past five years (except for the 2001 dip). They are generating free cash flow and they have a nice balance sheet. Valuation is great with the p/e essentially in the mid-teens, and there are a lot of shares out short!
Anyhow, if I just hit a sale on my CMN, which IS close, except for the very sloppy market today, I might just be buying some shares....however, rules are rules, and I shall be sitting on my hands for now! Thanks again for stopping by! If you have any questions or comments, please feel free to email me at bobsadviceforstocks@lycos.com .
Bob
Wednesday, 1 December 2004
A Reader Writes "Any input about AHFI?"
Hello Friends! I always enjoy getting email and today was no exception. I received a note from Chris who wrote:
Hey Bob,
To start, I want to say that I love your web site.
I'm just starting to learn about investing, and I was wondering if you had any input about a stock I just heard about...
The ticker is AHFI
I learned about it on this site.
http://www..........
Also.
I wanted to open an on-line account, I was thinking about going with Scottrade.com
Do to a low amount of funds, I think that's the best option. Do you have any thoughts?
Thanks for your time.
Chris (I deleted the link to the penny stock site as I do not wish to endorse or judge another website like that here.)
Chris, first of all, I am not in a position to advise you whether AHFI is a good investment for you or not. For that, you should consult with your professional investment advisor as I am just an AMATEUR investor! However, I will tell you what I can find about this company.
First of all, checking Yahoo, we can see that AHFI is not longer listed as that, it is on the "pink sheets" which means generally that it does not qualify for the fairly loose requirements of the NASDAQ, meaning it is more of a penny stock and is highly speculative. I do not review speculative penny stocks on this website.
I did find out that AHFI.PK stands for "Absolute Health and Fitness Inc. The stock currently is trading at $3.53/share. This company is so small that Yahoo does not even carry headlines on it. In fact, even Stockcharts does not carry a chart. The best chart I could find was from Yahoo:
Thus, we can see that we have a chart. And that is about all I can easily find. This is not a stock that I am interested in. If you have some additional information that I can review, please send it to me. However, penny stocks and I just don't get along. Maybe I am just getting too old. I just want to make a "base hit" with a stock. And do it consistently! That is how you can win the investing game in my humble opinion.
I found this description on a message board post: Absolute Health & Fitness currently owns and operates 3 fitness centers in the Southeast, and expects to add another 8 centers via acquisition, resulting in a company generating revenues in excess of $10 million / year. A business combination with one other major fitness center operator is expected to more than double the Company's revenues to over $23 million this year, and increase the number of its operating Business Units to 24. Thus, you would be basically investing in a three store fitness chain. Yikes. Now THAT is speculative imho!
I want to own a stock that has earnings I can review, a Morningstar report that I can analyze, a point and figure chart and estimates of valuation. I would even like to visit their website. This company has none of that. In addition, in general, I like to invest in stocks trading over $10.
Good luck with whatever decision you happen to make. Insofar as Scottrade or Schwab or Fidelity or Waterhouse or Ameritrade, that is all up to you. I have found that Fidelity works well with me, especially their nice presentation of gains/losses/history questions that I use in determining my investing decisions!
It is far more important HOW and WHAT decisions that you make than where you make your trades imho. Good luck and email me at bobsadviceforstocks@lycos.com if you have any other questions or comments regarding this or anything else on your mind!
Bob
Monday, 29 November 2004
"Trading Transparency" VMSI and XXIA
Hello Friends! Just a quick note to update you. I sold 50 shares of my 200 shares of VMSI a few moments ago at about a 30% gain. Thus with a buy signal, I decided to go ahead and purchase 400 shares of XXIA, a stock I just reviewed today that is doing well in the market! I sold the 50 shares of VMSI at $61.02 which I had purchased at a cost of $46.94/share on 4/16/04, and thus had a gain of $14.08 or 30.0%, the first sale point. The 400 shares of XXIA were purchased a few moments later at a cost of $15.17/share.
Thanks so much for stopping by! If you have any questions, comments, or words of encouragement, please feel free to email me at bobsadviceforstocks@lycos.com .
Bob
November 29, 2004 Ixia (XXIA)
Hello Friends! Thanks so much for stopping by and visiting my blog,
Stock Picks Bob's Advice. I survived "Black Friday" without too much financial damage. As always, please remember that I am an AMATEUR investor, so I cannot be responsible for any of your trades or investment decisions. Please consult with a professional investment advisor to make sure that all investment decisions you make are timely, appropriate, and likely to be profitable for you! If you have any questions or comments, please email me at bobsadviceforstocks@lycos.com .

While looking through the
list of top % gainers on the NASDAQ today, I cam across Ixia (XXIA), a stock that I hadn't heard of previously, and needless to stay a stock that I do not own any shares nor any options. As I am writing, this, Ixia (XXIA) is trading at $15.13, up $1.38 or 10.04% for the day in an otherwise very lackluster market.
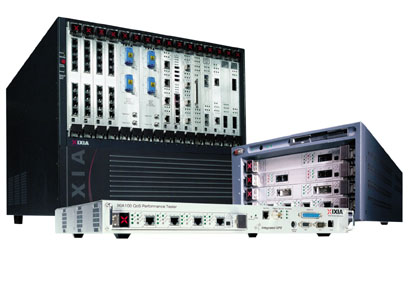
According to the
"Yahoo Profile" on XXIA, Ixia "...is a provider of multi-port traffic generation and performance analysis systems for the high-speed data communications market, including the Internet infrastructure and local, metropolitan and wide area networks." Well, since I am NOT a computer "geek" (excuse the term please), I cannot tell you on an intuitive level exactly what they do, but their numbers deserve a second look!
On October 21, 2004, XXIA
announced 3rd quarter 2004 results. Net revenue for the third quarter ended September 30, 2004, increased 39% year-over-year and 12% sequentially from the prior quarter to $30.1 million. Net income on a GAAP basis for the quarter came in at $4.7 million or $.07/diluted share a 96% increase over the $2.4 million or $.04/diluted share for the third quarter in 2003.
How about longer-term? For this, as you probably already know, I like to turn to Morningstar. The
Morningstar.com "5-Yr Restated" financials on XXIA show a slightly erratic revenue picture but basically, revenue has grown from $24 million in 1999 to $96 million in the trailing twelve months (TTM). Extrapolating the current quarter would get us to $120 million in revenue on an annualized basis.
Earnings have also been erratic increasing from $.16/share in 2001 to $.17/share in the trailing twelve months. Again, annualizing the latest quarter gets us to a $.28/year rate.
Free cash flow has remained positive with $20 million in free cash flow in 2001, and $15 million in free cash flow in the TTM.
The balance sheet as presented by Morningstar.com also looks solid with $78.5 million in cash and $34.0 million in other current assets. The cash alone would cover the $19.5 million and ZERO long-term debts about four times over!
What about "valuation" questions? Looking at the
Yahoo "Key Statistics" on Ixia, we can see that this is a mid-cap stock with a market capitalization of $931.97 million. The trailing p/e is rich at 71.27, the forward p/e is a shy better at 35.14, and the PEG shows the valuation questions with a 2.54 number. Price/sales also steep at 8.09. This stock is not a bargain. (But that might not mean it isn't still a good investment!)
The company has 61.68 million shares outstanding with only 28.00 million that float. Of these, as of 11/8/04, there were 614,000 shares out short representing only 2.19% of the float and only 1.23 trading days of volume. There isn't a lot of short sellers on this stock.
Yahoo does not show any dividend and no stock splits are reported.
How about "technicals"? For this I like to review a
Point and Figure Chart from Stockcharts.com:
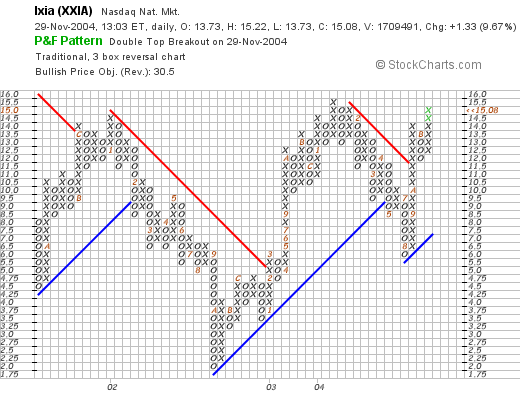
Here we can see that this stock really has been trading somewhat sideways since mid 2001, when it ran into resistance in January, 2002, at around the $15 level, declined to $2.00 in October, 2002, and again hit a resistance level at around $15.50. The stock did not pull back quite as far, finding support at around $5.00 and now has been moving higher, possible to new heights, but again is now at the $15.00 level...but earnings are strong, and I suspect we will see continued price appreciation, market conditions supporting it, in the future.
What do I think? Well it is an interesting picture. A small high-tech stock with a great recent report, bucking the current day's market with a nice move to the upside. The valuation is a bit pricey, but then again, the stock is just going profitable and is growing both revenue and earnings strongly...so I defer to you whether that is a good enough growth picture to justify the price! The free cash flow is nice, the balance sheet is pristine, and technicals look fine to me. I kind of like this stock and would be a buyer in here if my own portfolio would allow me. I am close to a sale on VMSI, but will sit on my hands until I have a sale on a gain to allow me to add a new position!
Thanks so much for stopping by. Again, if you have any questions, comments, or words of encouragement on this or any other aspect of this website, please feel free to email me at bobsadviceforstocks@lycos.com .
Bob
Sunday, 28 November 2004
Pleasant thought.

As we head into another week of trading, I wanted to share with you another painting of an artist I enjoy, Mark Rothko. There is something simple yet elegant about his paintings. Seriously. When we are thinking about profits, cash flow, momentum, or federal reserve rates of interest, it is nice to come back to a simpler world of color size and proportion. Wishing all of you a wonderful week!
Bob
Saturday, 27 November 2004
"Looking Back One Year" A review of stock picks from the week of October 13, 2003


Hello Friends! Thanks so much for stopping by. I hope that your Thanksgiving went well and that you did not eat as much of the stuffing and cranberries as I did! What I like to do on weekends around here is to look back about a year and see how the selections that were posted on this blog,
Stock Picks Bob's Advice have performed since they were listed. Currently, I am up to the week of October 13, 2003, having reviewed October 6, 2003, last week. The performance of the selections assumes a buy and hold strategy. I do NOT currently use a buy and hold approach in my own
Trading Portfolio. As you may read elsewhere, I sell a stock if it drops 8% and sell at other points if the stock appreciates. However, for the sake of illustration, I review the picks and see what has happened to them since posting.
As always, please remember that I am an AMATEUR investor, so PLEASE consult with your professional investment advisors prior to making any investment decisions based on information on this website to make sure such decisions are appropriate, timely, and likely to be profitable for you! If you have any questions or comments about this or anything else on the website, please feel free to email me at bobsadviceforstocks@lycos.com .

On October 13, 2003, I
posted International Game Technology (IGT) on Stock Picks at $30.17. IGT closed on 11/26/04 at $35.51 for a gain of $5.34 or 17.7%.
On November 2, 2004, IGT
reported 4th quarter 2004 results. Revenue for the quarter increased to $621.7 million from $547.5 million the prior year. However, net income declined to %54.3 million from $108.3 million the prior year, and on a fully diluted basis, this came out to $.15/share in 2004, vs $.31/share in 2003. Overall, I like increasing revenue, but prefer to see increasing earnings in line with it!

On October 14, 2003, I
posted BioLase (BLTI) on Stock Picks at a price of $13.47. BLTI closed on 11/26/04 at $8.95 for a loss of $(4.52) or (35.6)%.
On October 27, 2004, BLTI
announced 3rd quarter 2004 results. For the quarter ended September 30, 2004, net sales came in at $12.0 million down from $13.5 million for the same period in 2003. Net loss for the third quarter was ($1.2) million or ($.05)/diluted share compared with net income last year of $2.6 million or $.11/diluted share. This reduction of sales, along with a shift to a loss from a profit explains the dismal performance of the stock!

I
posted aQuantive (AQNT) on Stock Picks on 10/14/03 at a price of $13.34. AQNT closed on 11/26/04 at $8.55 for a loss of ($4.79) or (35.9)%.
On November 4, 2004, AQNT
reported 3rd quarter 2004 results. Revenue was up 201% to $46.7 million. Net income for the quarter was $3.5 million or $.05/share, compared with $3.9 million or $.06/diluted share in 2003. Thus, in spite of the 200% increase in revenue, earnings were actually DOWN 16%. Not exactly my cup of tea. In addition, AQNT LOWERED guidance for the following quarter and fiscal 2004 in the same announcement. As you may know, INCREASED guidance is a key to stock appreciation. Thus, the mediocre stock performance, imho.

On October 16, 2003, I
posted Pharmaceutical Product Development (PPDI) on Stock Picks at a price of $29.16. PPDI closed at $42.84 on 11/26/04 for a gain of $13.68 or 46.9%.
On October 13, 2004, PPDI
reported 3rd quarter 2004 results. Net revenue for the quarter was up 20.2% over net revenue of $179.5 million for the same quarter in 2003. Earnings per diluted share were unchanged at $.44/share both year, but in 2003 included effects of gain on sale of assets, and other items, totalling $.03/share, thus this year's result was a little better than reported on closer examination. Overall, this appears to be a solid report, and the stock price has reflected it.

Finally, on October 17, 2003, I
posted Image Sensing Systems (ISNS) on Stock Picks at $10.00/share. ISNS closed at $13.92 on 11/26/04 for a gain of $3.92 or 39.2% since the posting.
On October 20, 2004, ISNS
reported 3rd quarter 2004 results. Revenue for the quarter came in at $3.08 million, up from $2.67 million last year. Earnings per diluted share came in at $.26/share, up from $.19/diluted share the prior year. These were solid results and the stock price has also performed in line with this.
So how did we do? For the week of October 13, 2003, I had two losing stocks: BLTI, and AQNT, and three gainers: IGT, PPDI, ISNS. An average of the performance for the five results in an average gain of 6.5%. Nothing much to write home about I guess, but at least a gain for the year!

So thanks again for stopping by! As a thought for all of that holiday overeating we all seem to do, I offer you Speedy, that famous Alka Seltzer fellow who has disappeared from modern culture but who was a great childhood "friend" of mine! Whatever happened to all of those great icons? If you have any questions, comments, or words of encouragement, please feel free to leave them right here on the blog under "comments" or email me at bobsadviceforstocks@lycos.com . Good-luck with all of your holiday shopping and have a safe and healthy weekend!
Bob
Friday, 26 November 2004
November 26, 2004 RPC (RES)
O.K. so it is
Black Friday today. This is the day my wife looks forward to getting out early to join the mobs of shoppers at the stores to buy things at big discounts. I was giving her a hard time about this last night and when I awoke this morning to head off to work, she was still sleeping. Feeling a bit guilty, I woke her up to tell her it was already 7:15, she rushed off to head to the mall, and I was feeling a little less guilty about trying to deprive her of a simple joy in life: the excitement of getting a bargain!
Well thanks for stopping by my blog,
Stock Picks Bob's Advice. As you know if you are a regular reader here, I am an amateur investor and you really DO need to discuss all of my stock ideas with your professional investment advisor to make sure they are appropriate, likely to be profitable, and timely for your investment purposes. I cannot be responsible for your losses, and likewise, cannot claim any credit for your gains! If you have any questions, comments, or words of encouragement, please feel free to email me at bobsadviceforstocks@lycos.com .

With crude for January delivery hitting $49.44 on Wednesday, 11/24/04, (see
story), it is no wonder that the market is looking towards oil and oil service companies for leadership. Today RPC (RES) made the
list of top % gainers on the NYSE, closing at $27.07, up $2.67 for the day or 10.95%. I do NOT own any shares of RES, nor do I own any options. According to the CNN.money
"Snapshot", RPC's "...principal activity is to provide oilfield services and equipment to oil and gas companies engaged in the exploration, production and development of oil and gas properties." Sounds a little like our Cal Dive, which I DO have in my trading portfolio!

On October 27, 2004, RPC
reported 3rd quarter 2004 results. For the quarter ended September 30, 2004, revenues climbed 28.1% to $88.7 million from $69.2 million last year. Net income came in at $10.2 million or $.35/diluted share compared with $2.6 million or $.09/diluted share the prior year. These were great results!
How about longer-term? Taking a look at the
"5-Yr Restated" Financials on Morningstar.com, we can see that revenue has been a bit erratic longer-term but has increased from $107.6 million in 1999 to $304.4 million in the trailing twelve months.
Earnings have also been a bit erratic, with $.29/share in 1999, increasing to $1.06 in 2000, dropping to a loss of $(.19)/share in 2002, and increasing steadily since then to the current $.67/share in the trailing twelve months.
The company has been paying a dividend and this has increased from $.10/share in 2003, to $.11/share in the TTM.
Free cash flow has remained positive as the company has continued to invest substantial amounts into capital spending. $9 million free cash flow reported in the trailing twelve months.
The balance sheet on Morningstar.com shows $12.5 million in cash and $90.7 million in other current assets. This is more than enough to cover both the current assets of $37.6 million AND the long-term liabilities of $37.1 million.
How about "valuation"? If we use $500 million as a lower cut-off for mid-cap stocks, then we can describe this company as mid-cap with a market capitalization of $778.75 million. The trailing p/e is 29.11, and the forward p/e is 20.05. No PEG is noted on Yahoo, and the Price/Sales is 2.17.
Yahoo reports 28.77 million shares outstanding with only 9.70 million of them that float. Of these, only 206,000 shares are out short (11/8/04) representing only 2.12% of the float or 3.377 trading days. IMHO, the short interest is not a big factor in this stock.
As noted, the company DOES pay a small dividend, with $.12/share reported on Yahoo, representing a yield of 0.49%. The last stock split reported by Yahoo was a 2:1 split in December, 1997.
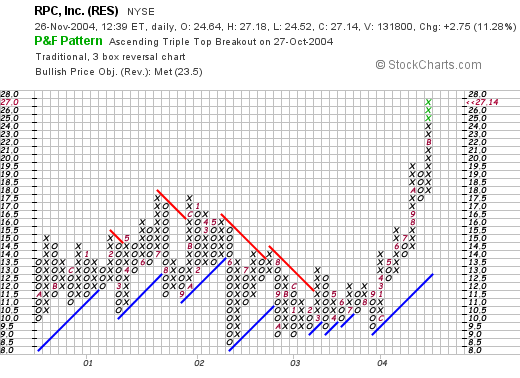
So how about "Technicals"? If we look at a
Point & Figure Chart from Stockcharts.com, we can see that this stock was essentially trading sideways between 2000 and 2003, when it appeared to hit several support levels around $8.50, and reach resistance at around $16.00/share. After bouncing off a support level at around $9.00/share in September, 2003, the stock has steadily traded higher breaking past prior resistance levels to a current price of around $27.00/share. The chart looks strong, if a bit currently over-extended in my humble opinion.
 So what do I think? Well, the stock is moving ahead nicely today in the face of a strong oil market and a great profit picture. Their five year record is erratic, showing the cyclical nature of this business, which is a bit of a concern to me. The oil price may determine the future performance of this issue. Their earnings have been improving the last several years, they are paying an increasing dividend, their valuation isn't bad in light of the spectacular growth just reported, and the graph doesn't look too bad to me at all. I guess if you wanted to have some exposure to the energy field, this might be an interesting investment to consider.
As for me, I don't have any available cash to invest, otherwise I would certainly take a look at this one. I am waiting to sell a portion of my stock holding at a profit before adding a new position! Thanks so much for stopping by and please email me if you have any questions or comments, or go ahead and post your comments right under each message right here on the blog!
p.s. I hope you all found that bargain you were looking for today!
Bob
Wednesday, 24 November 2004
Happy Thanksgiving!
Give thanks that you are not a turkey! Happy Thanksgiving everyone! Thanks for visiting my blog,
Stock Picks Bob's Advice!

Bob
A Reader Writes "What About Sun Microsystems?"
Hello Friends! Thanks for stopping by my blog,
Stock Picks Bob's Advice. Please remember that I am an amateur investor so please do your own investigation of all stocks discussed on this website, and consult with your professional investment advisors before making any investment decisions based on information here. If you have questions, or comments, please feel free to email me at bobsadviceforstocks@lycos.com .
I received a letter today from a reader who wrote:
Hi! I found your blog through blogarama.com and was wondering what
your take on Sun Microsystems is. I am having a lot of trouble finding
opinions and advice on the stock and hope that you will give me your
thoughts.
Thanks,
JeffWell Jeff, thanks so much for writing. I am sure you have read the disclaimer all over this blog, and I have to tell you it is true. I AM an amateur investor, and thus cannot tell you whether Sun Microsystems (SUNW) would be a good investment for you to make or not. In fact, I cannot tell you whether the stock will be appreciating in price in the near future or not....all I can tell you is whether it fits into my strategy of investing.
In other words, there are many ways to invest successfully in the market. My particular strategy involves momentum, both earnings and price, with a look at underlying fundamental issues. The investment in SUNW is more of a "turn-around" or contrarian "value" investment style, looking for stocks that are deeply undervalued which might have rapid appreciation in the future. That is a great strategy, but that is not what I do around here. I look for stocks that are already doing well, with nice same day percentage gains, great recent quarterly results, a nice Morningstar report, and a reasonable stock chart. Hopefully, my approach will be successful, but it is in no means to imply that there might not be better strategies that might be more successful in selecting stocks.
Well, that being said, let's take a look at SUNW and see what we come up with!

SUNW closed today, 11/24/04, at $5.21, up $.03 or 0.58% on the day. Taking a look for the most recent earnings report, I found that on Yahoo,
Sun reported 1st quarter 2005 results on October 14, 2004. For the 1st quarter ended September 26, 2005, revenue came in at $2.628 billion, a 3.6% increase over the first quarter in 2004 fiscal year. Net LOSS for the first quarter came in at $(174) million or $(.05)/share compared with a net loss of $(286) million or $(.09)/share the prior year same quarter. So the revenue is growing sequentially and the loss is shrinking, so things are improving somewhat.
How about longer-term? For that I like to turn to the
Morningstar.com "5-Yr Restated" financials which show that first, revenue hit a peak of $18.2 billion in 2001, and has been decreasing each year until 2004 when it came in at $11.185 billion. Apparently the last two quarters are showing signs of a turn-around which is positive. However, when I pick stocks for this blog, I avoid stocks that haven't been steadily increasing revenue the last five years.
Also on Morningstar, we can see that earnings were greatest in 2000 at $.55/share, and have been decreasing into losses with a bottom in 2003 at $(1.07)/share. 2004 was a little less bad with a loss of $(.12)/share and apparently the turn-around continues at SUNW.
How about free cash flow? Well this looks superb with $321 million in 2002, $664 million in 2003, and $2.0 billion in 2004. This means that the financials are likely improving and that the growing cash will provide some flexibility for the SUNW management. However, remember that they are still losing money at least in the earnings department.
Balance sheet? Appears adequate with $3.6 billion in cash and $3.7 billion in other current assets, compared with a significant $5.1 billion in current liabilities, and a $3.0 billion in long-term liabilities. Financially the company appears to be on solid footing.
Technicals? Let's look at a Point & Figure Chart from
Stockcharts.com:
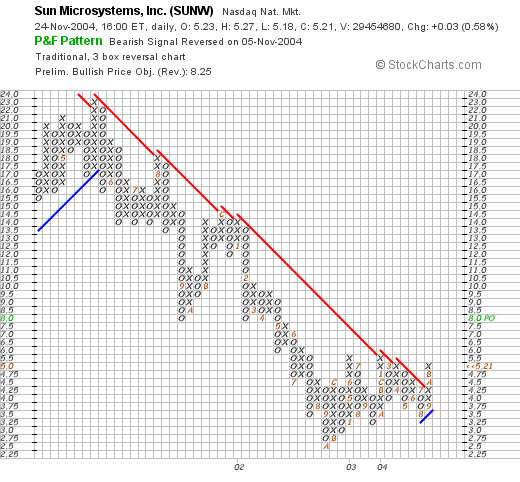
Here we can see that this stock peaked in May, 2001, at $23.00/share and has headed steadily lower. Recently, in what appears to be mid-September, 2004, the stock broke through a resistance level and has headed higher to its current level of $5.21. Quite frankly, in the short fun, this stock does look like it has been bottoming from its $2.50 low in October, 2002, and now may well be heading higher.
What do I think? Well this does not fit into the stock profile that I have been looking for here on Stock Picks. However, the recent earnings report shows improvement with slowly increasing revenue, and decreasing losses, and the balance sheet/free cash flow looks fine. I don't like the multi-year history of decreasing revenue, the persistent losses, and the "turn-around" nature of this investment. That is just not my style. However, if you like that kind of thing, this might be your cup of tea. No telling really!
Good luck and keep me posted! Thanks again for stopping by! I hope that review of SUNW was helpful for you! Regards and have a Happy Thanksgiving!
Bob
Monday, 22 November 2004
November 22, 2004 Manitowoc Co. (MTW)
Hello Friends! Thanks as always for stopping by my blog,
Stock Picks Bob's Advice. As I always like to remind you, I am an amateur investor, so please consult with your investment advisors before making any investment decisions based on information on this website. If you have any comments or questions, please feel free to email me at bobsadviceforstocks@lycos.com .

I came across Manitowoc Co. (MTW) this morning when it was on the list of top % gainers, but as I write it has pulled back a little and is trading at $38.29, up $.91 or 2.43% on the day. It doesn't make the cut as I write, but I like what I saw earlier and would like to share it with you! I do not own any shares or options on this company.

According to the
Yahoo "profile", MTW "...is a diversified industrial manufacturer with three operating segments: Cranes and Related Products, Foodservice Equipment and Marine." Personally, I have seen the name mostly on ice machines (!) but they are active in industrial ship-building and cranes as well!
On October 27, 2004, Manitowoc
announced 3rd quarter 2004 results. For the quarter, sales rose 21% to $491.1 million from $407.2 million last year. They earned $12.7 million, or $.47/share, a 77% increase from the $7.2 million or $.27/share last year. As strong as this was, this was still a penny below expectations!
How about longer-term? Taking a look at the
"5-Yr Restated" financials on Morningstar.com, we can see that revenue has grown steadily, and impressively, from $680 million in 1999 to $1.8 billion in the trailing twelve months (TTM).
Earnings, however, have been erratic, dropping from $2.55/share in 1999 to a loss of $(.80)/share in 2002, but have been improving since then to $1.23/share in the trailing twelve months.
Dividends have also been erratic, increasing from $.30/share in 1999 to $.63/share in 2002, but dropping the next year down to $.28/share where it stands now.
Free cash flow has been strong at $78 million in 2001, hitting $119 million in 2003, and still at $79 million in the TTM.
The balance sheet looks adequate if not spectacultar with $49.2 million in cash, and $700.7 million in other current assets, plenty to cover the current liabilities of $603.5 million, and to start to make a small dent in the $790.7 million in long-term liabilities.

How about valuation questions? Looking at
Yahoo "Key Statistics", we find that the market cap is a mid-cap sized $1.03 Billion. The trailing p/e is a moderate 27.52, but the forward p/e is a very reasonable 14.62 (fye 31-Dec-05), giving us a PEG of 0.83, which is very reasonable imho, and a Price/Sales of 0.55...also under 1.0.
Yahoo reports 26.86 million shares outstanding with 21.90 million of them that float. Of these 957,000 shares are out short, representing 4.37% of the float, as of 10/8/04. This is lower than last months 1.27 million shares out short so about 20% of the short-sellers have thrown in the proverbial "towel" on the downward movement of this stock. The shares out short are significant representing 7.362 trading days which is also bullish for the stock (imho) if we use the 3 day rule I have started to apply.
Yahoo shows that the company still pays the small dividend of $.28 yielding .75%. The last stock split reported was a 3:2 in April, 1999.
And what about "technicals"? If we take a look at a Point & Figure chart from
Stockcharts.com:
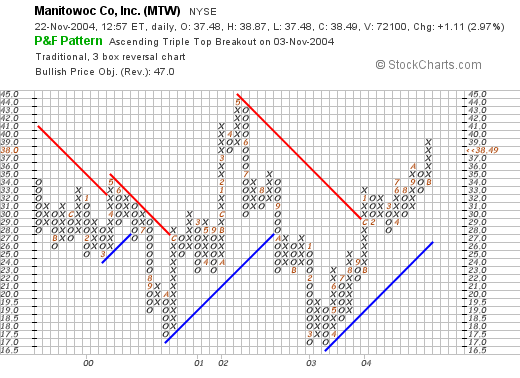
We can see that the stock has really been trading sideways since 1999 when it initially declined to a low of around $17/share in October, 2000, climbed to a high of $45/share in May, 2002, then declined once again to a low of around $17 where it bottomed twice in March, 2003. Since that time the stock broke through a resistance level at around $30 in August, 2003, and has been trading higher since. The graph, in my humble opinion, looks strong, but not overpriced!
So what do I think? Well let's review, first the latest quarterly report looks strong, the five year revenue growth is excellent but the earnings and dividend record are erratic, although they look strong the last few years. Valuation is terrific with a PEG under 1.0 as is the Price/Sales. There are even a significant number of short sellers out there who need to cover their negative "bets". The graph looks nice as well. Frankly, this is my kind of stock....now if I just had a sale that would allow me to pick up some shares...but I shall be waiting to sell a portion of one of my holdings at a gain before adding a new position. I AM close with VMSI and a second sale of AMMD is not out of the question!
Thanks so much for stopping by! I hope that this discussion helps you frame some of your own investment decisions in a manner that is relatively easily understood. If you have any questions or comments, please feel free to email me at bobsadviceforstocks@lycos.com .
Bob
Newer | Latest | Older


