Stock Picks Bob's Advice
Sunday, 8 April 2007
"Looking Back One Year" A review of stock picks from the week of November 21, 2005

Hello Friends! Thanks so much for stopping by and visiting my blog, Stock Picks Bob's Advice! As always, please remember that I am an amateur investor, so please remember to consult with your professional investment advisers prior to making any investment decisions based on information on this website.
It is Sunday morning and most of my family is still sleeping. What a great time to blog! I wanted to get to this usual entry and check on past stock picks while there was a bit of available time for me to do this. I had dinner last night with a bunch of my friends and David H. asked me whether I actually typed all of this stuff I put into my blogs or whether it was more of a 'cut and paste' I guess you would say. I explained to David that yes, I enter all of these words one letter at a time you could say. I am glad that I took typing back at Palms Junior High years ago.
Last weekend I reviewed stock picks from the week of November 14, 2005. Moving ahead a week, let's take a look at the week of November 21, 2005. I know this is more than a year ago, and I probably should change the name of these reviews, but when I started, it was closer to a year....but you know how one busy weekend leads to another :). Enough excuses, on with the review!
By the way, as the last couple of entries point out, I recommend and employ a very disciplined system of selling my holdings both on 'good news' and 'bad news'. That is, if a stock declines or announces what I believe to be fundamentally bad news, then I aggressively sell those stocks at either the market price (if it is an announcement) or predetermined price declines on the way down. Also, I sell my holdings slowly (now moving to 1/7th position sales) at predetermined appreciation points on the way up. For the purpose of this review, I continue to use a 'buy and hold' assumption that would greatly affect the performance of stocks when compared to a disciplined portfolio management strategy.
Why do I do this then? Simply because it is easier in a review just to assume you purchased shares at the listed price and then I can go and look up the current price. But take all of this in mind. You will note that I do often have stocks that I pick that decline greater than 8%, as well as stocks that appreciate more than 30%. Both of these holdings would be subject to sales in my own portfolio. Either complete sales on the way down, or partial sales on the way up. But for the ease of analysis, let's take a look at these stocks discussed during that week in November, 2005, and find out what happened to them!
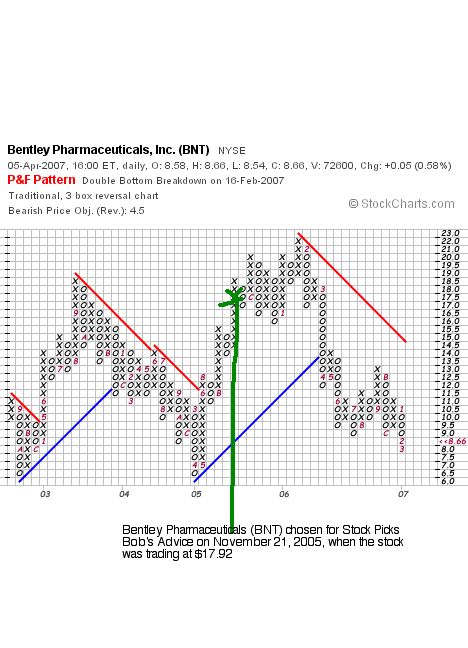
 On November 21, 2005, I picked Bentley Pharmaceuticals for Stock Picks when the stock was trading at $17.92. BNT closed at $8.66 on April 5, 2007, for a loss of $(9.26) or (51.7)%.
 On March 1, 2007, Bentley announced 4th quarter financial results. Consolidated revenues for the quarter came in at $27.1 million, up 7% from $25.2 million in the same quarter in 2005. Net income for the quarter actually rose to $4.4 million or $.19/diluted share up from $3.7 million or $.16/diluted share a year ago. However, this years quarter was favorably impacted with a legal settlement that had a favorable income tax impact of $2.7 million. Thus, removing this one-time gain from this year, resulted in a net income of $1.7 million, down from last year. With increasing revenue and decreasing earnings,
BENTLEY PHARMACEUTICALS (BNT) IS RATED A HOLD
Let's take a look at the chart.

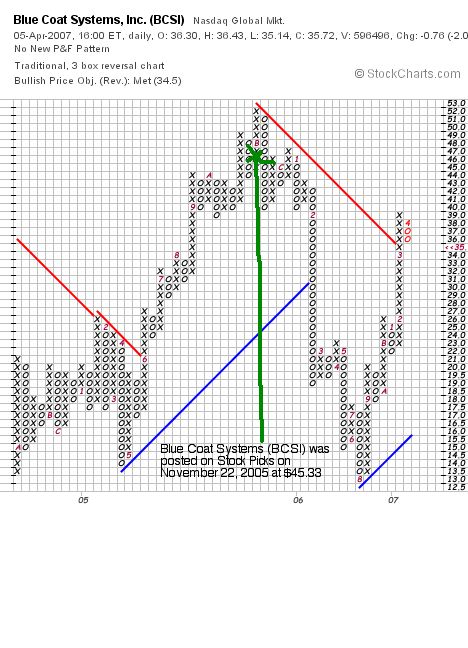
On November 22, 2005, I posted Blue Coat Systems (BCSI) on Stock Picks Bob's Advice at $45.33. BCSI closed at $35.72 on April 5, 2007, for a loss of $(9.61) or (21.2)% since posting.
On March 28, 2007, Blue Coat announced restated financial results for 2007. Net revenue for the third fiscal quarter of 2007, the latest quarterly report, came in at $47.1 million, up from net revenue of 435.5 million in the same quarter in 2006. On a GAAP basis, earnings came in at 'break-even' with net profit of only $42,000 or essentially $.00/share, compared with net income of $.20/diluted share in the same period in 2006. With the strong growth in revenue, and the 'clouds' surrounding this company with the extensive restatement, and the decrease in earnings year-over-year which are really hidden in the financial reporting, at best, I rate
BLUE COAT SYSTEMS (BCSI) IS A HOLD
Let's take a look at the chart from StockCharts.com:
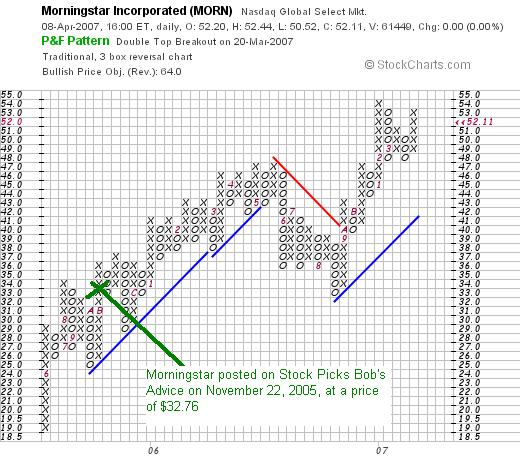
 On November 22, 2005, I posted Morningstar (MORN) on Stock Picks Bob's Advice at $32.76. I also purchased shares in Morningstar and currently own shares of MORN in my Trading Account. MORN closed at $52.11 on April 5, 2007, for a gain of $19.35 or 59.1% since posting.
 On February 22, 2007, Morningstar announced 4th quarter 2006 results. For the quarter ended December 31, 2006, revenues came in at $87 million, a 43% increase over the revenue of $60.7 million in the same quarter in 2005. Net income was $13.6 million or $.29/diluted share up from $10.1 million or $.22/diluted share in the fourth quarter 2005.
With the the solid quarterly report,
MORNINGSTAR (MORN) IS RATED A BUY
Let's take a look at the "Point & Figure" chart on Morningstar from StockCharts.com:

On November 23, 2005, I posted Drew Industries (DW) on Stock Picks Bob's Advice when the stock was trading at $29.71. Drew closed at $28.77 on April 5, 2007, for a loss of $(.94) or (3.2)%.
On February 13, 2007, Drew reported 4th quarter 2006 results. Net sales for the fourth quarter declined 24% to $138 million from $181 million last year. Net income decreased by more than 50% to $3.6 million from $9.3 million or $.17/diluted share from $.43/share the prior year.
With the sharp drop in revenue and income,
DREW (DW) IS RATED A SELL
Let's take a look at the "Point & Figure" chart on Drew Industries from StockCharts.com:
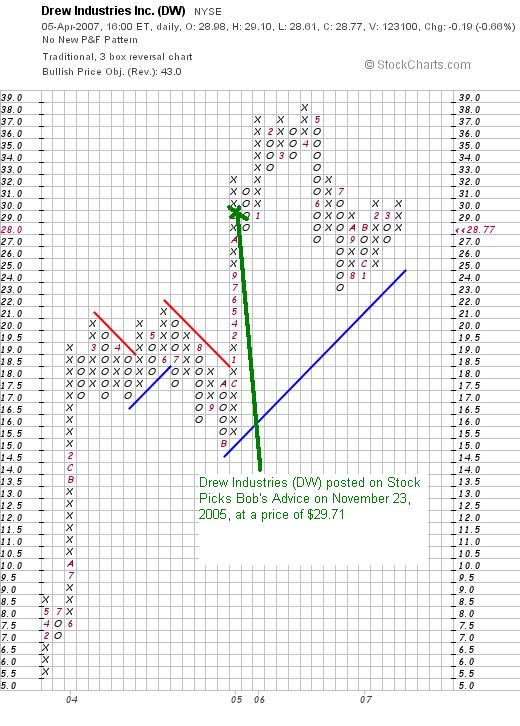
Even though I have rated this stock as a "sell" and the latest quarterly result shows sharp drops in both earnings and revenue, this graph actually looks encouraging as the stock appears to be holding the support levels and even appears to be moving higher, likely in anticipation of improved results in the future.
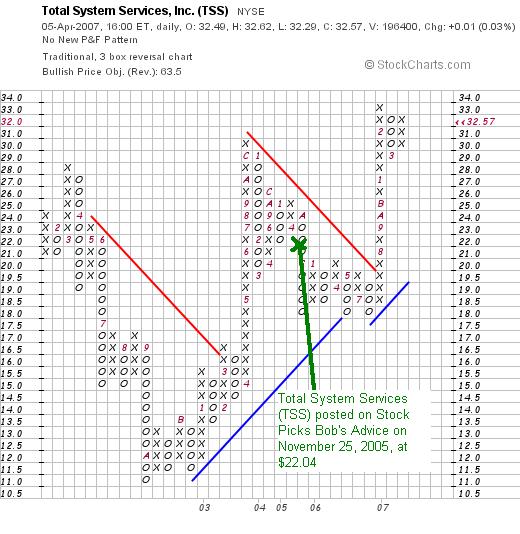
 Finally, on November 25, 2005, I posted Total System Services (TSS) on Stock Picks Bob's Advice when the stock was trading at $22.04. TSS closed at $32.57 on April 5, 2007, for a gain of $10.53 or 47.8%.
On January 16, 2007, TSS reported 4th quarter 2006 results. Total revenue for the quarter ended December 31, 2006, increased 24.8% to $503.9 million compared with $420.7 million in the same quarter last year. Net income increased 75.2% to $87.1 million from $49.7 million last year. Diluted earnings per share increased 75.8% to $.44/share up from $.25/share last year.
The company beat expectations of earnings of $.26/share on revenue of $440 million. Excluding a one-time Bank of America contract termination fee, the company raised guidance in earnings to between 14-17%, from prior range of 8-10%.
With the strong growth in both revenue and earnings, and beating expectations as well as raising guidance,
TOTAL SYSTEM SERVICES (TSS) IS RATED A BUY
Let's take a look at the"Point & Figure" chart on Total System Services (TSS) from StockCharts.com:
So how did I do with these stock picks during the week of November 21, 2005. It certainly was a mixed picture. The average performance of these stocks was a gain of 6.16%.
Thanks so much for stopping by and visiting! If you have any comments or questions, please feel free to leave them on the blog or email me at bobsadviceforstocks@lycos.com. Also, be sure and visit my Stock Picks Podcast Website, where you can hear me talk about many of the same stocks I write about here on Stock Picks Bob's Advice!
Have a wonderful Easter Sunday!
Bob
Posted by bobsadviceforstocks at 10:22 AM CDT
|
Post Comment |
Permalink
Updated: Sunday, 8 April 2007 3:18 PM CDT
Saturday, 7 April 2007
A quick look at selling 1/7th of shares at intervals.
This is an addendum to my previous post.
Assuming starting with 1,000 shares at $10.
1st sale: $13, sell 1/7th of 1,000 = 142 shares x $13 = $1,846. Leaving 858 shares x $13 = $11,154.
2nd sale: $16, sell 1/7th of 858 = 122 shares x $16 = $1,952. Leaving 736 shares x $16 = $11,776.
3rd sale: $19, sell 1/7th of 736 shares =105 shares x $19 = $1995. Leaving 631 x $19 = $11, 989.
4th sale: $22, sell 1/7th of 631 = 90 shares x $22 = $1,980. Leaving 541 x $22 = $11,902 (first dip).
5th sale: $28, sell 1/7th of 541 = 77 shares x $28 = $2,156, leaving 464 x $28 = $12,992.
6th sale $34, sell 1/7th of 464 = 66 x $34 = $2,244. Leaving 398 x $34 = $13,532.
I think you can see that the selling of 1/7th of positions, works far better at increasing the remaining value of the holding, as well as providing for increasing value of each partial sale.
Bob
Another Look At Selling Strategy: Selling 1/7th of my holdings at intervals!
Hello Friends! Thanks so much for stopping by and visiting my blog, Stock Picks Bob's Advice! As always, please remember that I am an amateur investor, so please remember to consult with your professional investment advisers prior to making any investment decisions based on information on this website.
Over the years I have developed my own idiosyncratic system for dealing with stocks in my portfolio. For many of you it must seem quite foreign and contrary to what you may have read about owning and selling stocks elsewhere. I would like to share with you my own thoughts on this process so that you will better understand my perspective, and appreciate the process that I go through.
Here is a beautiful picture of New York from Alfred Stieglitz:
 My goal in investing and building a portfolio is not to squeeze the very last nickel out of every investment but to find a system of buying, holding, and selling stocks that will be profitable. There are likely many ways to buy stocks that are more profitable. There are many investors and analysts with more insight than I possess, but I hope that through this process, I shall have found something that may work for me and if others find it helpful as well, for that I may be grateful.
I quickly understood the importance of selling losing stocks quickly. I have been using the 8% loss limit proposed by William O'Neil. I have parted ways with many stocks at this point, some went on to move back higher--even much higher. But with this 8% loss limit, I do not allow my portfolio to be exposed to the possibility of large individual losses that might otherwise be prevented. Certainly, if a stock plunges, or gaps much lower, then there is little that can be done to prevent a larger than 8% loss.
However, selling a losing stock is only one part of the formula.
A larger question is when to sell a gaining stock. Unlike O'Neil, I do not recommend averaging up on a stock that moves higher. Certainly that is a good strategy and you might wish to employ that technique. Instead, I have chosen to sell small portions of gaining stocks.
Initially I started selling 1/4 of a stock at about a 33% gain. Mathematically, I figured 3/4 x 4/3 would still yield 3/3 of the stock....sort of selling off the gaining portion. Unfortunately, after the first sale, continuing sales of 1/4 of the remaining shares was radically reducing my equity and this wasn't working. I tried to figure out the proper percentage to sell 1/4 of my holding. But rather than start using some 'artificial' % points, I chose to sell less each sale. Instead of 1/4 of my holdings, I sell 1/6th.
After 4 sales at 30, 60, 90, and 120% levels, the stock price has now doubled and I chose to increase the interval to 60%....thus the fifth sale is at a 180% level, then 240, 300, and 360%. After that I go by 90% intervals x 4, then plan on 120, 150, 180, etc. Is this the best way? I don't really know. It just seems to work for me.
Let me illustrate what happens after a few sales of a hypothetical stock that I purchased 1,000 shares at $10. For an initial purchase of $10,000 of stock.
At the first sale point, a 30% gain, the stock hits 1.3 x $10 or $13. The value of the stock is now $13,000, I sell 166 shares at $13 = $2,158 of stock. I still own 1,000 - 166 = 834 shares x $13 = $10,842.
Second sale: stock reaches a 60% gain, or 1.6 x $10 = $16. I sell 1/6th of my 834 shares or 139 x $16 = $2,224, and I have 695 x $16 = $11,120 of stock remaining.
Third sale: stock reaches a 90% gain, or 1.9 x $10 = $19. I now sell 1/6th of my 695 shares, or 115 shares x $19 = $2,185, leaving 580 shares x $19 = $11,020.
Fourth sale: stock reaches a 120% gain or 2.20 x $10 =$22. I now sell 1/6th of my 580 shares or 96 shares at $22 = $2,112, leaving 484 shares x $22 = $10,648.
Fifth sale, I now start using 60% intervals. Waiting for a 180% gain, I sell shares when the stock hits 2.80 x $10 = $28, selling 1/6th of my 484 shares or 80 shares at $28 = $2,240, leaving 404 shares at $28 = $11,312.
Sixth sale, at a 240% gain, I sell shares at 3.40 x $10 = $34, selling 1/6th of my 404 shares or 67 shares at $34 = $2,278, leaving 337 shares at $34 or $11,458 in stock.
Seventh sale at a 300% gain, I sell shares at 4.00 x $10 =$40. I sell 1/6th of my 337 shares or 56 shares x $40 = $2,240, leaving 281 shares x $40 = $11,240.
Eighth sale, at 360%, I sell shares at 4.60 x $10 = $46. I sell 1/6th of 281 shares = 46 shares x $46 = $2,116 leaving 235 shares x $46 = $10,810.
Ninth sale, intervals increase to 90%, meaning next sale point at a 450% gain or 5.50 x $10 = $55. I sell 1/6th of my 235 shares or 39 shares at $55 = $2,145, leaving 196 shares at $55 = $10,780.
Tenth sale, at a 540% gain, 6.40 x $10 = $64. I sell 1/6th of my 196 shares or 32 shares x $64 = $2,048, leaving 164 shares x $64 = $10,496.
Eleventh sale at 630% gain, 7.30 x $10 = $73. I sell 1/6th of my 164 shares or 27 shares x $73 = $1,971. Leaving 137 shares x $73 = $10,001.
Twelfth sale at 720% gain, 8.20 x $10 = $82. I sell 1/6th of my 137 shares or 22 shares x $82 = $1,804. Leaving 115 shares x $82 = $9,430.
Thirteenth sale at a 840% gain, 9.40 x $10 = $94. I sell 1/6th of my 115 shares or 19 shares x $94 = $1,786, leaving 96 shares x $94 = $9,024 worth of stock.
Clearly, I am still selling stock too aggressively.
I like these 30, 60, 90, and 120% targeted gains. But I need to sell less.
I shall not do all the math at this time, but from here on out, I am now down to selling 1/7th of my holding at the same intervals. Smaller sales should yield growing holdings. Without changing the signals I am so used to.
Thanks so much for stopping by and visiting! I hope that my thinking out loud is helpful to all of you. I sure enjoy your visits and your occasional sharing of feedback. Drop me a line at bobsadviceforstocks@lycos.com if you have any comments or questions or leave them right here on the blog.
Bob
Posted by bobsadviceforstocks at 3:52 PM CDT
|
Post Comment |
Permalink
Updated: Saturday, 7 April 2007 3:53 PM CDT
Thursday, 5 April 2007
Immucor (BLUD)
CLICK HERE FOR MY PODCAST ON IMMUCOR (BLUD)
Hello Friends! Thanks so much for stopping by and visiting my blog, Stock Picks Bob's Advice! As always, please remember that I am an amateur investor, so please remember to consult with your professional investment advisers prior to making any investment decisions based on information on this website.
 As I reported earlier today, after reviewing my AZZ stock purchase closely (after I hastily purchased some shares) I realized that fiscal year 2008 had been guided lower. The stock is still an interesting selection, but it doesn't really fit my own strategy of looking for stocks with growing revenue and increasing earnings. Especially when the company announces that the upcoming year will be a downturn for its results. I can go down a list of excuses why I missed that story before I purchased the stock, but excuses are excuses and I simply made a mistake.
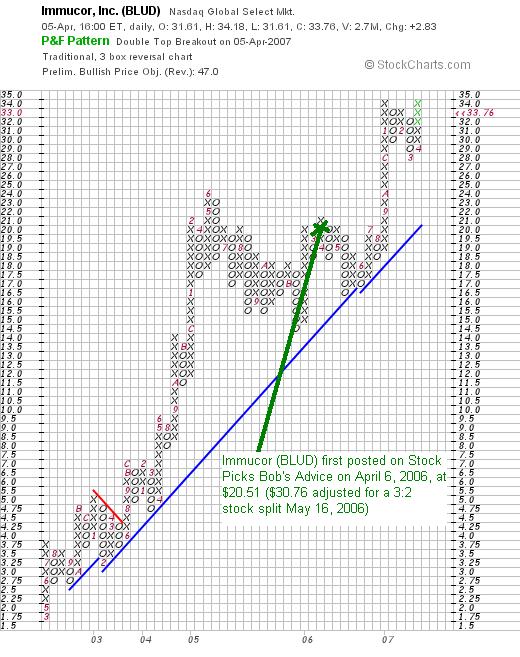
Looking through the list of top % gainers today, I saw that Immucor (BLUD) a stock that I had previously reviewed almost exactly a year ago, when the stock was trading at $20.51, adjusted for a 3:2 stock split on May 16, 2006, was trading at $33.76, up $2.83 or 9.15% on the day. After reviewing some of the data a little closer (I hope), I decided that this stock made much more sense for me than my AZZ stock, and decided to over-ride my selling rules, and essentially undid my purchase in AZZ and placed Immucor (BLUD) in my trading portfolio. I went ahead and replaced my AZZ with 180 shares of BLUD which I purchased at a price of $33.80.
Let's take a closer look at Immucor and I will show you (and double check!) my findings on this company, explaining why this is a better fit for my own strategy.
IMMUCOR (BLUD) IS RATED A BUY
What exactly does this company do?
According to the Yahoo "Profile" on Immucor, the company
 "...and its subsidiaries engage in the development, manufacture, and sale of reagents and automated systems. These are used primarily by hospitals, clinical laboratories, and blood banks in various tests performed to detect and identify certain properties of the cell and serum components of human blood prior to blood transfusion."
How did they do in the latest quarter reported?
It was the announcement of third quarter 2007 results yesterday after the close of trading that led to the big upward pressure on the stock price today. Revenue for the fiscal third quarter ended February 28, 2007, came in at $57.1 million, up 21% from $47.1 million in the same period last year. Net income came in at $15.0 million, up 28% from $11.7 million during the same period last year. Diluted earnings per share came in at $.21/share up from $.17/share last year.
The company beat expectations of earnings of $.20/share on revenue of $55 million.
These results did not go unnoticed--the Motley Fool commented on these results:
"There were no apparent soft spots in the quarterly earnings release. On a per-share basis, Immucor's earnings increased by 24% over the year-ago quarter, and revenue for the quarter reached $57.1 million for an increase of 21%. Other positive takeaways were that sales of traditional reagent products increased 22% over the prior-year quarter and Immucor's instrument sales increased by 22%.
One thing that never hurts is when you're able to name your own price. And maybe the most notable revelation from management is about the pricing power the company now has. About 82% of the company's revenue increase from the year-ago quarter can be attributed to price increases in the U.S. This pushed the company's gross margin to 70.7%, up from 68.2% in the year-ago quarter."
What about longer-term financial results?
Examining the Morningstar.com "5-Yr Restated" financials on BLUD, we can see a beautiful picture of steadily increasing purple bars on the chart showing the revenue growth with revenue climbing from $84 million in 2002 to $184 million in 2006 and $203 million in the trailing twelve months (TTM).
Earnings were almost as nice, except for a dip from $.21/share in 2003 to $.18/share in 2004, they climbed from $.16/share in 2002 to $.59/share in 2006 and $.75/share in the TTM.
The company has slowly increased its outstanding shares from 55 million in 2002 to 69 million in the TTM. This approximately 25% increase in the float, occurred while revenue was increasing about 150% and earnings were up over 300%. This is a tolerable dilution in the shares from my perspective.
Free cash flow has been positive and fairly steadily growing from $16 million in 2004 to $52 million in 2006. Free cash flow during the TTM has been slightly less at $41 million.
The balance sheet on Morningstar.com appears solid with $75.2 million in cash, which by itself can easily cover both the current liabilities of $25.3 million and the $19.8 million and have approximately $30 million left over! Calculating the 'current ratio', which I consider healthy if at 1.25 or higher, we find a total of current assets of $151.2 million, which when divided by the $25.3 million, yields a current ratio of 5.98, one of the highest current ratios on this blog!
What about some valuation numbers?
Reviewing the Yahoo "Key Statistics" on Immucor, we can see that this is a mid cap stock with a market capitalization of $2.32 billion. The trailing p/e is rich at 47.22, but the forward p/e is better (fye 31-May-08) estimated at 34.10. In spite of the rich p/e, the growth rate is sufficient to bring the PEG ratio (5 yr expected) below 1.0 to 0.92, suggesting a very reasonable valuation based on the anticipated growth in earnings.
Examining the Fidelity.com eresearch website, we can see that the stock is reasonably valued in terms of the Price/Sales (TTM) coming in at 10.39, with an industry average of 28.24. Besides being relatively cheap by this parameter, when examining the profitability of the company as measured by the Return on Equity (ROE), we can see that BLUD comes in at a ROE (TTM) of 33.48%, double the industry average of 16.80%.
Finishing up with Yahoo, we find that the company has 68.83 million shares outstanding with 67.98 million that float. As of 3/12/07, there were 4.83 million shares out short, representing 7.1% of the float or 6.7 trading days of volume. This is even higher than the prior month's short interest of 4.45 million. This short ratio of almost a week and a half of average trading days is well ahead of my own cut-off of 3 days of short interest being significant. With the terrific earnings report yesterday, one can almost hear the panic purchasing of the short-sellers today scrambling to cover their speculative sales. O.K., I am just guessing, but seriously, with all of the great numbers on this company, who would want to be short?
No dividends are reported on Yahoo and the last stock split was the 3:2 split I mentioned earlier which was declared on May 16, 2006.
What does the chart look like?
If we examine the "Point & Figure" chart on Immucor (BLUD) from StockCharts.com, we can see what appears to be a very steady increase in stock price from $1.75/share in March, 2002, to the current level of $33.76, pushing near the high set in January, 2007, when the stock traded as high as $34. The company appears to be trading strongly and I don't see any weakness in this chart from my own amateur perspective.
Summary: What do I think?
Well, I certainly liked what I first read earlier today (and I read it a bit closer than my quick evaluation of AZZ yesterday), and I thought this was too good a match for my blog to not own some shares. It was an easy decision to trade out of my AZZ and into BLUD. I hope it continues to do well.
The earnings report yesterday was solid. Nobody is lowering guidance on this stock! The company beat expectations on both earnings and revenue. And their Morningstar.com report is almost perfect with steady revenue growth, almost perfect earnings growth, a slowly growing number of shares in the face of a rapid improvement in financial numbers, growing and solid free cash flow, and a very strong balance sheet.
On top of this, the Price/Sales is low relative to its group, the Return on Equity is high, and there are loads of shares out short ready to be 'squeezed'. Valuation wise, the earnings are growing so fast that even with the rich p/e, the PEG is still under 1.0. I like this stock a lot. I didn't marry it lol, but I put it in my portfolio.
Thanks so much for stopping by and visiting! If you have any comments or questions, please feel free to leave them on the blog or email me at bobsadviceforstocks@lycos.com.
Bob
Posted by bobsadviceforstocks at 10:52 PM CDT
|
Post Comment |
Permalink
Updated: Saturday, 7 April 2007 1:38 PM CDT
Immucor (BLUD) and AZZ (AZZ) "Trading Transparency"
Hello Friends! Thanks so much for stopping by and visiting my blog, Stock Picks Bob's Advice! As always, please remember that I am an amateur investor, so please remember to consult with your professional investment advisers prior to making any investment decisions based on information on this website.
I must apologize for nominally breaking my rules. After writing up my review of AZZ yesterday, I realized that I didn't take into consideration the lowered guidance for 2008 when I made my purchase. That just isn't my kind of stock in this blog. And you all know that!
Today, looking at the list of top % gainers, I came across Immucor that I wrote up on Stock Picks way back in April, 2006, a year ago. I shall try to give all of you an updated review of this stock. In any case, a few moments ago I decided to unload my AZZ, and sold my 120 shares at $47.06, and went ahead and purchased 180 shares of BLUD at $33.80.
I made a similar mistake a month or two ago, and reversed a trade that didn't really make sense. It pays to stick to familiar stocks sometime, and as good as I may be (I am just tongue in cheek on this one), I too make what I would call mistakes--these aren't necessarily bad investments, they just don't quite fit into my own strategy. And I reserve the right to admit errors and undo them. I shall work harder to avoid these kinds of trades in the future. They are a distraction from my own thinking.
Anyhow, that's the update. Thus, I now rate
AZZ (AZZ) IS DOWNGRADED TO HOLD and
IMMUCOR (BLUD) IS RATED A BUY
Thanks so much for stopping by and visiting! If you have any comments or questions, please feel free to leave them on the blog or email me at bobsadviceforstocks@lycos.com.
Bob
Wednesday, 4 April 2007
AZZ Inc. (AZZ)
Hello Friends! Thanks so much for stopping by and visiting my blog, Stock Picks Bob's Advice! As always, please remember that I am an amateur investor, so please remember to consult with your professional investment advisers prior to making any investment decisions based on information on this website.
 Earlier today I posted about my purchase of shares of AZZ (AZZ). This company made the list of top % gainers on the NYSE today, closing at $47.7, up $1.86 or 4.05% on the day. As I just noted, I do own shares in AZZ, shares that were purchased today. So please take that into consideration when reading what I am writing. AZZ is not a perfect fit for this blog, nor is it a perfect fit for my portfolio. But it appears to meet many of the things I look for in a stock and with the strong trading momentum, I chose to purchase shares. We shall find out how that trade works out as time goes by. Meanwhile, let's take a closer look at this company and I will share with you some of the things that led me to take a position in this stock when the opportunity arose.
What exactly does this company do?
 According to the Yahoo "Profile" on AZZ, the company
"...manufactures electrical equipment and components for power generation, transmission, and distribution, as well as for industrial markets in the United States and internationally. The company operates in two segments, Electrical and Industrial Products, and Galvanizing Services."
How did they do in the latest quarter?
On January 5, 2007, AZZ announced 3rd quarter 2007 results. For the quarter ended November 30, 2006, revenues increased 47% to $65.4 million from $44.3 million the prior year same period. Net income climbed 203% to $5.3 million or $.88/diluted share, up sharply from $1.7 million or $.30/diluted share the prior year same period.
In the same announcement, the company increased guidance for fiscal 2007 with earnings estimated to be in the range of $3.15 to $3.25/diluted share. Revenues were estimated in the range of $250 to $260 million.
Just two weeks after the earnings report, the company threw some financial "cold water" on the stock price by estimating that fiscal 2008 earnings and revenue would come in below 2007 results. They announced projected earnings of $2.70 to $2.80/share for the fiscal year ended February 29, 2008, on revenue of $275 to $285 million. The market appears to have digested this bit of bad news and is already thinking beyond this estimate as the stock price has now firmed and once again moved towards the upside.
In general, I would prefer not to buy any stock with estimates of an earnings decline. However, in light of the strong revenue growth estimated, and the current strong price move, I was willing to give the stock a chance. We shall have to see how this one works out for me.
How about longer-term financial results?
AZZ has indeed had a bit of an erratic financial past. Looking at the Morningstar.com "5-Yr Restated" financials on AZZ, we find that revenue which was $153 million in 2002, climbed to $183 million in 2003, before dropping back to $136 million in 2004. Since 2004, revenue has climbed to $187 million in 2006 and $231 million in the trailing twelve months (TTM).
Earnings have also been a bit erratic, climbing from $1.50 in 2002 to $1.63/share in 2003, before dropping back to $.79/share in 2004. Since then earnings have been climbing steadily and rather dramatically to $1.38/share in 2006 and $2.93/share in the TTM.
This is a small company with a fairly stable number of shares with 5 million shares reported in 2002 increasing to 6 million in the TTM.
Free cash flow is currently positive but also a bit erratic with $11 million in 2004, $0 in 2005, $6 million in 2006 and $2 million in the TTM.
The balance sheet is solid with $1.1 million in cash and $100.7 million in other current assets. Compared to the $50 million in current liabilities, this $101.8 million in current assets yields a solid current ratio of just over 2.0.
What about some valuation numbers?
Examining Yahoo "Key Statistics" on AZZ, we can see how small a small cap stock this is with a market capitalization of only $280.04 million. The trailing p/e is a reasonal 16.37 with a forward p/e (fye 28-Feb-08) not much different at 16.78.
Looking at the Fidelity.com eresearch website, we find that AZZ has a Price/Sales ratio (TTM) of only 1.15, with an industry average of 34.10. The company is not quite as profitable as other companies in its industry reporting a Return on Equity (ROE) (TTM) of 18.16% slightly lower than the industry average of 20.78%.
Finishing up with Yahoo, we find that there are 5.82 million shares outstanding and 5.57 million that float. As of 3/12/07 there were 213,100 shares out short representing 3.8% of the float or 7.2 trading days of volume. This is a significant short interest from my perspective, relative to my own '3 day rule' for short interest, and may lead the company subject to a short squeeze if any good news is reported. No dividend is paid and no stock split is reported.
What does the chart look like?
If we look at the AZZ "Point & Figure" chart from StockCharts.com, we can see that after a price correction from $20 in February, 2002, to a low of $8.50 in March, 2003, the stock has strongly moved higher the past four years to a high of $55 in January, 2007. The stock recently came under pressure on the back of the guarded guidance for 2008, correcting down to $36, before once again moving higher to the current level of $48.15. The stock does not appear to have broken down key support levels on this chart.
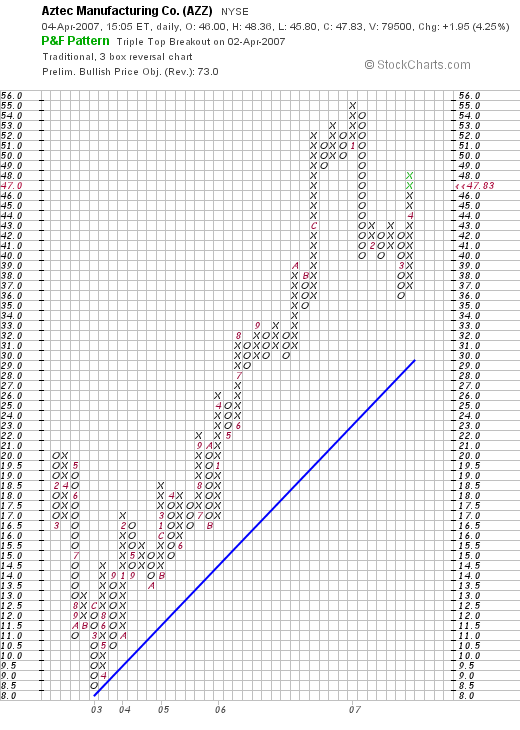
(You can see that AZZ was previously called Aztec Manufacturing)
Summary: What do I think about this stock?
Well, let me say that I chose to purchase this stock. I do not think I gave the reduced guidance for 2008 much attention, and this is a bit of a drag on the stock price. Otherwise, technically the stock is behaving well, the last quarter was very strong, the Morningstar.com report looks solid, valuation is reasonable and the balance sheet looks healthy. I am now a stockholder in this company which is really very small. Wish me well and I shall keep you posted.
Thanks again for visiting! If you have any comments or questions, please feel free to leave them on the blog or email me at bobsadviceforstocks@lycos.com.
Bob
Posted by bobsadviceforstocks at 3:00 PM CDT
|
Post Comment |
Permalink
Updated: Thursday, 5 April 2007 12:00 AM CDT
AZZ Inc. (AZZ) "Trading Transparency"
Hello Friends! Thanks so much for stopping by and visiting my blog, Stock Picks Bob's Advice! As always, please remember that I am an amateur investor, so please remember to consult with your professional investment advisers prior to making any investment decisions based on information on this website.
Earlier this morning I wrote about how I had managed to fortunately hit a first sale point in Jones Soda (JSDA), which for me is a 30% appreciation over my purchase price, and sold 1/6th of my holding....which out of 300 shares represented 50 shares. I also wrote about that darn nickel in my pocket :), which for me means that since I am at 18 positions in my Trading Account, well under my maximum of 25 positions, then with a sale of a portion of one of the 18, that gives me a "permission slip" to add a new position.
You don't have to ask me twice :).
Looking through the list of top % gainers on the NYSE this afternoon, shortly before the close of regular trading, I came across a new name for the blog, a name that I have seen showing up on these lists recently: AZZ Inc. (AZZ). As I write, AZZ is trading at $47.49, up $1.61 or 3.51% on the day. Briefly checking the Morningstar page on AZZ, and the latest quarterly report, things looked good enough for me and I went ahead and purchased 120 shares at $47.34. I shall try to get together a more in depth analysis of AZZ. Meanwhile, I purchased some shares and
AZZ INC. (AZZ) IS RATED A BUY
Thanks again for stopping by and visiting! If you have any comments or questions, please feel free to leave them on the blog or email me at bobsadviceforstocks@lycos.com.
Bob
Jones Soda (JSDA) "Trading Transparency"
Hello Friends! Thanks so much for stopping by and visiting my blog Stock Picks Bob's Advice! As always, please remember that I am an amateur investor, so please remember to consult with your professional investment advisers prior to making any investment decisions based on information on this website.
A few moments ago I sold 50 shares (1/6th of my 300 share holding) of Jones Soda (JSDA) at $24.52. The stock had hit my first 30% appreciation target yesterday but I was not aware of this until after the close of trading. (As I have indicated elsewhere, I am really pretty 'low-tech' about all of this and monitor my stocks and enter my trade orders manually). These shares were just purchased 3/12/07 with a cost basis of $18.22 so I had a realized gain on this sale of $6.30 or 34.6% on this trade. My next sale on the upside would be at a 60% gain or 1.6 x $18.22 = $29.16, at which time I would be selling 1/6th of 250 or 41 shares, or if the stock should decline, I shall sell all of my shares if the stock hits my purchase cost of $18.22. This doesn't change my outlook on this stock and....
JONES SODA (JSDA) IS A BUY.
Since I am now at 18 positions, this gives me a 'signal' to add a new position. I like to say that the nickel is burning a hole in my pocket already, but I shall be fairly busy during the day, so I don't know if I shall make a purchase or not. I shall keep you posted. Meanwhile, as always, I wish you the best of luck and a wonderful day.
Bob
Tuesday, 3 April 2007
"Revisiting a Stock Pick" Aeropostale (ARO)
Hello Friends! Thanks so much for stopping by and visiting my blog, Stock Picks Bob's Advice! As always, please remember that I am an amateur investor, so please remember to consult with your professional investment advisers prior to making any investment decisions based on information on this website.
 I was looking through the list of top % gainers on the NYSE this evening and came across an old favorite of mine, Aeropostale (ARO) which closed at $42.06, up $1.95 or 4.86% on the day. I do not own any shares nor do I own any options on this company.
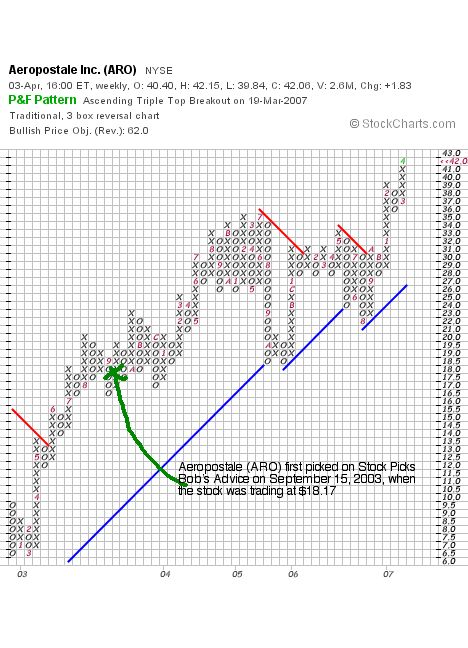
I first posted Aeropostale (ARO) on Stock Picks Bob's Advice on September 15, 2003, when the stock was trading at $27.25. On April 27, 2004, ARO had a 3:2 stock split making the effective stock pick price actually 2/3 of that amount or $18.17. Thus, with today's close, the stock has appreciated $23.89 or 131.5% since posting about 3 1/2 years ago.
Let's take an updated look at this company and I shall try to show you why I believe it still deserves a spot on this blog.
What exactly does this company do?
According to the Yahoo "Profile" on Aeropostale (ARO), the company
 "...operates as a mall-based specialty retailer of casual apparel and accessories for young women and men in the United States. It designs, markets, and sells active-oriented, fashion and fashion basic merchandise principally targeting 11 to 18 year-old young women and young men under its own brands. The company offers graphic t-shirts, tops, bottoms, sweaters, jeans, outerwear, and accessories."
How did they do in the latest quarter?
On March 15, 2007, Aeropostale reported 4th quarter 2006 results. During the quarter total sales increased 16.5% to $506.8 million from $435.2 million for the same quarter in 2005. Same-store sales, a better indicator of the health of a growing retail firm, grew a less robust 2.2%.
Net income for the quarter came in at $57.3 million or $1.08/diluted share. Excluding a 'vendor concession, the company "achieved net earnings of $1.00 per diluted share, representing an increase of approximately 31.6%, when compared to the $.76 per diluted share in the fourth quarter of fiscal 2005."
The company beat expectations of analysts of $.99/share.
How about longer-term results?
Examining the Morningstar.com "5-Yr Restated" financials on ARO, we find that revenue has steadily grown since 2002 when the company reported $202 million in sales. This grew to $1.2 billion in 2006 and $1.34 billion in the trailing twelve months (TTM).
Earnings have increased from $.93/share in 2004 to $1.50/share in 2006 and $1.66 in the TTM. During this same time the company managed to reduce the number of shares outstanding from 55 million in 2004 to 53 million in the TTM.
Free cash flow has been positive and growing with $68 million reported in 2004 increasing to $86 million in 2006 and $125 million in the TTM. The balance sheet appears solid with $203.3 million in cash and $194.7 million in other current assets. This total of $398 million of current assets easily can cover both the $189.5 million in current liabilities and the $101.5 million in long-term liabilities. In fact, the current ratio, which is found by dividing the $398 million in total current assets by the $189.5 million in current liabilities yields a 'healthy' current ratio of 2.1.
What about some valuation numbers?
Examining Yahoo "Key Statistics" on Aeropostale, we find that the market cap at $2.21 billion represents a mid cap stock. The trailing p/e is moderate at 21.20 with a forward p/e (fye 03-Feb-09) of 15.99 even more reasonable. The PEG ratio (5 yr expected) is 0.78, making it also quite reasonably priced. I generally find a PEG of 1.0 to 1.5 an acceptable value.
Looking at the Fidelity.com eresearch website, we find that the Price/Sales (TTM) is a bit rich at 1.51, with an industry average of 1.10. Every once in awhile, I like to point my readers to the wonderful article by Paul Sturm, when he reminded all of us that a Price/Sales ratio is most important when compared to other companies in the same industrial group.
The company while not a great buy on the Price/Sales ratio, is attractive however, because of its profitability--at least as measured by Return on Equity (ROE) (TTM). In this case, ARO comes in at a ROE (TTM) OF 36.55%, ahead of the industry average of 21.96%.
Finishing up with some more Yahoo information, the company has 52.57 million shares outstanding with 51.58 million that float. As of 3/12/07, there were 5.84 million shares out short representing 11.3% of the float or 5 trading days of volume. Personally, I have arbitrarily chosen to use a 3 day cut-off of the short ratio, so this 5 day number may well have the potential of a short squeeze if the company continues releasing strong financial results.
The company does not pay a dividend and the last stock split was the 3:2 stock split on April 27, 2004
What does the chart look like?
If we examine a "Point & Figure" chart on Aeropostale from StockCharts.com, we can see a fairly steady record of price appreciation.
Summary: What do I think about this stock?
Basically, this has been a great stock pick on this blog with a terrific performance. The latest quarter was strong, the company beat earnings expectations and guided in line with the analysts for the upcoming quarter. I was little non-plussed by the 2.2% same store sales growth. Personally, I would like to see a retail firm consistently post close to 5% or greater same store sales growth to really catch my attention--however, in today's relatively weak retail environment, steady growth is important. Keep an eye on this company's same-store numbers in the months ahead! The Morningstar.com report was solid, with steady revenue growth, earnings, free cash flow, decreasing shares outstanding and a solid balance sheet. Valuation shows the Price/Sales a bit rich, but profitability was outstanding as measured by return on equity.
Overall, the numbers are impressive and
AEROPOSTALE (ARO) IS RATED A BUY
Thanks again for stopping by! If you have any comments or questions, please feel free to leave them on the blog or email me at bobsadviceforstocks@lycos.com. Also, if you get a chance, be sure and visit my Stock Picks Podcast Website. I promise to try to get a new podcast up in the next few days. You know how one thing can lead to another and the day is never long enough for everything you figure on doing!
Bob
Sunday, 1 April 2007
"Looking Back One Year" A review of stocks picks from the week of November 7, 2005 and November 14, 2005

Hello Friends! Thanks so much for stopping by and visiting my blog, Stock Picks Bob's Advice! As always, please remember that I am an amateur investor, so please remember to consult with your professional investment advisers prior to making any investment decisions based on information on this website.
It is another weekend! And for me that means, if I don't skip this, doing my proverbial 'housework' around here and looking back at past stock selections on my blog. As part of my effort at transparency and to help make this website somewhat meaningful, I have found it helpful to review, in a systematic fashion, all of my past stock 'picks' when I am a year or so out. (I started almost exactly a year out and then, after missing a weekend here, a weekend there....you get the picture---I am now more like a 1 1/3 year out review!) Since there weren't any stock picks posted for the week of November 7, 205, and since I am already more than a year out, well instead of giving in to my almost joy at realizing there weren't any stocks to review, I decided to jump to the week of November 14, 2005, and take a look at those stock picks. (A I dedicated or what?...no answers please :))
These "reviews" do not reflect actual holdings of mine, my actual trading strategy, and the effects of taxes and partial sales of stocks, etc. These are simply a simplified way of looking at past stock selections and seeing simply if they moved higher or lower since being posted! In other words, the review of performance assumes a 'buy and hold' strategy and equal dollar purchases of each stock from the week involved. I calculate the average performance of the stocks by getting the mean of the performance of all of the stocks discussed.
In my own Trading Portfolio, and what I write about here, is a strategy that is very different. I recommend aggressively selling losing stocks quickly and completely, initially at 8% loss levels, and gaining stocks slowly and partially at targeted appreciation points. This strategy is key to my own portfolio management philosophy and the difference between 'buying and holding' and actively managing the portfolio would certainly make a difference in the outcomes. I use the buy and hold evaluation technique simply because I am actually fairly low tech in my approach. I do not have any software to assess what might have happened and simply put, I think a review like this is adequate to give you, the reader, an idea about these stocks.
 On November 14, 2005, I 'revisited' DJ Orthopedics (DJO) on Stock Picks Bob's Advice when the stock was trading at $31.35. I use the term "revisit" because my first 'pick' of DJ Orthopedics (DJO) on this blog was on August 22, 2003 when the stock was trading at $10.89. Unfortunately, I have never owned any shares or options on this stock. DJO closed at $37.90 on March 30, 2007, for a gain of $6.55 or 20.9% since posting.
Here is a "Point and Figure" Chart on DJO from StockCharts.com:
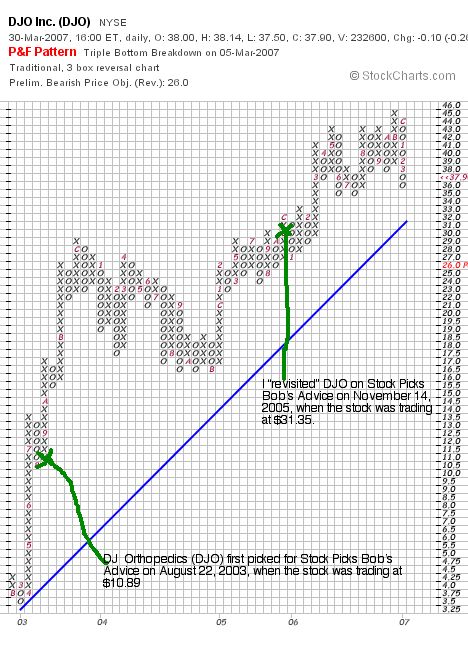
On February 12, 2007, DJO announced 4th quarter 2006 results. Net revenues for the quarter came in at $110.8 million, up 47.8% from the $75.0 million in the fourth quarter of 2005. Net income, however, dropped to $1.0 million down from $8.1 million in the prior year same period or $.04/share, down from $.35/share. Even using "Non-GAAP" numbers, removing impact of stock-based charges, cost of acquisitions, and the company move to a new headquarters, net income still dropped to $.31/share down from $.35/share. This company has a superb record of revenue growth, however, with the drop in income in the latest quarter, the best I can do is rate
DJ ORTHOPEDICS (DJO) IS RATED A HOLD

On November 16, 2005, I posted Gilead Sciences (GILD) on Stock Picks Bob's Advice when the stock was trading at $55.63. GILD closed at $76.65 on March 30, 2007, for a gain of $21.02 or 37.8% since posting. I do not own any shares nor do I have any options on this stock.
Here is a "Point & Figure" Chart on Gilead from StockCharts.com:
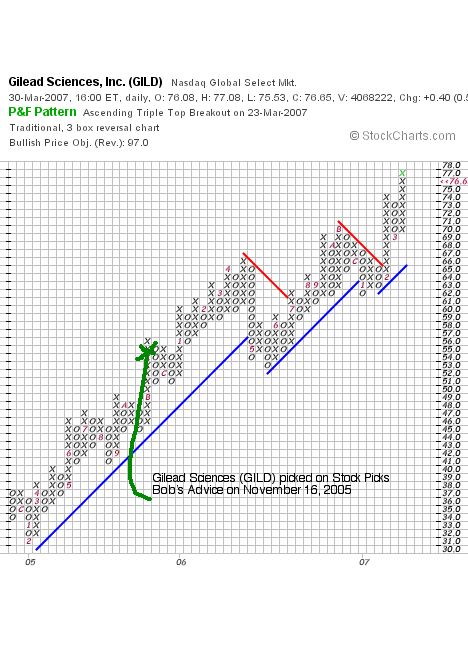
On January 31, 2007, Gilead Sciences announced 4th quarter 2006 results. Total revenue for the fourth quarter of 2006 came in at $899.2 million, up 48% from prior year sales. GAAP net income was a net loss of $1.67 billion or $(3.62)/share, compared to a net income of $281.6 million or $.59/diluted share for the same quarter in 2005. Looking at 'Non-GAAP' net income was $372.8 million or $.78/share compared with last year's Non-GAAP net income for 2005 of $256.5 million or $.54/diluted share, which eliminates one-time tax expenses and expenses related to stock-based compensation and similar items. I much prefer GAAP results, but the prospects, if I may editorialize, for Gilead are such that I shall place
GILEAD SCIENCES (GILD) IS RATED A BUY
 On November 18, 2005 I "revisited" Marvell Technologies (MRVL) on Stock Picks Bob's Advice when the stock was trading at $55.70. I first looked at Marvell on May 21, 2004, when the stock was trading at $42.99. Marvell had a 2:1 stock split on June 29, 2004 and another 2:1 stock split on July 25, 2006, making the initial stock pick price $10.75, and the second pick price actually $27.85. MRVL closed at $16.81 on March 30, 2007, for a loss of $(11.04) or (39.6)% since the latest post.
Here is the "point and figure" chart on Marvell and my stock pick prices:
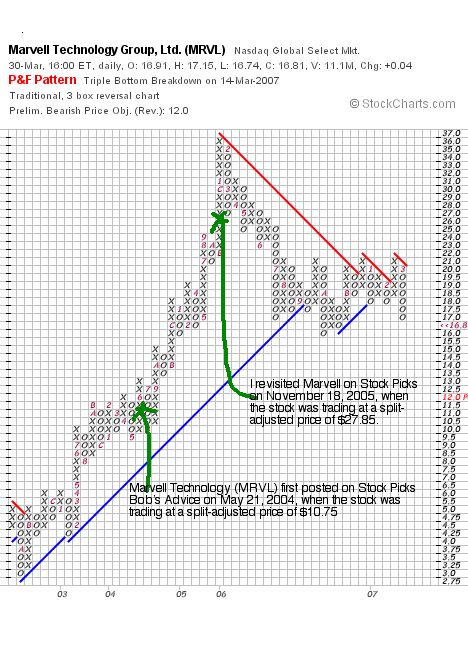
On Feberuary 26, 2007, Marvell reported preliminary 4th quarter 2006 results showing a 27% revenue growth from $489 million to $622 million in the latest quarter. The company, however, delayed earnings per share results as there is an ongoing review of stock option granting practice. A month later, the company continues to delay earnings results making assessment of the financial operations from my perspective most difficult.
In light of this,
MARVELL (MRVL) IS RATED A SELL
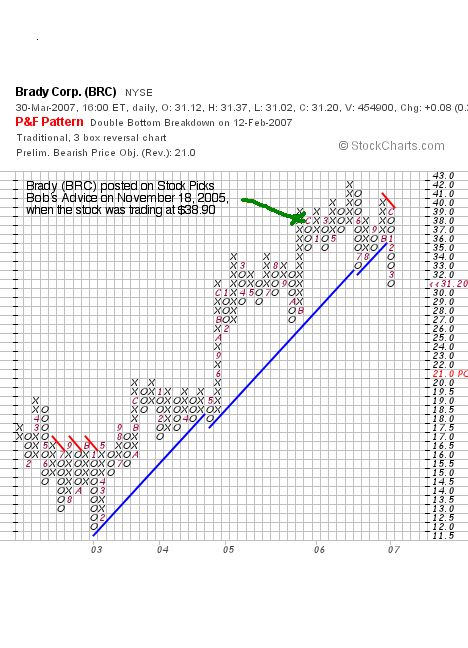
 Finally, on November 18, 2005, I posted Brady Corp (BRC) on Stock Picks Bob's Advice when the stock was trading at $38.90. BRC closed at $31.20 on March 30, 2007, for a loss of $(7.70) or (19.8)% since posting.
On February 21, 2007, Brady (BRC) announced 2nd quarter 2007 results. Sales for the quarter were up a strong 39.1% to $321.3 million, compared to $231.0 million in the 2nd quarter of 2006. However, net income for the quarter fell 7.3% to $19.7 million from $21.3 million the prior year. Earnings per diluted Class A shares came in at $.36/share in the 2007 quarter, down from $.43 in the 2nd quarter 2006.
With the strong revenue growth and the anemic earnings results,
BRADY (BRC) IS RATED A HOLD.
The following is a "Point & Figure" chart on Brady (BRC) from StockCharts.com:
So how did I do with these four picks during the week of November 14, 2005?
Of the four stocks, two gained, and two lost money for an average performance of a loss of (.2)% on these four stocks!
Thanks again for visiting! If you have any comments or questions, please feel free to leave them on the blog or email me at bobsadviceforstocks@lycos.com. Have a great week trading and investing everyone!
Bob
Posted by bobsadviceforstocks at 11:53 AM CDT
|
Post Comment |
Permalink
Updated: Monday, 2 April 2007 1:22 AM CDT
Newer | Latest | Older


