Stock Picks Bob's Advice
Wednesday, 12 March 2008
Participating in Seeking Alpha
 It is with a great deal of pleasure to let all of you know that I shall be participating in Seeking Alpha. You can visit my bio page here. (You may notice that I have updated my picture as well.)
Seeking Alpha is the brainchild of David Jackson. In his biography, it is noted:
 "David Jackson worked for five years as a technology research analyst for Morgan Stanley in New York. He left in early 2003 to manage money (long/short) and explore new approaches to financial publishing, ultimately leading to the creation of Seeking Alpha. Prior to Morgan Stanley he worked in technology venture funding and macro-economics (HM Treasury in London and The Bank of Israel). He has a B.A from Oxford University and an MSc from The London School of Economics."
Kiplinger in 2007 listed Seeking Alpha as the best website for financial information.
There is no monetary compensation for me involved in this association. In fact Bill Rempel, a.k.a. NO DooDahs! wrote an interesting piece complaining about this failure to provide a share in the revenue with submissions. As for me, at this point in my life, I am enjoying the greater exposure to readers who are interested in what I am writing about, and the opportunity of entering into larger disussions on the subjects I blog about.
It is estimated, unless I have it wrong, that Seeking Alpha had 535,658 unique visits in the month of February 2008. I generally get about 200 visits a day here. So you know I am smiling.
I am looking forward to this association. In fact I am proud to share my Seeking Alpha 'medal of approval' on the blog! O.K., I am just an amateur, and I get excited about these things :).
Thanks so much for dropping by and visiting! I shall continue to strive to produce good content for all of you readers and now Seeking Alpha visitors. If you have any comments or questions, please feel free to leave them on the blog or email me at bobsadviceforstocks@lycos.com.
Yours in investing,
Bob
Tuesday, 11 March 2008
Inter Parfums Inc. (IPAR) "Revisiting a Stock Pick"
Hello Friends! Thanks so much for stopping by and visiting my blog, Stock Picks Bob's Advice! As always, please remember that I am an amateur so please remember to consult with your professional investment advisers prior to making any investment decisions based on information on this website.
What a difference a day makes!
The market took off to the upside after the Federal Reserve announced a "$200 billion Term Securities Lending Facility" which will assist banks and financial firms to "liquify" their mortgage-backed securities. These securities have been one of the problems facing the financial world. As reported yesterday:
"In recent days some large private funds that had bought mortgage-backed securities with borrowed money said their lenders were demanding that the funds put up more capital to cover the declining value of the securities. Such "margin calls" can force funds to dump securities they hold, in turn driving markets lower.
Carlyle Capital, a $21-billion-asset mortgage securities fund that was hit with margin calls last week, said Monday that it was continuing to talk to its lenders about forbearance.
After regular trading ended Monday, MFA Mortgage Investments, a New York-based fund, said it had sold $1 billion in mortgage-backed securities since Friday to pare back its use of borrowed money."
After the Fed move, markets responded and moved higher with the Dow closing at 12,156.81, up 416.66 and the Nasdaq up 86.42 to 2,255.76, and the S&P 500 closing at 1,320.65 (3/11/08).
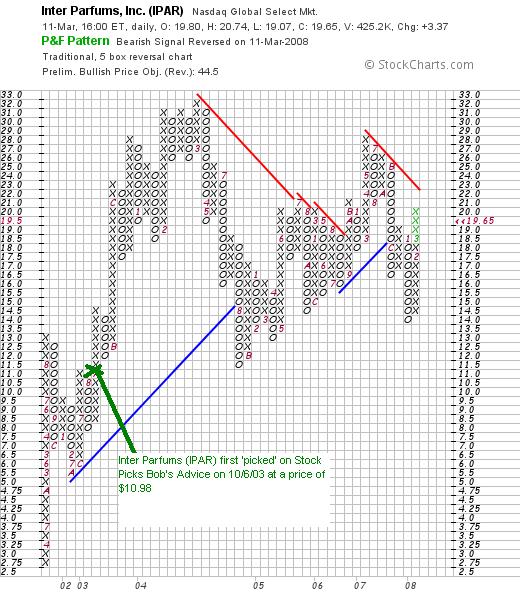
 With this broad-based rally, it wasn't hard to find a stock 'to like' today that fits my own investment philosophy. In fact, I noticed that an 'old name' Inter Parfums (IPAR) had made the list of top % gainers on the Nasdaq today, closing at $19.65, up $3.37 or 20.70% on the day. I do not own any shares or options on this equity. However, I do write 'old name' because I first posted Inter Parfums (IPAR) on Stock Picks Bob's Advice back on October 6, 2003, about 4 1/2 years ago! At that time, IPAR was trading at $10.98. Based on today's closing price of $19.65, this represents an appreciation of $8.67 or 79.0% since posting.
Let's take a closer look at IPAR and I shall explain why
INTER PARFUMS (IPAR) IS RATED A BUY
First of all what exactly does this company do?
According to the Yahoo "Profile" on Inter Parfums, the company
 "...along with its subsidiaries, manufactures, markets, and distributes fragrances and fragrance-related products in Europe and the United States. It produces and distributes prestige fragrance products under various brands, which include Burberry, Lanvin, Paul Smith, S.T. Dupont, Christian Lacroix, Quiksilver/Roxy, Van Cleef & Arpels, and Nickel. The company markets fragrance products, cosmetics, and skin care products primarily under license agreements with brand owners. It also produces and distributes fragrance, personal care, and home fragrance products under Banana Republic and Gap brand names; alternative designer fragrances and personal care products; mass market fragrances under proprietary brand names, as well as a license for the Jordache brand; Aziza line of eye shadow kits, mascara, and pencils for the young teen market; and health and beauty aids under Intimate brand name, including shampoos, hand lotions, conditioners, and baby oils for specialty retailers, mass market retailers, and discount chains in the United States and Canada."
How did they do in the latest quarter?
As is often the case with a sharp move in a stock, it was the earnings announcement after the close of trading yesterday that pushed IPAR stock sharply higher today. Inter Parfums announced 4th quarter 2007 results. Net sales increased 32% to $119.4 million, up from $90.2 million. net income increased 57% to $8.6 million from $5.5 million. Diluted earnings per share came in at $.41/share, up 52% from $.27/share during the period ended December 31, 2007.
The company beat expectations with these results as analysts, according to Reuters Estimates, expected earnings of $.34/share on revenue of $107.6 million. In that same news report, it was reported that the company also raised guidance for 2008 to $1.25/share on revenue of $442 million in 2008. Just two months ago, in January, the company had guided to earnings of $1.16/share on net sales of $437 million. The company had been expected to come in at $1.14/share on revenue of $438.4 million according to Reuters Estimates.
As I have described in other blog entries (for example here and here), a "trifecta plus" in an earnings report that for me involves a strong report with increasing revenues and earnings, with the particular company exceeding expectations and raising guidance.
IPAR has done all of this! And the market loved the announcement!
What about longer-term results?
Reviewing the Morningstar.com "5-Yr Restated" financials, we can observe the strong and steady growth in revenue from $130.4 million in 2002 to $321.1 million in 2006 and the $360.4 million in the trailing twelve months (TTM). During this time, earnings have steadily grown from $.47/share in 2002 to $1.00 in the TTM (except for a slight dip from $.77/share in 2004 to $.75/share in 2005). The company pays a dividend and has increased it fairly regularly from $.06/share in 2002 to $.16/share in 2006 and $.19/share in the TTM. Outstanding shares are quite stable with 20 million in 2002 and an increase to only 21 million in 2006 and the TTM. In the same time period, revenues climbed almost 200% and earnings were up in excess of 100%.
Free cash flow, while not showing significant growth, is positive at $9 million in the trailing twelve months. The balance sheet is solid with $54 million in cash and $240.0 million in other current assets. Thus, this total of $294 million in current assets, when compared to the $122.4 million in current liabilities yields a current ratio of 2.4.
What about some valuation numbers?
Examining the Yahoo "Key Statistics" on IPAR, we find that this is a small cap stock with a market capitalization of only $401.59 million. the trailing p/e is reasonable imho at 19.63 with a forward p/e (fye 31-Dec-08) estimated at 15.00. With the steady growth in earnings expected, the PEG ratio is very reasonable at 0.95.
Using the Fidelity.com eresearch website, we can see that the Price/Sales (TTM) ratio is reasonable at 0.92 compared to the industry average of 1.73. In terms of profitability, the Return on Equity (TTM) isn't quite as impressive at 12.51% compared to the industry average of 42.83%.
Returning to Yahoo, we find that there are 20.44 million shares outstanding with 9.44 million that float. Of those that float, 988,960 shares were out short as of 2/12/08, representing 10.3% of the float or 13 trading days of volume! Using my own idionsyncratic '3 day rule' for significance, this represents a whole lof of shares out short as of last month, setting up for what may well have been a short squeeze today on the good news of strong earnings results.
As reviewed above, the company does pay a small dividend of $.20/year yielding 1.20%. The company last split its stock on September 17, 2001, with a 3:2 stock split.
What does the chart look like?
Reviewing the 'point & figure' chart on Inter Parfums (IPAR) from StockCharts.com, we can see that the stock has moved very nicely from $2.75/share in 2001 to a high of $32 in March, 2004. the stock has struggled to reach that level since then making back to only $28 in May, 2007, only to dip back to a low of $14 in January, 2008. The stock is trading below resistance levels and it would be nice to see this stock break through $23/share to feel more comfortable regarding the technical appearance of the chart imho.
Summary: What do I think about this stock?
Well, I cannot say that I understand this stock from a Peter Lynch perspective :), but seriously I really do like this stock. The latest quarterly report was quite strong, beating estimates on both revenue and earnings with the company raising guidance above the street's expectations. The company has a pretty solid record of growth the past five years, they have a stable number of shares outstanding, and they even pay a dividend that they have been steadily increasing!
Free cash flow is positive and the balance sheet appears solid.
Valuation-wise the p/e is in the teens with a PEG under 1.0. The price/sales ratio is cheap but the Return on Equity figure is a bit anemic relative to similar companies. In addition, there are lots of short-sellers out there who have already sold shares and with the current price rise, may well be hustling to cover their shorts. Technically, the chart certainly doesn't look like it is getting ahead of itself, but I would like to see the stock move a bit higher prior to feeling like it has broken its previous drift lower. I am not ready to buy shares, but if I were in the market, this is the kind of stock I would be adding to my portfolio!
Thanks again for visiting! If you have any comments or questions, please feel free to leave them on the blog or email me at bobsadviceforstocks@lycos.com. If you have time, be sure and stop by and visit my Covestor Page where my current trading portfolio is reviewed an assessed, my SocialPicks page where my picks from the last year have been reviewed, and my Podcast page where you can download a radio show that I have put together discussing some of the many stocks mentioned on this blog.
Good luck trading and investing tomorrow! Remember, "Don't fight the Fed!"
Yours in investing,
Bob
Sunday, 9 March 2008
Westcorp (WES) "Long-Term Review #16"

Hello Friends! Thanks so much for stopping by and visiting my blog, Stock Picks Bob's Advice! As always, please remember that I am an amateur investor, so please remember to consult with your professional investment advisers prior to making any investment decisions based on information on this website.
One of the things I have tried to do on my blog is to look back on past stock picks and find out how they turned out. With the blog heading towards five years of age, and with the posts approaching 1,700, this does become a bit awkward at times. Thus, I have done the one year reviews and the "long-term reviews" which look at the earliest posts on this website.
Last weekend I discussed Dearborn (DEAR) which was originally posted on May 27, 2003. The next stock was also originally posted on May 27, 2003: Wescorp (WES).
This is what I wrote:
"May 27, 2003
Westcorp (WES)
Continuing to scan the lists tonight before checking out for the day, I was hoping to find something sexier than another financial. However, using out criteria, that was all that I could find. Please feel free to suggest other issues anytime!
According to CNN.money, WestCorp is "a financial services holding company providing automobile lending through WFS Financial, and community and mortgage banking through Western Financial Bank."
Last month, on April 23rd, WestCorp reported their earnings for the first quarter of 2003. In summary, per the NYTimes on the Web, net income rose 40% to a record $23.5 million for the quarter, EPS increased 30% to $60 for the quarter, and total revenues grew 22% to $194 million for the quarter. An outstanding last quarter....one of the main criteria of our selection methodology.
For the last 5 years, looking at Morningstar, we see STEADY growth (another criterion), from $0.4 billion in 1998, to $0.5 billion in 1999, $0.8 billion in 2000, $1.0 billion in 2001, and $1.2 billion in 2002.
Unfortunately, the entries on cashflow and assets and liabilities are NOT included in complete form on Morningstar but the rest of the numbers look excellent.
WES closed the day ar $24.41 or up $1.70 (7.49%).
Have a great evening and please stop by again soon!
Bob"
Fortunately for this reviewer, this will be a short review :). On September 12, 2005, Wachovia
announced the acquisition of Westcorp (WES) for 1.2749 shares of Wachovia. With Wachovia (WB) closing at $27.22, assuming that WES shareholders were still holding onto their WB stock, this would represent 1.2749 x $27.22 = $34.70. With WES trading at $24.41 for the post, this would be a gain (despite the recent
sharply lower price of WB and all of the financials!) of $10.29 or 42.2% since posting!
Thanks so much for stopping by and visiting! If you have any comments or questions, please leave them on the website or email me at bobsadviceforstocks@lycos.com.
If you get a chance, be sure and visit my
Covestor Page where my actual Trading Portfolio is monitored, my
SocialPicks page where my stock picks from the past year or so have been monitored and evaluated, and my
Podcast Page where you can download some mp3's of me discussing some of the many stocks reviewed on this blog!
Have a great week!
Yours in investing,
Bob
"Looking Back One Year" A review of stock picks from the week of August 21, 2006

Hello Friends! Thanks so much for stopping by and visiting my blog, Stock Picks Bob's Advice! As always, please remember that I am an amateur investor, so please remember to consult with your professional investment advisers prior to making any investment decisions based on information on this website.
I haven't been very busy posting this past week. There really hasn't been much to write about except the continuing challenge to the markets by the ongoing correction. My own Trading Portfolio is down to just 6 positions, from my maximum of 20 and just above my minimum of 5. These positions are: Copart (CPRT), Covance (CVD), IHS (IHS), Morningstar (MORN), ResMed (RMD) and Meridian (VIVO).
Especially with just 6 positions, it is easy to have one stock exert an inordinate amount of effect on the portfolio. This is exactly what happened Friday when Copart disappointed investors with their quarterly report. The stock plunged $(3.93) or (10)% to $35.50, erasing much of the 'paper profits' on this holding. However, with the stock trading above my cost of $33.72, and with the report not really being bad enough from my perspective to unload the shares, I hang on and take my 'licks' from this correction
As part of my weekend activity on this blog, I have been trying to look back at stocks I posted a year ago. Having missed several weeks along the way, it is really a retrospective analysis of stocks selected for this blog more like 1 1/2 years earlier! In any case, I work week by week through past stock selections to find out what worked, what didn't, and can we possibly learn from these selections.
This review assumes a buy and hold approach to investing. In reality, I use a disciplined portfolio management strategy designed to limit losses by quick sales of declining stocks and retaining gains by partial sales at appreciation targets. The difference between these two strategies would certainly affect eventual investment performance. But for the ease of analysis, I shall continue to do my reviews assuming a passive buy and hold strategy for these stock picks.
 Last weekend I reviewed the pick(s) from the week of August 14, 2006. Let's move a week ahead and take a look at the activity on this blog for the week of August 21, 2006. Fortunately for this reviewer, I only 'picked' one stock on the blog during the week of August 21, 2006. Unfortunately for this reviewer it was a bust!
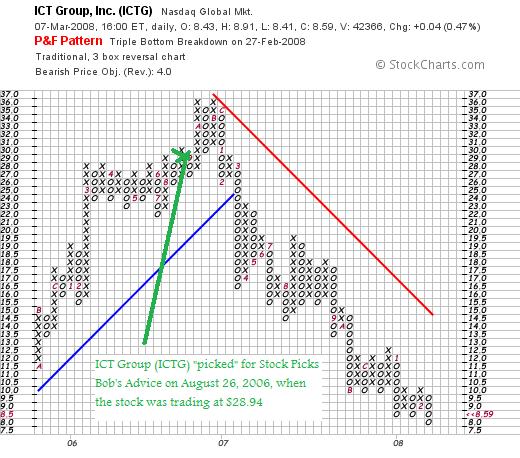
On August 26, 2006, I posted ICT Group (ICTG) on Stock Picks Bob's Advice when the stock was trading at $28.94. ICTG closed at $8.59 on March 7, 2008, for a loss of $(20.35) or (70.3)% since posting. (We can see from this price performance, that maintaining a loss limit of (8)% or whatever you choose, would be better than picking a stock and blindly hanging on!)
Let's take a closer look at this stock and I will explain why
ICT GROUP (ICTG) IS RATED A HOLD
First of all what does this company do?
According to the Yahoo "Profile" on ICT Group (ICTG), the company
 "...and its subsidiaries provide outsourced customer management and business process outsourcing solutions. It offers customer care/retention, technical support and customer acquisition, and cross-selling/upselling services, as well as market research, database marketing, data capture/collection, email management, collections, and other back-office business processing services."
How did they do in the latest quarter?
On February 27, 2008, ICTG reported 4th quarter 2007 results. Revenue for the quarter ended December 31, 2007, came in at $112.5 million, down from $117.2 million the year earlier. The company reported a net loss of $(3.0) million or $(.19)/diluted share. Excluding one-time expenses, the company came in with net income of $922,000 or $.06/diluted share. In any case, compared to last year, this was way down from the $5.1 million in net income or $.32/diluted share reported. Even with the excluded items, the company failed to meet expectations on revenue for the quarter of $114.6 million but did beat on earnings which had been expected to come in at $.03/share
The company was not very optimistic about 1st quarter 2008 results:
"For the first quarter of 2008, the Company expects revenue to be slightly below fourth quarter 2007 levels. As indicated during the Company’s third quarter earnings call, first quarter expenses will be higher than normal due to seasonal factors, as well as for training and other start-up costs associated with a large contract won in the third quarter and the completion of the accelerated ramp-up of ICT GROUP’s offshore facilities. Consequently, first quarter 2008 diluted earnings per share are expected to result in a loss of $0.03 to $0.07 per diluted share."
This reduced guidance was well below street expectations.
What about longer-term results?
Reviewing the Morningstar.com "5-Yr Restated" financials on ICTG, we can see that the revenue picture is intact with steady increases from $299 million in 2002 and $448 million in 2006 and $458 million in the trailing twelve months (TTM). Earnings, however, have dipped from the $1.11/share reported in 2006 to a loss of $(.24)/share in the TTM.
Free cash flow has also turned negative at $(4) million from 2006 when $9 million of free cash flow was generated. The balance sheet is still solid with $24 million in cash and $101 million of current assets, compared to current liabilities of $47.3 million and a nominal amount of long-term debt recorded at $6.5 million. This $125 million in current assets yields a current ratio of over 2.0 when compared to the current liabilities of $47.3 million.
What about valuation numbers?
Reviewing Yahoo "Key Statistics" on ICTG, we can see that this is a small cap stock with a market capitalization of only $135.64 million. There is no trailing p/e recorded, but the PEG is cheap at $.73 and the forward p/e is also cheap at 10.23 (fye 31-Dec-09).
Reviewing the Fidelity.com eresearch website, we find that the Price/Sales (TTM) is cheap at 0.30 compared to the industry average of 2.05. With the recent losses, the Return on Equity (ROE) (TTM) is reported at (7.23)% compared to the average of 27.89 in the industry per Fidelity.
Finishing up with Yahoo, we can see that there are only 15.79 million shares outstanding with 8.91 million that float. Of these 618,890 shares were out short as of 2/12/08, representing 7.1 trading days of volume or 6.4% of the float. This is significant and represents some bullish possibilities with the ratio well above my own '3 day rule' for short interest.
No dividends and no stock splits are reported on Yahoo.
What does the chart look like?
Reviewing the "point & figure" chart on ICT Group (ICTG) from StockCharts.com, we can see how the stock climbed from October, 2005, when it was trading at $11.50 to a peak of $36 in November, 2006. The stock has declined steadily since that time to the current low of $8.59 just pennies above the recent low of $8.
Summary: What do I think?
When I first started writing up this particular stock to review, I initially ranked this as a "sell". But it just seems too late to be advocating a "sell" on a stock that is as decimated as this one is. The forward p/e (if it can indeed once again turn profitable) is only 10 or so. The PEG is well under 1.0, the Price/Sales ratio is cheap. What this has turned into is a value play. Not my kind of stock at all. But it appears too late to be advocating a 'sell'. Thus, the 'hold'.
If the stock can indeed turn around in a couple of quarters, we may well see this stock moving higher once again beyone its very depressed levels.
THAT was the only stock I picked during that week back in August, 2006. And it was a humdinger. This stock emphasizes, and I cannot overemphasize this point, the imperative of limiting losses and not riding a stock down all the way from a peak. Thus, my performance for that week back in August, 2006, was a loss of (70.3)% on my pick--the only stock selected for the blog. Probably the worst week I have reviewed for awhile.
Thanks again for visiting! If you have any comments or questions, please feel free to leave them on the blog or email me at bobsadviceforstocks@lycos.com.
If you get a chance, be sure and visit my Covestor Page where my trading portfolio is analyzed, my SocialPicks page where you can view my picks from the last year or so, and my Podcast Page where my podcasts are stored for you listening pleasure!
Hoping we all have a little more profitable week in the days ahead!
Yours in investing,
Bob
Posted by bobsadviceforstocks at 5:17 PM CST
|
Post Comment |
Permalink
Updated: Sunday, 9 March 2008 5:18 PM CST
Tuesday, 4 March 2008
Silicom (SILC) "Trading Transparency"
Hello Friends! Thanks so much for stopping by and visiting my blog, Stock Picks Bob's Advice! As always, please remember that I am an amateur investor so please remember to consult with your professional investment advisers prior to making any investment decisions based on information on this website.
A few moments ago I sold my 350 shares of Silicom (SILC) at $13.62. These shares had been purchased 1/28/08 at a cost basis of $13.67. Thus, they just went 'into the red' for me, starting to generate an unrealized loss. Since I had added these shares into my portfolio as a result of a trade (the last position from any trades), and I had already sold these shares once at a profit, my 'trading strategy' directed me to unload these shares once they passed break-even. And I did.
Thus, I am now down to six positions. I shall be sitting on my hands with the proceeds of this trade as it was a sale on 'bad news'. And since I am still above my minimum of 5 positions (but getting close), it is not necessary to replace this holding.
With my own sale of Silicom, I am reducing my rating on the stock:
SILICOM (SILC) IS RATED A HOLD
You might ask why I don't reduce my rating to "sell" since I sold my own shares. Basically, since I sold on a personal technical reason, and not because of any fundamental knowledge that I am aware of, it didn't make sense to change this rating to a sell. However, I always suggest that we all place limits to our positions to reduce the possibility of incurring a large loss. Anyhow, that's my take on this perspective.
Thanks so much for stopping by! If you have any comments or questions, please feel free to leave them on the blog or email me at bobsadviceforstocks@lycos.com.
Yours in investing,
Bob
Sunday, 2 March 2008
"Investment Strategy" and "After Apple-Picking" by Robert Frost--I post another Podcast!
Hello Friends! Thanks so much for stopping by and visiting my blog, Stock Picks Bob's Advice! As always, please remember that I am an amateur investor, so please remember to consult with your professional investment advisers prior to making any investment decisions based on information on this website.
Tonight I became ambitious and posted a second podcast about my investment strategy and I also read a poem by Robert Frost, "After Apple-Picking."
CLICK HERE TO LISTEN TO THIS PODCAST
If you have any comments or questions please feel free to leave them on the blog or email me at bobsadviceforstocks@lycos.com.
Yours in investing,
Bob
FTI Consulting (FCN) "A New Podcast!"
 Hello Friends! Thanks so much for stopping by and visiting my blog, Stock Picks Bob's Advice! As always, please remember that I am an amateur investor, so please remember to consult with your professional investment advisers prior to making any investment decisions based on information on this website.
I have been working hard to catch up with a few things this weekend. Including a podcast!
CLICK HERE FOR MY PODCAST ON FTI CONSULTING (FCN)!
Have a wonderful week and I hope you enjoy my podcast!
Yours in investing,
Bob
Posted by bobsadviceforstocks at 5:57 PM CST
|
Post Comment |
Permalink
Updated: Sunday, 2 March 2008 6:18 PM CST
Saturday, 1 March 2008
Dearborn Bancorp (DEAR) "Long-Term Review #15"
Hello Friends! Thanks so much for stopping by and visiting my blog, Stock Picks Bob's Advice! As always, please remember that I am an amateur investor, so please remember to consult with your professional investment advisers prior to making any investment decisions based on information on this website.
It is hard for me to believe that I am approaching my fifth anniversary here on this blog. My first entry was posted back on May 12, 2003. And since then I now have a total of 1,766 entries (not including this one). Needless to say, it is hard to find entries when there are so many to go through! And it is even harder to assess how all of these stocks discussed and revisited are doing. With that in mind, I started a new entry called "Long-Term Review" and have been trying to dig back into the early days of the blog and share with you how those stocks all turned out.
They haven't all been profitable.
My last long-term review was done on October 21, 2007, when I reviewed NVR as my 'long-term review #14' from May 23, 2003. My next stock picked on the blog was Dearborn Bancorp (DEAR) which I wrote up on May 27, 2003.
I wrote:
"May 27, 2003
Dearborn Bancorp (DEAR)
It is after the close. I like to post mid-day if possible but yikes I have to make a living too! Got back to my office and saw the market was up some 179 points today at the close. And our stocks did great. Looking at last week's pick of SYNO, boy was that ever timely. I know I broke my rules buying it but sometime you just have to!
Looking at our lists of greatest % gainers on the NYSE/NASDAQ/AMEX, I have come across a bank. Dearborn Bancorp in particular. I do not, nor does anyone in my family own any shares...nore do I plan to buy at this time.
Dearborn had a GREAT day closing at $22.50 on the day, up $3.00 or 15.38%. That's a lot better than my CD at Wells Fargo which auto-renewed this past month at 0.8%....after-hours the stock is up further to $23.00 or up $.50 or another 2.22%. So what is the news?
Today, Dearborn announced a 5% stock dividend. Doesn't really mean any cash in your pocket....in reality stock dividends are dilutional....but psychologically, in the strong market, I guess someone thought it was a pretty good idea.
In addition, on April 16th, Dearborn Bancorp, 'the holding company for Community Bank of Dearborn', reported earnings of $580,000 for the quarter ending 3/31/03. This 'represented a 21.6 percent increase over the Corporations cearnings of $477,000 in the same quarter of 2002.' per the NYTimes on the Web. Fully diluted, eps was $.20 vs $.18 a little over a 10% increase.
Total assets increased 35.2% during the same period and total deposits were up 36.2%, and total loans grew by 38.1% in the same period. This bank is making money! Technically the stock has been quite strong the past few months.
Looking at Morningstar for a 5 year review, we see that revenues have grown from $5.7 million in 1997, to 8.8 million in 1998, 10.2 million in 1999, 13.3 million in 2000, 16.0 million in 2001 and 18.7 million in trailing twelve months.
EPS have grown the last four quarters (prior to current reported quarter) by 44.64%, 61.54%, 199.58% and 58.66%. We do not have a cash flow assessment on this on Morningstar.
There may be other people who are better at assessing bank stocks which have their own group of analysts. However, on our little system, Dearborn showed up today on the list and it deserves a mention! Bob"
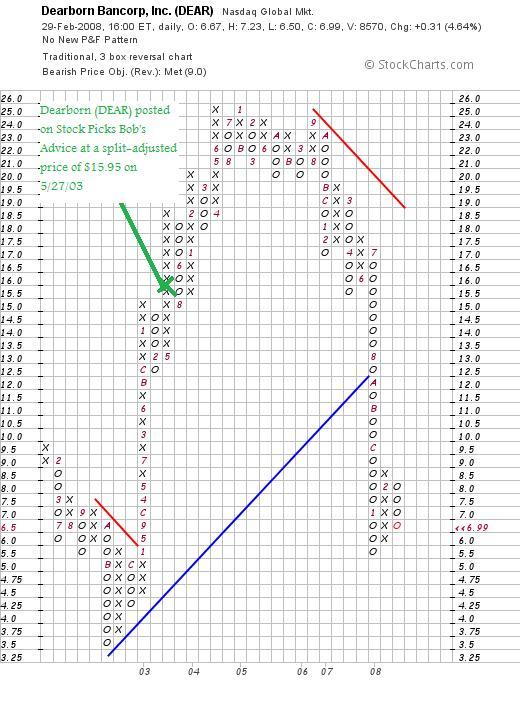
Dearborn (DEAR) has had a series of 5% stock dividends. Thus adjusting for multiple splits we get an adjusted pick price of $22.50 x 100/105 (2003) x 100/105 (2003) x 100/105 (2004) x 100/105 (2004) x 100/105 (2005) x 100/105 (2006) x 100/105 (2006) = $15.95.
Anyhow, DEAR closed at $6.99 for a loss of $(8.96) or (56.2)% since posting.
How did they do in the latest quarter?
On January 15, 2008, Dearborn Bancorp (DEAR) reported 4th quarter 2007 results. For the quarter ended December 31, 2007, net income was $398,000 or $.05/diluted share, compared to net income in 2006 during the same period of $2,252,000 or $.29/diluted share.
What about longer-term?
Checking the Morningstar.com "5-Yr Restated" on DEAR, we find that revenue has continued to increase from $12 million in 2002 to $29 million in 2006 and $34 million in the trailing twelve months (TTM).
Earnings, however, peaked at $1.20/share in 2005 from $.66/share in 2002. Earnings dipped to $1.17/share in 2006 and down to $.59/share in the TTM.
Outstanding shares have increased from 4 million in 2002 to 7 million in the TTM. This is o.k. in light of the revenue increase, but earnings during this period, with the latest dip included, means that they are actually lower dipping from $.66/share in 2002 to $.59/share in the TTM.
Free cash flow is negative at $(34) million in 2004, $(2) million in 2005, $(53) million in 2006 and $(47) million in the TTM.
I know that we cannot really judge banking stocks in the same fashion as we do companies that make some sort of 'widget', but still, the numbers are discouraging.
What about the chart?
Reviewing the 'point & figure' chart on Dearborn (DEAR) is a bit discouraging. The stock made a terrific move higher from $3.50 in November, 2002, to a peak of $25 in June, 2004. The stock was unable to break this level and in fact broke down entirely in July, 2007, when the stock dipped below $13. More recently, the stock appears to have found some new level of support in the $6.00 range and may well be poised to move higher. However, I would need to see the stock trading nort of $12.50 to find some encouragement of that idea.
Summary:
I wrote this stock up back in 2003 well before the financials melt-down. With the negative trend in earnings, the negative free cash flow, and the dismal price chart,
DEARBORN BANCORP (DEAR) IS RATED A SELL
I am probably late at this rating, but I have to call it as I see it. Anyhow,
Thanks so much again for visiting my blog! If you have any comments or questions, please feel free to leave them on the website or email me at bobsadviceforstocks@lycos.com. If you get a chance, be sure and visit my Covestor Page where my Trading Portfolio is reviewed and analyzed, my SocialPicks Page where all of my stock picks from the past couple of years are reviewed, and my Podcast Page where, if you are still up for it, you can download a radio show or two of mine discussing some of the many stocks I write about here on the website.
Wishing you all a wonderful Sunday and a good week to come!
Yours in investing,
Bob
ResMed (RMD) "Weekend Trading Portfolio Analysis"

Hello Friends! Thanks so much for stopping by and visiting my blog, Stock Picks Bob's Advice! As always, please remember that I am an amateur investor, so please remember to consult with your professional investment advisers prior to making any investment decisions based on information on this website.
With the market correction ongoing, my portfolio has been reduced in size (as it is supposed to!) down to seven positions. As is my practice, I have been trying to share with you my performance on the actual stocks that I own in addition to the many stocks I write about on this blog.
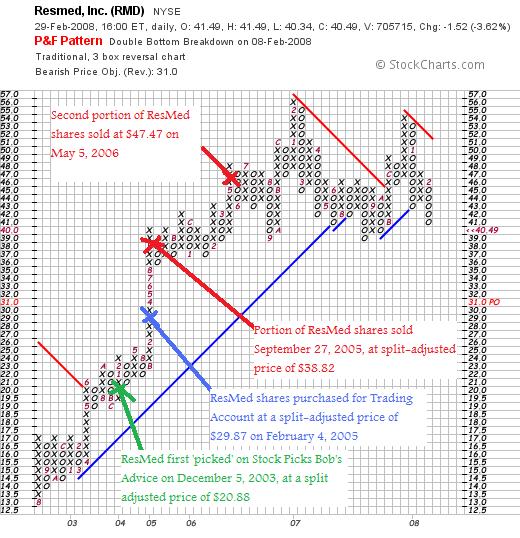
 My last review was Morningstar (MORN), a holding that I discussed on January 19, 2008. Going alphabetically (by symbol) I am up to my ResMed position. I currently own 150 shares of ResMed (RMD) that were acquired on 2/4/05 at a cost basis of $29.87. ResMed closed at $40.49 on 2/29/08 for an unrealized gain of $10.62 or 35.5% on these shares.
ResMed is an old favorite of mine, having first reviewed the stock (before owning the shares) back on December 5, 2003, when the stock was trading at $41.76. Adjusted for the 2:1 stock split on October 3, 2005, this works out to a pick price of $20.88. The stock has actually appreciated $19.61 or 94% since that original posting.
As is my practice, I have sold portions of my ResMed position twice as they hit appreciation targets of 30% and 60% over the purchase price. I sold shares 9/27/05 at a split-adjusted price of $38.82, representing a gain of $8.95 or 30.0%, and another batch of shares at $47.47 on 5/5/06, representing a gain of $17.60 or 59.0% since purchase.
When would I sell shares next?
Well, on the downside it has been my policy to sell shares if they retrace back to 1/2 of the highest percentage at which I have sold shares (if I have sold more than once). In this case, with the highest % sale at the 60% appreciation level, I plan on selling all of my shares should ResMed trace back to the 30% appreciation level (which it has been flirting with several times already). This would work out to 1.3 x $29.87 = $38.83.
On the other hand, if the stock should move higher, the next targeted sale in my 'system' is at the 90% appreciation level at which time I would plan on selling 1/7th of my remaining shares. This works out to 150 x 1/7 = 21 shares, which would be sold should the stock reach 1.9 x $29.87 = $56.75.
Unfortunately, the stock is far closer to the sale on the downside rather than the sale on appreciation. Time will tell.
Let's take a closer look at this company and decide how we should rate this stock for the blog!
First of all,
What exactly does this company do?
 According to the Yahoo "Profile" on ResMed, the company
"...engages in the design, manufacture, and marketing of equipment for the diagnosis and treatment of -disordered breathing, including obstructive sleep apnea, and other respiratory disorders that occur during sleep. It offers airflow generators, diagnostic products, mask systems, headgear, and other accessories, including humidifiers, cold passover humidifiers, carry bags, and breathing circuits."
How did they do in the latest quarter?
On February 8, 2008, ResMed (RMD) reported 2nd quarter 2008 results. For the quarter ended December 31, 2007, revenue increased 14% to $202.7 million from $178.4 million a year earlier. This exceeded estimates of $183.8 million.
Earnings dipped to $26.9 million or $.34/share this year compared to last year's $29 million or $.37/share. However, removing one-time stock-based compensation costs and restructuring charges and other one-time items, profit came in at $32.1 million or $.41/share, down from $33.7 million last year. However, the $.41/share figure exceeded estimates of $.35/share according to analysts polled by Thomson Financial.
How about longer-term results?
Reviewing the Morningstar.com "5-Yr Restated" financials page, we can see a little bit of a mix of results. Revenue growth has been particularly stable with $274 million in 2003 increasing to $716 million in 2007 and $763 million in the trailing twelve months (TTM). Earnings had a steady growth record from 2003 to 2006 when they increased from $.67/share in 2003 to $1.16/share in 2006. Earnings however dipped to $.85/share in 2007 and $.81/share in the TTM. These results of course exclude 'one-time' events. But they should be respected.
Free cash flow has improved after dipping from $31 million in 2005 to a negative $(4) million in 2006, improving to $14 million in 2007 and $22 million in the TTM.
The balance sheet is solid with $279.0 million in cash and $411.0 million in other current assets. This total of $690 million, when compared to the $162.7 million in current liabilities yields a current ratio of 4.24. (I use a level of 1.25 on the current ratio as a minimum to consider the balance sheet 'healthy'.) RMD has a relatively small level of long-term liabilities at $142.0 million.
What about some valuation numbers?
Examining the Yahoo "Key Statistics" on ResMed (RMD), we can see that this is a mid cap stock with a market capitalization of $3.15 billion. The trailing p/e is rather rich at 50.24, the forward p/e (fye 30-Jun-09) is estimated at 21.77 and with the rapid growth in earnings expected, the PEG ratio works out to an acceptable level of 1.46.
Utilizing the Fidelity.com eresearch website, we find that the Price/Sales (TTM) is reasonably priced at less than its peers at 4.12, compared to an industry average of 4.91. The company is not as profitable as its peers per Fidelity with a Return on Equity (TTM) of 6.66% compared to the industry average of 20.68%.
Finishing up with Yahoo, we find that there are 77.68 million shares outstanding with 75.14 million that float. As of 1/10/08, there were 5.85 million shares out short, well above my 3 day rule of significance, with the short ratio working out to 8.1 days of trading volume. No dividends are paid and the last stock split was a 2:1 paid on October 3, 2005.
What does the chart look like?
Reviewing the 'point & figure' chart on ResMed from StockCharts.com, we can see the strong price appreciation from August, 2002, when the stock was trading at $13.00/share, to a peak of $56 in February, 2007. The stock broke through support on the downside in August, 2007, when it dipped below $42. The stock has been struggling technically (from my amateur perspective) and once again broke through support at $42 this month. Short-term, the chart looks weak without showing a complete break-down in support.
Summary: What do I think?
I really am very biased about this stock. I think there are loads of people out there with sleep apnea and Resmed has a great product and great future. THAT is my 'Peter Lynch' portion of this stock pick.
I have some concerns about the latest quarter with all sorts of one-time charges needing to be sorted out to get to a result that still shows a decline year-over-year. And this has been going on for at least a year as the Morningstar.com report suggests. Furthermore, valuation is a bit rich with a p/e over 50 (although I can live with the PEG). The Price/Sales suggests a reasonable valuation, but the Return on Equity suggests that profitability might be lagging. The rest of the Morningstar report is solid. However, the chart also gives me pause. What this company really needs is a blow-out quarter!
Anyhow, even though I own shares, the best I can come up with is...
RESMED (RMD) IS RATED A HOLD
Thanks again for stopping by and visiting my blog! If you have any comments or questions, please feel free to leave them right on the website or email me at bobsadviceforstocks@lycos.com. If you get a chance, be sure and stop by my Covestor Page where you can see how my Trading Portfolio is doing relative to the S&P and other investors, my SocialPicks page where my stock picks from the last year or two are reviewed and analyzed, and my Podcast Page where you can download a show or two about some of the many stocks I write about here on the website!
Wishing you a happy weekend and a successful week ahead trading!
Yours in investing,
Bob
Posted by bobsadviceforstocks at 8:43 PM CST
|
Post Comment |
Permalink
Updated: Saturday, 1 March 2008 8:45 PM CST
"Looking Back One Year" A review of stock picks from the week of August 14, 2006
Hello Friends! Thanks so much for stopping by and visiting my blog, Stock Picks Bob's Advice! As always, please remember that I am an amateur investor, so please remember to consult with your professional investment advisers prior to making any investment decisions based on information on this website.
It is Saturday and it is time for a review of this blog. As I like to do on weekends, I have been going back about a year and examining a week of stock picks to see how they all would have turned out had I purchased shares in all of them. This review assumes a 'buy and hold' approach to investing. I actually write about and personally employ a disciplined investment management system which requires me to sell my holdings if they do poorly, and to sell portions of my best-performing holdings as they appreciate. The difference in strategies would certainly affect performance.
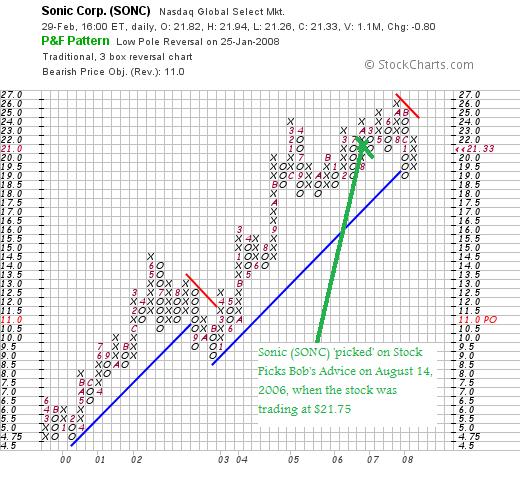
 Last week I took a look at picks from the week of August 7, 2006. Going a week ahead, let's examine the selections from the week of August 14, 2006. Fortunately for this reviewer there was only one stock 'picked' that week, Sonic Corporation (SONC) which was reviewed on August 14, 2006. Sonic was trading at $21.75 when I wrote up the stock on August 14, 2006. SONC closed at $21.33 on February 29, 2008, for a loss of $(.42) or (1.9)% since posting. I do not own any shares nor do I have any options on this stock.
This was the only stock discussed that week so I had a performance of (1.9)% on the stock that week.
Let's take another look at Sonic (SONC) and I will explain why
SONIC (SONC) IS RATED A SELL
What exactly does Sonic (SONC) do?
 According to the Yahoo "Profile" on Sonic, the company
"...operates and franchises a chain of quick-service drive-in restaurants in the United States. As of August 31, 2007, the company operated 3,343 Sonic Drive-Ins, including 654 partner drive-ins and 2,689 franchise drive-ins."
How did they do in the latest quarter?
On January 3, 2008, Sonic reported 1st quarter 2008 results. For the quarter ended November 30, 2007, revenues climbed 9% to $190.2 million from $174.8 million the prior year. Same-store sales increased 2.1% during the quarter. Net income decreased to $13.6 million from $15.3 million the prior year. However, due to fewer shares outstanding (63 million in 2007 vs. 79 million in 2006), the diluted earnings per share actually increased to $.22/share from $.19/share last year.
As the company explained in the announcement:
"The company's higher earnings per share also reflected the positive impact of Sonic's capital management program, under which the company has repurchased more than 30% of its outstanding stock since the beginning of fiscal 2007, with total expenditures of approximately $590 million. The reduced shares outstanding helped offset, on a per share basis, higher net interest expense related to the company's tender offer completed in October 2006 along with subsequent open-market purchases. With the higher interest expense, however, net income for the first quarter of fiscal 2008 declined 11% to $13.6 million versus $15.3 million in the year-earlier quarter."
The company did beat expectations on earnings which were estimated to come in at $.21/share however, they missed on revenue which was expected to come in at $191.5 million (Sonic came in at $190.2 million) according to analysts polled by Thomson Financial.
How about longer-term results?
Reviewing the Morningstar.com "5-Yr Restated" financials on Sonic, we have really quite a 'mixed bag' of results. Revenue growth remains fairly solid with an increase from $447 million in 2003 to $770 million in 2007 and $786 million in the trailing twelve months (TTM). Earnings have also been improving nicely from $.52/share in 2003 to $.91/share in 2007 and $.94/share in the TTM. This has been driven by a concerted effort by management to retire outstanding shares as noted in the above comments and by the observation that after peaking at 89 million shares in 2004, outstanding shares dropped to 88 million in 2005, 77 million in 2006 and 64 million in 2007.
However, examination of the Net Income figure shows a nice increase between 2003 and 2006 when this figure increased from $48 million in 2003 to $79 million in 2006. However, the income/share figure hides the fact that net income actually dropped between 2006 and 2007 from $79 million to $64 million. In addition, things are still problematic as the trailing twelve months net income figure is even lower at $62 million.
Free cash flow has dropped steadily from 2005 when it came in at $42 million and has declined steadily to $6 million in the TTM.
The balance sheet is also a bit 'iffy' with $29 million in cash and $41 million in other current assets. This total of $70 million is inadequate to cover the current liabilities of $96.4 million. In fact, this yields a current ratio of .73. As you may know, I like to see a current ratio of at least 1.25 before suggesting the balance sheet is 'healthy.' To top it all off, the company has $770.5 million of long-term debt on the books resulting in shareholders' equity of $(102) million.
What about some valuation numbers?
Referring to Yahoo "Key Statistics" on Sonic, we can see that this stock is a mid cap stock with a market capitalization of $1.30 billion. The trailing p/e is a very reasonable 22.69 with a forward p/e (fye 31-Aug-09) estimated at 16.16 yielding a nice PEG ratio of only 1.09.
Examining the Price/Sales (TTM) ratio on the Fidelity.com eresearch website, we find that the stock is a good value by this ratio as well with a Price/Sales ratio of 1.72 well under the industry average of 3.29. The company is less profitable than its peers with a Return on Equity (TTM) of (84.53)% compared to 18.74% according to Fidelity. I assume this negative figure derives from the negative shareholders' equity as noted in the above statistics from Yahoo.
Finishing up with Yahoo, there are 60.81 million shares outstanding with 57.31 million that float. As of 1/28/08 there were 9.11 million shares out short representing 5.9 trading days of volume. This is above the 3 day rule and is generally 'bullish' from my perspective. No dividends are paid and the last stock split was a 3:2 split May 1, 2006.
What does the chart look like?
Taking a look at the 'point & figure' chart on Sonic from StockCharts.com, we see a fairly strong chart with the stock price climbing from the $4.75 level back in February, 1999, to a peak of $26 in October, 2007. Currently the stock is under a little pressure haveing dipped below the 'support line' but with the latest bullish move, the stock doesn't really appear to have broken down technically.
Summary: What do I think?
Reviewing the information I just presented, this is certainly a mixed-picture of results. Looking first at the latest quarter we do find some good things including the fact that same-store sales results were positive, and that earnings beat expectations. However, I am concerned that revenue missed on expectations and actually while earnings per share improved, the overall net income actually decreased as the company used a large amount of resources to buy back shares and decrease the float.
Longer-term, we have the same problem. The company is expending resources to buy back shares while the bottom line appears to be suffering. The decreased shares presents an appearance of a healthy company with increasing earnings per share but at a big cost to shareholders who are seeing increasing levels of debt, a negative shareholders' equity, and declining free cash flow. With a current ratio of less than 1.0, I am not sure the short-term management is dealing appropriately with the balance sheet.
O.K. I am an amateur, but after looking at so many different companies I am disturbed by this trend.
On a positive note, valuation is reasonable in regards to p/e ratios, PEG, and Price/Sales, but we have the unusual finding of a negative 'return on equity' which I assume is related to the negative shareholders' equity.
With a clean-up of the balance sheet and a reduced emphasis on buying back shares and instead investing in the company itself, I might feel a little more comfortable owning shares of this stock. Anyhow, that's my amateur take on this company.
If you have any comments or questions, please feel free to leave them on the blog or email me at bobsadviceforstocks@lycos.com. If you get a chance, be sure and visit my Covestor Page where you can see how my actual Trading Portfolio is performing, my SocialPicks Page where my many past stock picks from the past year or so are reviewed, and my Podcast Page where you can download an amateur radio show of mine as I discuss some of the many stocks I write up here on the blog.
Wishing all of you a pleasant weekend and a great week ahead!
Yours in investing,
Bob
Newer | Latest | Older


