Stock Picks Bob's Advice
Friday, 30 September 2005
"Trading Transparency" Sybron Dental (SYD)
Hello Friends! Thanks so much for stopping by and visiting my blog,
Stock Picks Bob's Advice. As always, please remember that I am an amateur investor, so please remember to consult with your professional investment advisors prior to making any investment decisions based on information on this website.
A few moments ago, I realized that my Sybron Dental shares (SYD) hit a sale "target price." Before selling 37 shares, I had 150 shares remaining in my SYD position, and I sold 37 a few moments ago at $41.57. These shares were purchased 11/18/03, at a cost basis of $25.84/share, so I had a gain of $15.73/share or 60.9% gain. This was my second sale of shares of SYD. I had originally purchased 200 shares and sold 50 shares 1/16/04 at $31.31 which represented a gain of $5.47/share on those shares or a gain of actually only 21.2% (thus, I pulled the plug on those shares a bit early...normally selling at 30% gain level.)
Anyhow, since I am at 25 positions in my actual trading portfolio, I shall be sitting on my hands, not adding any new positions, and continuing to work at paying down my sizeable, but fortunately shrinking, margin level!
If you have any questions or comments, please feel free to leave them on the blog or email me at bobsadviceforstocks@lycos.com.
Bob
Thursday, 29 September 2005
"Revisiting a Stock Pick" Cantel Medical (CMN)
Hello Friends! Thanks so much for stopping by and visiting my blog,
Stock Picks Bob's Advice. As always, please remember that I am an amateur investor, so please remember to consult with your professional investment advisors prior to making any investment decisions based on information on this website.

Looking through the list of
top % gainers on the NYSE today, I came across an old "favorite" of mine, Cantel Medical (CMN) which I have owned in the past, but no longer have any shares or options, and have also
posted this stock previously on Stock Picks (3/2/04). Cantel is having a nice day today, trading, as I write, at $22.37, up $2.61 or 13.21% on the day.
When I posted Cantel on this blog on 3/2/04, the stock was trading at $18.40. Since the stock underwent a 3:2 stock split on 1/13/05, the effective pick price for the blog was actually $12.27, so we actually have an appreciation in stock price of $10.10 or 82.3% on this stock pick since originally listing it early last year! I purchased shares of CMN in 6/04, and
sold my remaining shares on 6/05 after the stock pulled back to a selling position. (retracing 50% of the greatest percentage gain that I had 'experienced'.)
According to the
Yahoo "Profile" on CMN, the company "...through its wholly owned subsidiaries, provides infection prevention and control products, and technical maintenance services internationally. The company designs, develops, markets, and distributes disinfection and sterilization reprocessing systems, sterilants, and other supplies. The company also markets and distributes medical equipment, scientific instruments, and industrial equipment."

What drove the stock higher today, was the release of earnings. Cantel
reported 4th quarter 2005 results just prior to the opening of trading this morning. For the quarter ended July 31, 2005, sales came in at $52.0 million, a 15% increase over sales of $45.2 million the prior year same period. Net income came ina $4.7 million, up 48% from net income of $3.2 million last year. On a diluted per share basis this worked out to $.29/diluted share, up 45% from $.20/diluted share last year. All-in-all a solid report, and the street responded accordingly!
How about longer-term? What does the Morningstar.com report look like? Well, looking at the
Morningstar.com "5-Yr Restated" financials, we can see a beautiful progression of revenue growth from $41.3 million in 2000 to $190.6 million in the trailing twelve months (TTM). During this period, earnings have grown steadily from $.28/share in 2000 to $.88/share in the TTM.
Free cash flow has
also been steadily increasing from $10 million in 2002 to $20 million in the TTM.
The balance sheet is solid with $24.7 million in cash and $59.5 million in other current assets, as opposed to the $28.5 million in current liabilities and the $25.4 million in long-term liabilities.
Looking at
Yahoo "Key Statistics" for some valuation numbers, we find that the company is a small cap stock with a market capitalization of only $331.86 million.
The trailing p/e is moderate at 25.49 and the forward p/e (fye 31-Jul 06) is nicer at 20.35. The PEG is a bit over 1.0 at 1.16 so valuation isn't bad.
Using
Fidelity.com eresearch, we can see that Cantel is downright cheap in the industrial group of "Medical Instruments/Supplies". Leading this group in price/sales ratio is Alcon (ACL) at 9.6, Guidant (GDT) at 6.1, Stryker (SYK) at 4.4, Boston Scientific (BSX) at 3.1, and Baxter (BAX) at 2.5. Cantel 'brings up the rear' at a price/sales ratio of only 1.7.
Looking back at Yahoo, we find that there are only 14.96 million shares outstanding. Currently (7/12/05) there are 684,970 shares out short representing 5.80% of the float or 3 trading days. This doesn't look too significant to me.
There are no cash dividends, and as I mentioned above, the company last split 3:2 on 1/13/05.
What about the chart? Taking a look at the
"Point & Figure" chart on CMN from Stockcharts.com:
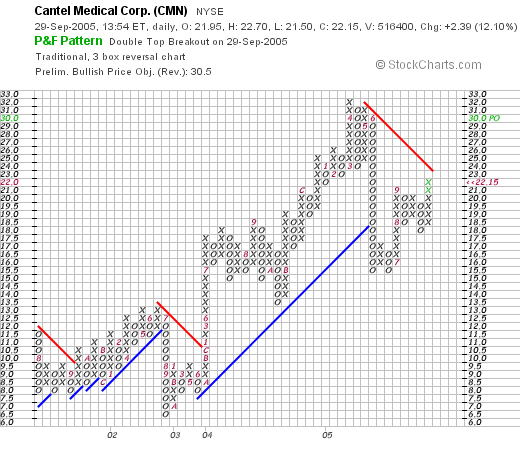
We can see that the stock has had a bit of a volatile move higher. The stock broke down once in June, 2002, when it dropped from $13 down to $6.50, and then resumed climbing higher. I got "shaken out" of the stock in June, 2005, when the stock plummeted from $32 down to $15 level. The stock consolidated, started moving higher, and is poised to break through resistance at $23. The chart looks fine to me. Not overwhelming in strength but I am sold!
So what do I think? Well, this company appears to be back on track after a gross over-reaction to a penny miss on earnings earlier this year. The last quarterly report (issued today) was superb, the Morningstar.com analysis looks fantastic with steady revenue and earnings growth, increasing free cash flow, and a solid balance sheet. To top this off, the p/e isn't bad in the mid 20's (imho), with a PEG just over 1.0. The price/sales is also a nice indicator suggesting the stock is reasonably priced within its industrial group! Now, if I just needed a new position :). Oh well, still sitting on my hands for now!
If you have any comments, or questions, please feel free to leave them right on the blog, or email me at bobsadviceforstocks@lycos.com. Happy trading everyone!
Bob
Wednesday, 28 September 2005
September 28, 2005 Paychex (PAYX)
Hello Friends! Thanks so much for stopping by and visiting my blog,
Stock Picks Bob's Advice. As always, please remember that I am an amateur investor, so please remember to consult with your professional investment advisors prior to making any investment decisions based on information on this website.

Looking through the
list of top % gainers on the NASDAQ today, I came across Paychex (PAYX) which closed at $37.25, up $3.16 or 9.27% on the day. Even though my stock club has owned some shares of this stock, I do not personally own any shares or options on this company.
According to the
Yahoo "Profile" on PAYX, the company "...provides computerized payroll, as well as integrated human resource and employee benefits outsourcing solutions for small and medium sized businesses in the United States. It offers payroll processing; tax filing and payment; employee payment; time and attendance solutions; regulatory compliance, such as new hire reporting and garnishment processing; retirement services administration; employee benefits administration; workers' compensation insurance; and human resource administrative services."
On September 27, 2005, (after the close of trading yesterday), Paychex
announced 1st quarter 2006 results. Total revenue for the quarter ended August 31, 2005, came in at $403.7 million, a 17% increase over the $345.0 million reported in the same period last year. Net income came in at $115.0 million for the quarter or $.30/diluted share, a 31% increase over net income of $87.7 million or $.23/diluted share last year. In addition, the company raised revenue growth guidance for 2006 to be in the range of 13% to 15%. Overall, a
very satisfactory report!
What about a longer-term view of the company? Looking at a
"5-Yr Restated" financials from Morningstar.com, we can see a steady picture of revenue growth from $.9 billion in 2001 to $1.4 billion in 2005. Earnings have also steadily grown from $.68/share in 2001 to $.97 in 2005. The company also pays a dividend has raised it each and every years since at least 2001 when it was $.33/share, increasing to $.51/share in 2005.
Free cash flow has been positive and growin from $313 million in 2003 to $397 million in 2005.
In addition, the balance sheet looks solid with $707.6 million in cash and $3.0 billion in other current assets, as balanced against a sizeable $2.9 billion in current liabilites and only $51.6 million in long-term liabilities. Overall, current assets favor liabilities, but it isn't an overwhelming ratio.
Taking a look at
Yahoo "Key Statistics" on PAYX, we find that the market cap is a large cap $14.11 billion. The trailing p/e is rich at 38.36 with a forward p/e just a bit better at 28.01. Demonstrating the rich valuation, we find PAYX with a PEG of 1.71.
Looking at
Fidelity.com "eresearch", we find that Paychex is in the "Staffin/Oustsourcing Svcs" Industrial Group. Also, by this parameter, Paychex is priced rather richly. The company leads this group in valuation with a price/sales ratio of 9.0, this is followed by Robert Half (RHI) at 2.0, Gevith HR (GVHR) at 1.1, Administaff (ASF) at 0.9, and Manpower (MAN) at 0.2.
Other key statistics on Yahoo document the 378.71 million shares outstanding. As of 8/10/05, there were 8.72 million shares out short representing 2.6% of the float or 5 trading days of volume. Using my arbitrary 3 day rule, this level of short interest does look significant and may be driving the stock higher (?).
As noted previously, the company does pay a small dividend currently at $.52/share yielding 1.5%. The last stock split reported on Yahoo was a 3:2 split on May 23, 2000.
What about a chart? Looking at a
Paychex "Point & Figure" chart:
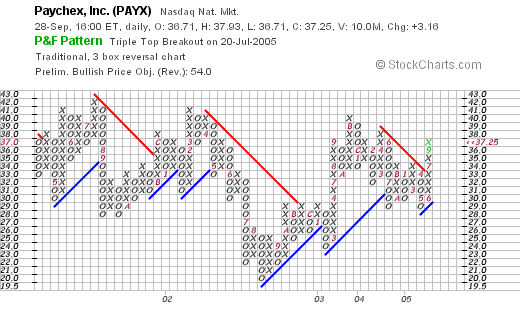
The chart is rather unimpressive with basically a sideways move in the stock price from April, 2001, to the current level at $37.25. The stock certainly does not look overextended and the recent price action above the support line also looks promising as the stock broke through resistance at the $32 level.
What do I think? I actually like the stock. The earnings have been solid, the Morningstar information is impressive with steady reven, earnings, and free cash flow, and the balance sheet looks nice.
On the downside, the valuation is rich with a p/e in the 30's and the forward p/e only in the 20's with a PEG over 1.5. And a price/sales ratio that is way ahead of its peers in the same industrial group.
Anyhow, thanks so much for stopping by! If you have any questions or comments, please feel free to email me at bobsadviceforstocks@lycos.com or leave them right here on the blog!
Bob
A Reader Writes "I wanted to get your opinion on it (JDSU)"

Hello Friends! Thanks so much for stopping by and visiting my blog,
Stock Picks Bob's Advice. As always, please remember that I am an amateur investor, so please remember to consult with your professional investment advisors prior to making any investment decisions based on information on this website.
Checking the mail yesterday, I was pleased to see a letter from Matt P. who wrote:
Hey, I'm considering a JDSU play. I've been looking for a low priced
growth stock and I'm about to pull the trigger on this one. They're
going to do a reverse split of 1:8 or 1:10 in the next few months.
Jim Cramer raved about it yesterday on his radio show, and it made
quite a bit of sense. I wanted to get your opinion on it.
Thanks,
Matt
First of all, I am not really qualified to tell you whether or not JDSU is a good investment for you. I truly
am an amateur investor. On top of this, I would not argue with Jim Cramer, who is bright and well-informed about stocks, on a pick he has made.
All I can tell you is whether a stock more or less "fits" into what I use to pick stocks. That doesn't mean it won't climb higher and it doesn't mean that I am always correct. This is just my idiosyncratic method of looking at stocks. It appears to be working for me, so I shall be keeping it for the time being!
But let's take a look at JDSU. By the way, I don't own any shares of JDSU, but several years ago, I was a shareholder of SDL which was later acquired by JDSU and for a period of time
did own some of this stock. The things I like to review when picking stocks include the latest price move, the latest quarterly report, the Morningstar.com financials and a "point & figure" chart from Stockcharts.com. Please bear with me as I go through this review. Please remember, this is just an assessment on how this stock either "fits" or not in my scheme of things :).
First of all, JDSU closed at $2.13 today, down $.05 or 2.29% on the day. In general, I have taken to avoiding stocks under $10. Simply too volatile for my approach, and generally of 'lower quality'.
Latest quarter? On September 1, 2005, JDSU
reported 4th quarter 2005 results. Net revenues came in at $170.9 million, compared with revenues of $166.3 million the prior year. Growing revenue passes the test for that part of the report.
What about earnings? The company is
losing money, in fact the net loss was $(145.7) million compared with a net loss of $(21.7) million last year, or $(.10)/diluted share this quarter this year, vs. a loss of $(.02)/share in the same quarter the year earlier. Not only does the company pass my requirement that they be profitable, showing earnings and not losses, but the losses are mounting.
Again, this doesn't mean that Jim Cramer is wrong. It simply means that it doesn't fit into the subset of stocks that fulfill my own particular criteria!
What about Morningstar.com? Looking at the
"5-Yr Restated" financials on Morningstar.com, we can see the following: revenue peaked in 2001 at $3.2 billion, and has been falling each and every year since, except for a slight pick-up in revenue from $636 million in 2004 to $716 million in the trailing twelve months (TTM).
Since 2001, the company has lost money each and every year. It appears that losses have generally been shrinking which is a plus, but I am looking for
profits and not losses!
Free cash flow? Again, this company is
burning up its free cash flow with $(47) million in 2002, and $(179) million in the trailing twelve months. Again, not exactly what I am looking for in a stock!
Balance sheet? Fortunately, this company is LOADED with cash, with $1.38 billion in cash and $306.7 million in other current assets. This is compared with $269.4 million in current liabilities and $474.7 million in long-term liabilities per Morningstar.
How about a chart? Looking at a
JDSU "Point & Figure" chart from Stockcharts.com:
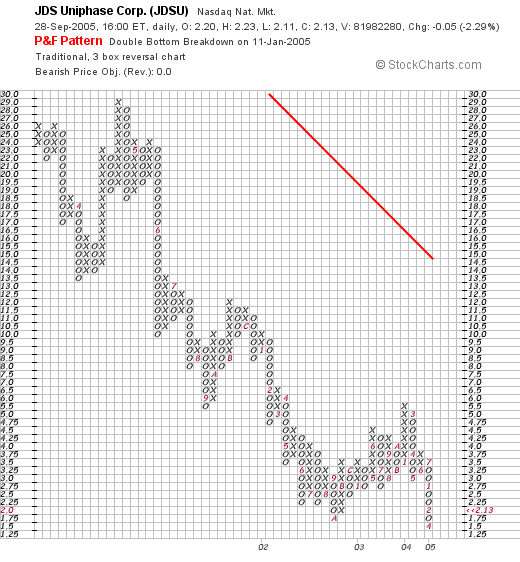
I see what appears to be no let-up of an awful chart! The company has declined from the $28 level in March, 2001, to the current $2.00 level. All of the time trading below the red resistance line.
So what do I think? Well Cramer may be brilliant, I just try to be successful. He is speculating that the price level is way overdone and the stock is a fabulous buy. He may be right. And you might make a load of money by buying the stock in here.
But let me tell you what I don't like about JDSU. I want a stock of a company that is profitable, that is first growing both the revenue (JDSU does), and earnings (JDSU isn't), with a steady 5 year revenue growth (not JDSU), growth in profits (JDSU is reducing losses), positive free cash flow (JDSU is burning up its cash), and a nice balance sheet (JDSU has a solid balance sheet).
Furthermore, I am not a technician, but I like to see a graph that is generally appreciating in price before jumping in. JDSU is continuing to decline on the chart I examined. Simply put, JDSU might be the greatest investment since sliced bread right in here at this price. But it is far too speculative for my style of investing. Give me the steady and profitable gainer any day!
I hope that this discussion was helpful. Cramer might turn out to be brilliant on this stock. Hit himself a home run right out in the bleachers. As for me, I will take my "base hits" any day. Just how I like to invest!
Thanks so much for stopping by and participating on the blog. If you or any other reader has questions or comments, please feel free to leave them on the blog or email me at bobsadviceforstocks@lycos.com.
By the way, here is an Ida Kohlmeyer painting to enjoy. She was one of New Orleans most famous artists and is a favorite of mine!
Bob
Tuesday, 27 September 2005
"Trading Transparency" ResMed (RMD)
Hello Friends! Thanks so much for stopping by and visiting my blog,
Stock Picks Bob's Advice. As always please remember that I am an amateur investor, so please remember to consult with your professional investment advisors prior to making any investment decisions based on information on this website.
A few moments ago, I sold 30 shares of ResMed (RMD) in my actual trading portfolio at $78.01/share. This was a 1/4 position of my previously held 120 shares. I like to sell a 1/4 position at previously set targets, which for me are at 30, 60, 90 and 120% gains, and then 180, 240...etc.
I had purchased these shares 2/4/05 with a cost basis of $59.74/share, so this was a $18.27/share gain or a 30.6% appreciation from my purchase price.
Since I am at my goal of 25 positions, I shall be using the proceeds to continue to try to pay down my significant margin level. If I were under 25 positions, this would be a signal to add a new position to the portfolio.
Thanks so much for stopping by! If you have any comments or questions, please feel free to leave them on the blog or email me at bobsadviceforstocks@lycos.com. I cannot get to every letter but I shall try to answer as many as I can....usually in the blog! Have a great day!
Bob
Monday, 26 September 2005
September 26, 2005 Rocky Mountain Chocolate Factory (RMCF)
Hello Friends! Thanks so much for stopping by and visiting my blog,
Stock Picks Bob's Advice. As always, please remember that I am an amateur investor, so please remember to consult with your professional investment advisors prior to making any investment decisions based on information on this website.

I was looking through the
list of top % gainers on the NASDAQ today and came across Rocky Mountain Chocolate Factory (RMCF) which is trading at $15.34, up $1.57 or 11.38% on the day, as I write. I do not own any shares nor do I have any options in this company.
According to the
Yahoo "Profile" on RMCF, this company "...engages in the manufacture of confectionery products, as well as in the operation and franchising of confectionery stores in the United States, Canada, Guam, and the United Arab Emirates. It offers approximately 300 chocolate candies and other confectionery products, including clusters, caramels, creams, mints, and truffles."
On July 12, 2005, Rocky Mountain Chocolate Factory
reported 1st quarter 2006 results. For the quarter ended May 31, 2005, revenues increased 13% to $5.4 million from $4.7 million in the same quarter last year. Just as important, the "same-store sales" at franchised retail outlets climbed 4.1%. Net earnings for the first quarter increased 27% to $753,000 compared with $592,000 in the prior year same period. Fully diluted earnings per share increased 22% to $.11 compared with $.09 last year.
Looking longer term at the
"5-Yr Restated" financials on Morningstar.com, we can see a nice picture of revenue growth except for a dip from $22.6 million in 2001 to $19.4 million in 2002. Otherwise, since then, revenue has grown steadily to the $25.2 million level in the trailing twelve months (TTM).

Earnings have also been a bit erratic, dropping from $.33/share in 2002 to $.14/share in 2003. However, since then they also have climbed steadily to $.53 in the trailing twelve months.
Free cash flow has stayed positive with $3 million reported in 2003, and $2 million in the TTM. Looking at the balance sheet, we find that ther is $1.7 million in cash and $6.8 million in other current assets, plenty to cover both the $2.1 million in current liabilities and the $.7 million in long-term debt, three times over.
Reviewing
Yahoo "Key Statistics" on RMCF, we find that this is a small, virtually a micro cap stock with a market capitalization of only $95.21 million. The trailing p/e is moderate (imho) at 28.81, but the forward p/e (fye 28-Feb-07) is better at 19.62. No PEG is reported.
According to
Fidelity.com, Rocky Mountain Chocolate Factory is in the "Confectioners" industrial group. Within this group, the Price/Sales figure of 3.7 is no bargain. Wrigley (WWY) tops the group with a price/sales of 4.1, followed by Rocky Mountain (RMCF) at 3.7, Tootsie Roll (TR) at 3.6, Hershey (HSY) at 3.0, and M&F Worldwide (MFW) at 3.0. Imperial Sugar (IPSU) is a relative bargain with a price/sales ratio of only 0.1.
Looking at some other numbers from Yahoo, we can see that there are only 6.22 million shares outstanding with 4.95 million of them that float. Currently as of 8/10/05, there are only 121,510 shares out short (up from 67,200 the prior month) but still representing only 2.20% of the float or 1.3 trading days of volume. Not significant in my book!
The company
does pay a small dividend of $.27/share yielding 2.00%. Yahoo reports the lates stock split recently, a 4:3 split on 6/14/05.
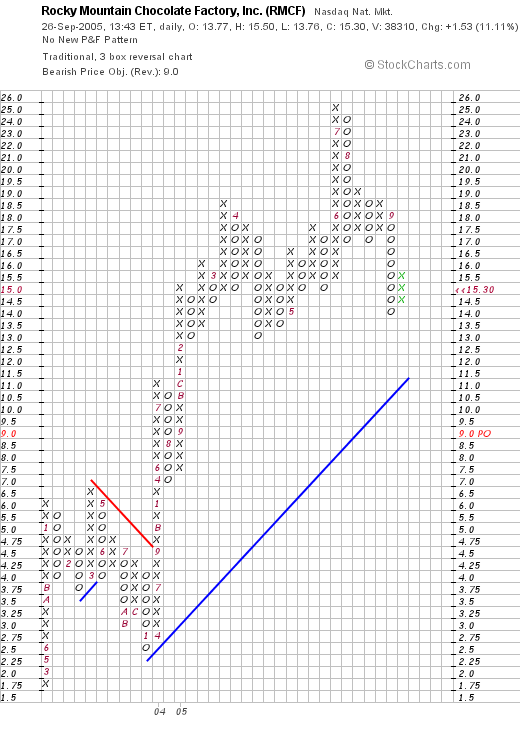
What about the chart? If we look at a
"Point & Figure" chart on RMCF from Stockcharts.com, we can see that the stock has been a fairly volatile issue but has been climbing fairly steadily from the $1.75 level in February, 2002, to the $16 level today. The stock broke through resistand at around $4.75 in September, 2005, and has moved higher since, with a pullback to the current level, still above the support line, but well below the recent price high of $25. The graph looks positive, but not over-extended:
So what do I think? Well I sure love their chocolate! But seriously, the recent earnings report is solid, the Morningstar.com looks pretty strong to me with fairly steady growth in both earnings and revenue. (I find that these tiny companies tend to have much more volatile results!) Free cash flow is positive, and the balance sheet is strong. In fact, the company even pays a cash dividend.
On the downside, valuation is a bit rich with a p/e in the high 20's, and a price/sales ahead of all but one stock in its group. However, if you wanted to get into a small company with a large potential growth, this might be the answer!
Thanks again for stopping by! If you have any comments or questions, please feel free to leave them right here on the blog or email me at bobsadviceforstocks@lycos.com.
Bob
Sunday, 25 September 2005
Some thoughts on a Sunday evening!
This is a
reproduction of a Coignard painting "Perturbation"

I wanted to share some thoughts with you this evening on investing. This is not about any particular stock but about the whole process of selecting stocks, making decisions, and reducing the tremendous stress in the process.
Needless to add, as I always like to do, I am an amateur investor, so please consult with your professional investment advisors before making any investment decisions based on information on this website!
I chose this picture tonight because I want to comment about the thinking process that goes into decisions. After many years of guessing about what stock is likely to rise and what stock may fall, and when to sell, and when to add more, I have decided that the best approach is to 'put your ear to the ground' and listen to what the market is telling you.
I have many friends who dabble in the market. They give it a great deal of thought and try to anticipate the next big move. Sometimes they are right, and I wish them well. But after years of doing the same thing, I stop "trying" to make decisions. I let the decisions come to me.
I have written before about this "Zen" approach to investing. And I believe it is a very important part of a successful investor. Avoiding the anticipation but being in touch with investment sentiment.
Some years back I read a book by Edwin Lefevre, called
Reminiscences of a Stock Operator, and I would like to share with you an excerpt on "watching the tape":
"That is how I first came to take an interest in the message of the tape. The fluctuations were from the first associated in my mind with upward or downward movements. Of course there is always a reason for fluctuations, but the tape does not concern itself with the why and wherefore. It doesn't go into explanations. I didn't ask the tape why when I was fourteen, and I don't ask it to-day, at forty. The reason for what a certain stock does to-day may not be known for two or three days, or weeks, or months. But what the dickens does that matter? Your business with the tape is now--not to-morrow. The reason can wait. But you must act instantly or be left."
What this book tells us is that studying the market entails observation. It doesn't make you less smart that I am not asking you to anticipate. I think it is enough that we learn to observe. To "read the tape" so to speak.
It is that reason why I start with the % gainers looking for the stocks on the move. I don't always know why they are moving, but I start there and try to sort through them to find the ones that have fundamentals that might warrant continued strength.
I believe it is a good approach.
That doesn't mean there aren't better ways to pick stocks. You could study market trends and be an astute technician, but I don't think that is necessary. Just being a good observer is strong medicine. After starting there, pitch in your intellect and sort through the candidates to find the stocks that are working.
In the same way, it is wise to listen to your own portfolio talking to you! When stocks begin to be sold on bad news, sit on your hands, don't re-invest, avoid compounding your losses. But as stocks do well and hit sales on good news, it is wise once again to expand your exposure to equities and add positions to your portfolio.
Just some thoughts on investing tonight that I wanted to put down on paper and share with you the reader. Listen to your fellow investors, they will tell you about the next sure thing, the investment that will rocket higher, and consider that this might not be the rational approach to investing. Instead, sit yourself down and observe, watch the market, see what stocks are moving higher, and selectively pick from among those!
Have a great week investing everyone! And to all of the victims of Rita and Katrina, and I include my own family and friends among them, my thoughts are with you.
Bob
Saturday, 24 September 2005
"Looking Back One Year" A review of stock picks from the week of July 19, 2004

Hello Friends! Thanks so much for stopping by and visiting my blog,
Stock Picks Bob's Advice. As always, please remember that I am an amateur investor, so please remember to consult with your professional investment advisors prior to making any investment decisions based on information on this website.
In order to find out if all of my stock picks even work, are profitable, and that the reasons I selected them make sense, I have been reviewing past stock picks on about a rolling one year basis. Unfortunately, some weekends my life is so busy, I do not get to the blog, and thus, my trailing 52 weeks is now extending to about 60 weeks out.
Please remember that past performance is not a guarantee of future performance! Just because a stock has done well does
not mean that it will continue to do well! Furthermore, these "picks" are not all stocks that I own. In fact, the stocks that I own are listed in my "Trading Portfolio". These are just stocks I have discussed and are potential candidates for purchase imho.
Enough of that. Let's get to the review. I have things to do today! Fortunately, the week of July 19, 2004, was rather quiet, as I "picked" only two stocks that week!

On July 19, 2004, I
posted Stryker (SYK) on Stock Picks at $47.95. SYK closed at $50.30 on 9/23/05, for a gain of $2.35 or 4.9% since being listed on the blog.

On July 19, 2005, Stryker
reported 2nd quarter 2005 results. Net sales climbed 16.8% to $1.2 billion, over prior year's $1.04 billion net sales figure. Net earnings jumped 20.7% to $184.3 million from $152.7 million last year, and diluted earnings per share climbed 21.6% to $.45/share up from $.37/share the prior year. Overall a solid picture from Stryker!

On July 20, 2004, I
posted Florida Rock Industries (FRK) on Stock Picks at $42.21. FRK had a 3:2 split July 5, 2005, making my effective pick price actually $28.14. FRK closed at $58.30 on 9/23/05, giving us a gain of $30.16 on this pick or 107.2%! (This stock probably is viewed as another Hurricane Stock Pick by investors, as there will certainly be no let-up in the demand for concrete and cement as the Gulf Coasts rebuilds!)
On July 25, 2005,
Florida Rock Industries announced 3rd quarter 2005 results. Consolidated sales grew 25% to $313.5 million from $251.6 million in the prior year same period. Net income climbed to $45.9 million from $33.1 million last year, and diluted earnings per share grew 38% to $.69 from $.50 the prior year same period. This was a solid quarter from FRK! My only regret is that I don't own any shares!
With the fabulous performance of Florida Rock and the satisfactory performance of Stryker, these two stocks had an average performance of a gain of 56.1% over this period.
Thanks so much for stopping by and visiting! If you have any questions or comments, please feel free to leave them right here on the blog or email me at bobsadviceforstocks@lycos.com. I cannot answer all of my emails, but I try to answer as many as possible with comments published right on the website.
Bob
"Weekend Trading Portfolio Analysis" Cal Dive (CDIS)

Hello Friends! Thanks so much for stopping by and visiting my blog,
Stock Picks Bob's Advice. As always, please remember that I am an amateur investor so please remember to consult with your professional investment advisors prior to making any investment decisions based on information on this website.
It is hard to believe that it is once again the weekend and time to review some past picks and positions. I was in Target the other day with one of my kids who told me "Gee they have the Halloween stuff out already, it was
just Halloween!"

This weblog is a diary of two things: stocks that I have looked at without purchasing, and my actual purchases in my trading portfolio. I have been going alphabetically through my 25 positions, and am currently up to Cal Dive (CDIS).
On November 3, 2004, I purchased 200 shares of Cal Dive (CDIS) at $38.158 and immediately
posted the trade on Stock Picks. Later that evening, I wrote up a full
review of CDIS on Stock Picks.
Cal Dive has been a good performer in my portfolio. I sold my first partial position, 50 shares representing 1/4 of my holdings, on 2/25/05 at $49.87, representing a gain of $11.71 or 30.7%. If you are familiar with my trading strategy, I sell my losers quickly at an (8)% loss, but sell my gaining stocks slowly at 30, 60, 90, 120, 180, etc. gain points.
On August 1, 2005, I sold my second 1/4 position, this time only 37 shares representing approximately 1/4 of my remaining 150 shares, at $60.84, representing a gain of $22.68 or 59.4%.
Where would I sell next? Since I have sold this stock twice, I would only let it retrace 50% of the highest gain, that is I would again be selling all remaining shares at the 30% gain on the downside, or at about a price of $49.61. On the upside, I would plan to sell 1/4 of my remaining shares or about 28 shares if an when the stock hits a price of approximately $72.50. Meanwhile, I wait patiently :). CDIS closed at $59.52 on 9/23/05, down $(.52) or (.87)% on the day.

Cal Dive (CDIS) has turned out to be a "hurricane stock pick" with both Katrina and Rita barrelling through the Gulf of Mexico making a mess of offshore oil equipment/facilities. I did
not purchase this stock because of this possibility. I used my usual technique of looking for stocks with strong daily momentum, great earnings and revenue growth, a good Morningstar evaluation consisting of steady revenue and earnings growth over the past five years, positive free cash flow, and a good balance sheet.
Let's take another look at Cal Dive! According to the
Yahoo "Profile" on CDIS, the company "...operates as an energy services company in the Gulf of Mexico, and in the North Sea and the Asia/Pacific regions. It offers a range of marine contracting services, such as marine construction, robotic services, manned diving, and decommissioning services."
On August 2, 2005, CDIS
reported 2nd quarter 2005 results. Revenue grew to $166.5 million from $127.7 million in the second quarter last year. Net income climbed to $26 million, from $18.2 million the prior year same period. On a diluted earnings per share basis, earnings came in at $.65/share, up from $.47/share in the same quarter last year.
Of some concern is the risk that this Gulf of Mexico, Houston-based company faces to its own assets with the hurricanes. On September 1, 2005, CDIS
reported on Katrina damage and noted that preliminary reports "...revealed no significant damage from Hurricane Katrina to its Marine Contracting assets and offshore production facilities." I do not see any news yet on Hurricane Rita and whether CDIS incurred any damage. However, CDIS is involved in the repair and salvage of offshore assets and should be facing significant business opportunities as the offshore oil business in the Gulf responds to the hurricanes (imho).

Reviewing the
Morningstar.com "5-Yr Restated" financials, we can see the beautiful progression in revenue from $181.0 million in 2000 to $621.1 million in the trailing twelve monts (TTM).
Earnings have grown steadily (except for a dip in 2002) from $.72 to $2.51 in the TTM.
Free cash flow turned negative in the TTM on the back of a large $244 million capital spending. Currently at $(5) million, this is a "negative" in my book, but it is reassuring to see the dynamic growth in "Operating Cash Flow". Looking at the balance sheet, we can see that the cash stands at $199.7 million, plenty to pay off all of the $157.1 million in current liabilities. In addition, CDIS has $165.7 million in "other current assets", enough to make a nice dent in the $768.5 million in long-term liabilities.
What about the chart? Taking a look at the
Cal Dive "Point & Figure Chart":
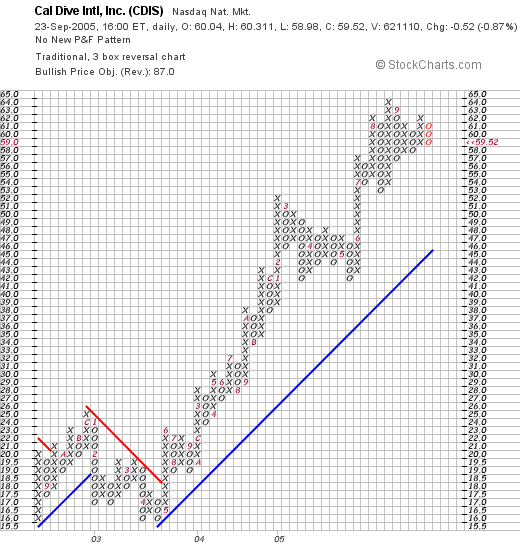
We can see what looks like a gorgeous looking chart with the stock initially trading between a range of $15.50 to $25, breaking through a resistance line at $18 in May, 2003, and trading steadily higher for the past 2 1/2 years! Looks quite strong to me!
Anyhow, that's another real stock holding for me. It doesn't mean it is better than my other stock picks that I discuss. I can tell you about lots of those other stocks that turned out better than anything I actually purchased. I just want to share with you my current holdings, which forces me to take a closer look at them as well!
Thanks so much for stopping by and visiting. I hope all of this discussion is helpful for you, I know it is good for me! If you have any questions or comments, please feel free to leave them right on the blog or email me at bobsadviceforstocks@lycos.com.
Bob
Friday, 23 September 2005
"Revisiting a Stock Pick" Thor Industries (THO)
Hello Friends! Thanks so much for stopping by and visiting my blog,
Stock Picks Bob's Advice. As always, please remember that I am an amateur investor, so please remember to consult with your professional investment advisors prior to making any investment decisions based on information on this website.

Looking through the
list of top % gainers on the NYSE this afternoon, I came across Thor Industries (THO), which closed at $33.41, up $1.58 or 4.96% on the day.

I do not own any shares of Thor (THO) nor do I own any options. In fact, I first
posted Thor on Stock Picks on February 10, 2004, when it was trading at $33.86. Thor is actually $(.45) lower than when I posted the stock for a loss of (1.3)% since posting. The stock has really gone nowhere since I first posted it a year-and-a-half ago!
According to the
Yahoo "Profile" on Thor, the company "...engages in the production and sale of recreation vehicles, and small and midsize buses in the United States and Canada. The company opoerates in three segments: Towable Recreation Vehicles, Motorized Recreation Vehicles, and Bus."
What drove the stock higher today was the
report by Thor, that the company had received orders for more than $210 million in towable recreation vehicles amounting to 13,000 vehicles, in September alone. As the report comments:
The maker of recreation vehicles and mid-size buses said many of the orders came from dealers who are selling to Hurricane Katrina evacuees.
Thor posted towable orders of $83 million in September last year, and reported total sales of $2.19 billion for 2004.
Clearly, THO and other similar RV manufacturers may end up being beneficiaries of the tragedy befalling many Americans in Texas, Louisiana, Mississippi and Alabama; Americans in desperate need for housing. Many of you have come to this website in search of a Katrina stock pick, or a Rita stock pick, or just for a hurricane stock pick. This company may well fit the bill!
On June 2, 2005, Thor Industries (THO) reported
reported 3rd quarter 2005 results.

For the third quarter ended April 30, 2005, Net Sales increased to $728.7 million, up from $645.7 million the prior year same quarter. Net income for the quarter grew 4.5% to $33.0 million, up from $32.8 million the prior year. On a diluted eps basis, earnings increased only $.01 to $.58/share up from $.57/share in the same quarter last year.
Looking at the
Morningstar.com "5-Yr Restated" financials, we can see that except for a small dip in revenue from $900 million in 2000, to $800 million in 2001, revenue has grown steadily to $2.5 billion in the trailing twelve months (TTM).
Again, except for a dip in earnings from $.74/share in 2000 to $.56/share in 2001, earnings have also been steadily growing to the $2.11 level reported in the trailing twelve months.
The company pays a small dividend which has increased from $.02/share in 2000 to $.12/share in the TTM.
Free cash flow which dipped from $126 million in 2002 to $18 million in 2003, has increased to $67 million in the TTM.

The balance sheet, as reported by Morningstar, looks strong with $127.5 million in cash and $389.8 million in other current assets. Balanced against this is the $246.9 million in current liabilities and the 'smallish' $11.0 million in long-term liabilities.
Looking at
Yahoo "Key Statistics" for THO, we find that the market cap is a mid cap sized $1.89 billion. The trailing p/e is downright reasonable at 15.84 with a forward p/e (fye 31-Jul-06) of 13.42. The PEG (5 yr expected) is 0.93.
Within the Recreational Vehicles Industrial Group, according to
Fidelity.com website, we can see that Thor is reasonably priced in terms of price/sales ratios within its industrial group.
Topping off the list of stocks ranked by price/sales, is Harley Davidson (HDI) at 2.7, then Polaris Industries (PII) at 1.1, Winnebago (WGO) at 0.9, followed by Thor (THO) at 0.7, and Monaco Coach (MNC) at 0.3.
Checking other Yahoo statistics, we can see that there are 56.61 million shares outstanding. Currently, as of 7/12/05, there were 4.88 million shares of stock out short, representing 15.4 trading days of volume. As noted above, THO does pay a small dividend of $.20/share yielding 0.60%. The last stock dividend was a 2:1 split on 1/27/04.
Looking at a
Thor "Point & Figure" chart:
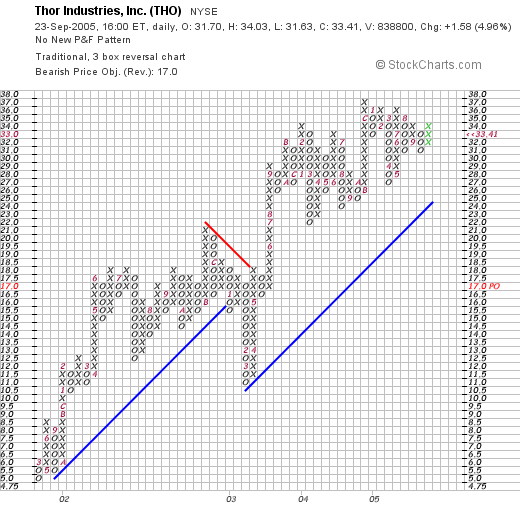
We can see what actually a fairly strong chart of a stock that climbed from $5.00/share in February, 2001, to an intermediate high at $21/share in August, 2002. The stock broke down to a new support level at $10.00, only to resume its climb to the $33.41 level.
So what do I think? Well, let's review: latest earnings was strong, the past five years have been solid performers for this stock, valuation is reasonable, free cash flow is positive and the chart looks strong.
Again, this might be a good hurricane pick with the massive damage to housing throught the four state region. Now, if I only had some available cash to buy something! In fact, I am at my 25 position goal, and shall not be buying any additional shares until I sell a stock to get back down to 24 positions, then make another purchase on the back of a partial sale of one of my holdings in my trading account at a gain.
Thanks again for stopping by! Please be sure to leave a comment right on the blog or email me at bobsadviceforstocks@lycos.com.
Bob
Newer | Latest | Older


