Stock Picks Bob's Advice
Saturday, 29 May 2004
"The Annual Review" Looking back on the week of May 26, 2003

Hello Friends! It is a RAINY Saturday here in Wisconsin. I hope you all are staying nice and dry today. This is now the third week that I have had the pleasure of looking back on selections from a YEAR ago! I think this is VERY helpful to understanding the effectiveness of this process on this blog. I don't just want to put names out in cyberspace without finding out whether they actually did ok! As always, please remember that I am an AMATEUR investor, so do your own investigation of all of these stocks, and PLEASE consult with your own professional investment advisor to make sure they are appropriate and timely for you.

On May 27, 2003, I
posted Westcorp (WES) on Bob's Advice at a price of $24.41. WES closed at $42.95 on 5/28/04 for a gain of $18.54 or 76%.
How about recent earnings? On April 13, 2004, WES
reported 1st quarter 2004 results. First quarter net income was up 84% to $43 million, with EPS gaining 38% to $.83. In addition, WES raised guidance for 2004 results. This was a very nice report!
Dearborn Bancorp (DEAR) was
selected for Stock Picks on 5/27/03 at a price of $22.50. DEAR closed on 5/28/04 at a price of $26.589 for a gain of $4.09 or 18.2%. However, I just realized they paid a 5% stock dividend in 12/03, so our return works out to 24.1% for this period.
On 4/20/04, DEAR
announced 1st quarter 2004 results. DEAR announced earnings for the quarter of $1.2 million or $.36/diluted share up 102% from the $580,000 or $.19/diluted share last year. In addition, just a few days ago, on 5/19/04, DEAR
declared a 5% stock dividend. This will not actually increase our return, but this was also declared in 12/3/03...so this is the second 5% stock dividend this year....so our actual cost on the "pick" was $21.43....and our ACTUAL return was 24.1% during this period!

On 5/28/03, I
posted Abercrombie and Fitch (ANF) on the blog at a price of $29.07. ANF closed at $36.43 on 5/28/04 for a gain for the year of $7.36 or 25.3%.
On May 11, 2004, ANF
reported 1st quarter 2004 results. Net sales for the thirteen week period ended May 1, 2004, increased 19% to $411.9 million from $346.7 million last year. On the downside of the report the same store sales figure were FLAT. This is the only part of the story that disturbs me. I really insist on same store sales gains when thinking about a retail stock for possible investment. Anyhow, earnings on a fully diluted basis DID jump 19% to $.31 vs $.26 last year....but again, with same store sales FLAT, this would suggest that the growth in revenue and earnings was by ADDING additional outlets....and not by what I would call internal growth.
May 28, 2003, found me
posting Krispy Kreme (KKD) on Stock Picks at a price of $34.35. As those of you who follow the market know, KKD has recently come under pressure due to lackluster results and possibly feeling the effect of the Atkins "low-carb craze". (I have been watching my carbs on and off like lots of ineffective dieters!). KKD closed at $21.47 on 5/28/04 for a LOSS of $(12.88) or (37.5)%.
On May 25, 2004,
KKD reported 1st quarter results. The company reported that it LOST $(24.4) million or $(.38)/share vs a profit of $38.8 million or $.61/share last year. Revenue did rise 24% to $184.4 million, with same store sales up 4%. So all was not bad in the report...but the loss (based on a write-off)...is still disturbing.
Medical Staffing Network (MRN) was
posted on Stock Picks on 5/29/03 at a price of $7.52. MRN closed at $6.59 on 5/28/04 for a loss of $(.93) or (12.4)%.
On May 5, 2004, MRN
announced 1st quarter 2004 results. Revenues came in at $106.4 million a DECREASE of 26.1% from first quarter 2003 revenues of $144.0 million. Loss came in at $(.6) million or $(.02)/share vs. net income of $5.3 million or $.17/share in the first quarter 2003. All I can say is that these results look DISMAL. (At least from my "earnings momentum" perspective).

Hovnanian Enterprises, the home-builder, was
posted on Stock Picks on 5/29/03 at a price of $56.29. HOV had a 2:1 stock split in March, 2004, givin the pick an effective price of $28.15. HOV closed 5/28/04 at a price of $35.30 for a gain of $7.15 or 25.4%.
On March 1, 2004, HOV
reported 1st quarter 2004 results. Total revenues increased 24% to $775.2 million from $627.6 million last year. Net income came in at $57.7 million or $1.74/diluted share vs $44.8 million, or $1.35/diluted share last year. These were nice results...although analysts had expected a bit more!
On May 29, 2003, I
posted Dollar General on Stock Picks Bob's Advice at a price of $17.80. DG closed at $19.40 on 5/28/04 for a gain of $1.60 or 9% over the year.
Just two days ago, on 5/27/04, DG
reported 1st quarter 2004 results. Net sales for the first quarter increased 11.4% to $1.75 billion from $1.57 billion. Just as important, same store sales during the period increased 3.0%. Net income came in at $67.8 million, a 12.5% increase over the $60.3 million last year, or $.20/diluted share this year vs. $.18/diluted share last year. These are o.k. results but not exactly spectacular, imho.
FINALLY, Eon Labs (ELAB) was
posted on Stock Picks on 5/30/03 at $29.55. ELAB closed on 5/28/04 at $75.60 (!) for a gain of $46.05 during the past year or 156%. Now the SAD part of this is that I DID own some shares but got "shaken out" on some stories I read on the internet...will have to stick tighter to these stocks in the future!
On April 22, 2004, ELAB
reported 1st quarter results. Net sales came in at $104.2 million, a 47.1% increase from the comparable quarter in 2003. Net income came in at $32.3 million, compared to $15.1 million the prior year an increase of 113.9%. And diluted earnings per share came in at $.71/share (or $.58/share excluding a one-time gain of $10 million for a payment received in litigation), compared to $.33/share last year. These are GREAT results and as you can see, the stock has responded accordingly!
So how did we do this week a year ago? Over the past year these stocks have returned an average gain of 33.2%. We had two stocks declining (KKD and MRN) with losses of (37.5)% and (12.4)% respectively, and seven stocks gaining. This was a pretty nice performance! However, as you know, past performance is NO guarantee of future performance....but maybe, just maybe we are onto something on this blog!
Thanks so much for stopping by! I hope you have a safe and happy Memorial Day Weekend! If you have any questions, comments, or words of encouragement, please feel free to email me at bobsadviceforstocks@lycos.com
Bob
Friday, 28 May 2004
May 28, 2004 Wendy's International (WEN)
Hello Friends! We made it to Friday! I sure appreciate all of you who come and visit here. If some of your are regulars, please email me at bobsadviceforstocks@lycos.com and let me know your own approach to investing and whether you find the information on this website helpful in any fashion! Also, your comments, suggestions, questions, and words of encouragement are as always very much appreciated! Please remember that I am an AMATEUR investor, so do your OWN investigation of all investments discussed on this website, and please consult with your PROFESSIONAL investment advisors to make sure investments discussed are appropriate and timely for you!
I came across Wendy's Intl (WEN) on the list of greatest gainers this morning. As I write, they are trading at $37.43, up $1.29 or 3.57% on the day. I do NOT have any shares or other leveraged positions in this stock. According to Yahoo, Wendy's is "...primarily engaged in the business of operating, developing and franchising a system of distinctive quick-service and fast-casual restaurants." They sell hamburgers, in other words, but also other items on their menu....hmmm...last time I was there they had some new interesting salads, their great chili....oh well it is getting close to lunch so let's not talk about food! My stomach is growling. We do have a couple of other restaurants on this blog including Frisch's, Red Robin Gourmet Burger, and Panera Bread to mention a few.
Earlier this month, on May 3, WEN
announced April 2004 same-store sales results. They announced that their U.S. Franchise-owned restaurant sales in the month ending May 2 were up 6.3 to 6.6%. Tim Hortons coffee and donut shuts had same-store sales up 9.0-9.2% in Canada, while those in the U.S. jumped 12.4%. These are pretty solid results!
Looking for the latest quarterly report, I found that Wendy's
reported 1st quarter 2004 results on April 22, 2004. Total revenues increased 20.3% to a record $835 million. Net income came in at $52.8 million for the quarter vs. $43.9 million last year. On a diluted earnings per share basis, this came in at $.45/share vs $.38/share last year.
Longer term, if we examine the
Morningstar.com "5-Yr Restated" financials, we can note the steady revenue growth from $2.1 billion in 1999 to the latest $3.1 billion in 2003.
Equally nice, imho, the earnings have also steadily grown from $1.32/share in 1999 to the $2.05/share level in 2003.
Free cash flow, has been positive lately, with $6 million reported in 2001, increasing to $88 million in 2003. The balance sheet, per Morningstar, looks a little light on current assets with $195.9 million in cash and $266.8 million in other current assets vs. $528.5 million in current liabilities and $876.9 million in long-term debt. This lightness in the area of current assets is a bit of a concern, but with the steady free cash flow at almost $100 million/year, this does not appear to be a significant issue for WEN in my opinion. But review the numbers yourself and see what you think!

What about valuation? If we look at the
"Key Statistics" from Yahoo, we can see that the trailing p/e on this large cap stock is only 17.76. The forward p/e (fye 28-Dec-05) is even nicer at 14.44. The PEG is reasonable at 1.18, with a price/sales almost as nice at 1.25. The valuation looks pretty reasonable to me!
Currently there are 114.08 million shares outstanding with 106.10 million of them that float. (For comparison McDonald's has 1.26 BILLION shares outstanding!) The short interest, as of 5/10/04, isn't impressive with 674,000 shares out short representing 0.64% of the float or 0.836 trading days. And this is DOWN from the prior month's 1.09 million shares out short.
The stock DOES pay a dividend of $.48/share yielding 1.33% and the last stock split reported by Yahoo was a 5:4 split in May, 1986.
If we look at a recent "Point & Figure" chart on Wendy's:
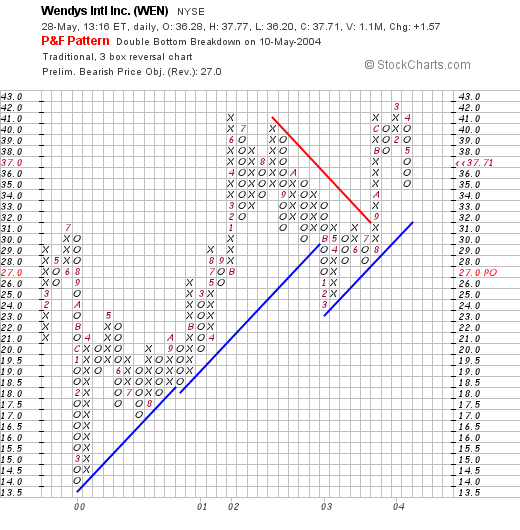
We can see that this stock has been trading fairly steadily higher since March, 2000 when it bottomed at around $14.00/share.
What do I think? Hey, I could use a nice burger right now! But seriously, personally, I am out of the market for buying stock...I am back SITTING ON MY HANDS....waiting for an opportunity to buy a NEW stock when I can sell a portion of an existing postion at a gain....but overall, I like WEN just fine! The valuation is nice. The same store sales figures are great. The balance sheet is a tad weak in the assets department, but I do not think this should be overblown...but maybe watch these figures as the Morningstar site gets updated.
Thanks so much for stopping by! As always, if you have any questions, comments, or words of encouragement, PLEASE feel free to email me at bobsadviceforstocks@lycos.com or leave your comments right here on the blog!
Have a GREAT weekend everyone!
Bob
Thursday, 27 May 2004
May 27, 2004 "Update on Trade" Gen-Probe (GPRO)
Hello Friends! As I already wrote today, I had a nickel just BURNING A HOLE IN MY POCKET....and like a kid....had to spend it. Reminds me of that old Cracker Jack Song...."What do You want when you gotta have something....and you only have a dime!"...anyone else remember that? So was scanning the lists of stocks making a nice move today and saw Gen-Probe was on the list (GPRO). I had posted this stock on Stock Picks back in September, 2003, but had never owned a share. GPRO closed today at $41.81, up $3.64 or 9.54% on the day today.

Just to refresh your memory, according to Yahoo, GPRO "...is engaged in the development and marketing of rapid, accurate and cost-effective nucleic acid probe-based products used for the clinical diagnosis of human diseases and for screening donated human blood."
Before I purchased any shares, I quickly searched out the latest earnings report...and it looked nice to me! Three weeks ago, on May 3, 2004, GPRO
reported 1st quarter 2004 results and ALSO raised guidance for the full year! Revenues for the first quarter came in at $76.5 million, a 66% increase over last year's revenues of $46.2 million. Net income came in at $19.7 million, or $.39/share, a 117% increase over the $8.7 million, or $.18/share reported the prior year. These are GREAT results in my humble opinion. In addition, my favorite part of the news, was that they RAISED estimates for the year. That is almost always bullish for a stock!
Taking a look at
Morningstar.com "5-Yr Restated" financials, we can see that revenue has been increasing steadily since 1999 and that the RATE of increase has actually been ACCELERATING. Revenue came in at $117.5 million in 1999, increasing to $207.2 million in 2003, and extrapolating the current quarter should be coming in around $300 million for 2004!
Earnings came in at $.72/share in 2003, and extrapolating the current quarter, would get us closer to $1.50 in 2004.
The free cash flow picture has been nice, increasing from $11 million in 2001, to $40 million in 2003.
The balace sheet also looks beautiful with $156.3 million in cash and $52.6 million in other current assets with $39.9 million in current liabilities and $14.5 millioin in long-term liabilities. I think you are starting to see why I like this stocks!
If we check
"Key Statistics" for GPRO on Yahoo, we can see that the stock is NOT cheap with a p/e of 45.30, however the forward p/e (fye 31-Dec-05) is better at 36.68, and the PEG is at 1.56, a little steep but not that bad. However, the Price/Sales ratio is quite rich at 7.91.
There are 49.19 million shares outstanding with 48.40 million of them that float. As of 5/10/04, there are 1.41 million shares out short representing 2.91% of the float or 1.677 trading days. By my yardstick, under 3.00 trading days isn't bad...or rather doesn't represent as much of a "squeeze" opportunity....as short sellers sometimes scramble to cover.
No cash dividend is paid and the stock last split 2:1 in October, 2003.
Taking a look at a "Point & Figure" chart for GPRO:
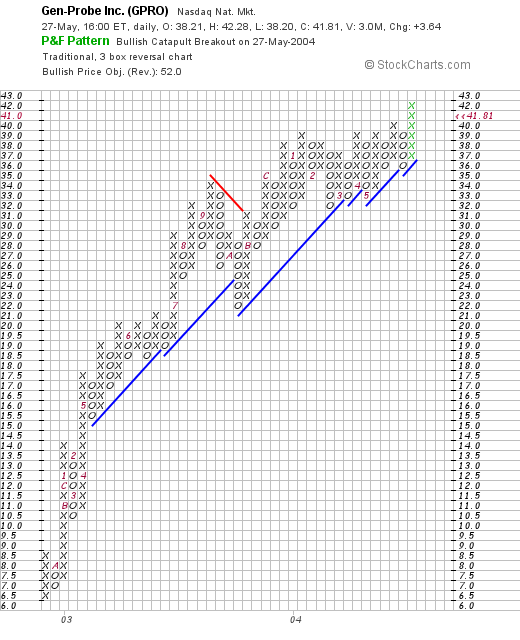
we can see that this stock has been very strong since early 2003 when it was trading at the $6.50 range and has been flying higher ever since. Is it over-extended? Hard to see when there haven't been much of any correction!
What do I think? I like this stock. In fact I like it so much that I BOUGHT this stock (No I DIDN't MARRY THIS STOCK...lol)...the latest report is terrific, the balance sheet is beautiful with wonderful free cash flow, the chart is impressive....and it just ISN'T that cheap a stock...but even so it is growing so FAST that the PEG reported at 1.50 may even be over-stated....just my opinion. I will sell if it drops to an 8% loss like everything else!
Thanks so much for stopping by! I hope this is informative for you. Please remember that I am an amateur investor and that you should do your own investigation of all investments discussed on this website and PLEASE discuss these with your professional investment advisors prior to taking any action to make sure that they are appropriate, and timely for you!
If you have any questions, comments, or words of encouragement, please feel free to email me at bobsadviceforstocks@lycos.com . I will probably reply to you directly in the blog.
p.s. There is a GREAT article on blogging in today's New York Times online. Bloggers beware...it describes this new online disease called blogger-addiction or something like that.....now just because I have over 500 entries in this blog this past year...doesn't mean I am addicted....or does it? lol.
Bob
"Trading Transparency" GPRO
Hello Friends! That nickel was BURNING A HOLE in my pocket! Oh well, I picked up 300 shares of GPRO at $41.273 a few moments ago to bring my trading portfolio up to 20 positions. Gen Probe has been an old favorite of mine although I have not owned it before now. I first posted GPRO on 9/17/03: at a pre-split adjusted price of $31.45.
This post on Stock Picks preceded a 2:1 split in October, 2003. Oh well, now I don't have any more nickels to spend! I will need to wait for another sale at a gain to add another position.
Thanks so much for stopping by! If you have any questions, comments, or words of encouragement, please feel free to email me at bobsadviceforstocks@lycos.com
Bob
Wednesday, 26 May 2004
"Trading Transparency" SAFM
Hello Friends! Was looking through my Current Trading Portfolio and realized that Sanderson Farms (SAFM) was close to a sell point for a first "gain." I went ahead and sold 60 shares of my 240 share position (25%) at $45.95/share. I acquired my 240 shares of SAFM at $35.86 on 2/3/04, about 3 1/2 months ago, and have sold them with a gain of $10.09/share or 28.1%. And you KNOW what that means...with a new sale on a gain, I will be able to ADD A POSITION...lol...boy am I EXCITED. I hate sitting on my hands with a nickel in my pocket!
Have a great evening everyone! Will check in again with you all soon!
Bob
May 26, 2004 Copart (CPRT)
Hello Friends! Thanks so much for stopping by! You would be surprised (or would you?) by how MUCH your click on the counter means to me. In fact, I would love to hear from any or all of you directly if you have any suggestions, comments, questions, or just words of encouragement regarding this blog by emailing me at bobsadviceforstocks@lycos.com . As always, please remember that I am an AMATEUR investor and that you should seek PROFESSIONAL advice prior to making any investment decisions based on information on this website. Also, please remember to do your own investigation on all stocks discussed!

Scanning through the list of greatest percentage gainers, I came across Copart (CPRT). As I write, about 30 minutes before the close, CPRT is trading at $23.02, up $3.37 or 17.15% on the day! I do NOT own any shares or options on Copart. According to Yahoo, CPRT "...is a provider of salvage vehicle auction services in the United States. It provides vehicle suppliers, primarily insurance companies, with a range of services to process and sell salvage vehicles through auctions...." Sounds almost a little like a related business to the Schnitzer Steel we discussed in an earlier entry....well, not exactly like SCHN...which is involved in junk steel...but still what do you think?
Guess what? The stock jumped today on a TERRIFIC earnings report! Now is that non surprising or what? That is the whole basis of what I write about on this blog...is that it is EARNINGS, EARNINGS, and more EARNINGS that drives the price! ANYHOW, they
reported 3rd quarter 2004 results for the quarter ended April 30, 2004. Revenues came in at $116.6 million, a 24% increase over the prior year. Net income was even better at $25.0 million, a 62% increase over the $15.4 million last year. Fully diluted earnings/share came in at $.27 or a 59% increase over the $.17/diluted share reported last year. These ARE great results! Apparently they have "stores" because "same store sales" were up 23% over the prior year's figures.
Looking at
Morningstar.com "5-Yr Restated" financials, we can see that revenue has been steadily growing from $141.8 million in 1999 to $347.4 million in 2003. Earnings growth has been a bit erratic increasing from $.27 in 1999 to $.68 in the trailing twelve months. Free cash flow has not been consistent but HAS improved from $11 million in 2001 to $31 million in the trailing twelve months.
What about the Balance Sheet? According to Morningstar, CPRT currently has $105.6 million in cash and $144.3 million in other current assets. This is balanced against $60.6 million in current liabilities and only $9.2 million in long-term liabilities. In other words, the balance sheet, in my opinion, looks GREAT!
How about "Valuation?" Looking on Yahoo for
"Key Statistics", the Market Cap is a Mid-Cap level at $2.06 billion. The trailing p/e is 34.45, with a forward p/e of 26.53 (fye 31-Jul-05). Thus the PEG is moderate at 1.26. Price/sales is a bit richer at 4.80. Yahoo reports 89.16 million shares outstanding with 70.30 million of them that float. Currently there are 1.78 million shares out short (4/7/04) representing 2.54% of the float or 3.044 trading days. This is approaching a significant short-interest level in my opinion, as the trading-days to cover passes 3.0.
No cash dividend is paid and no stock dividends are reported on Yahoo.
What about "Technicals?"
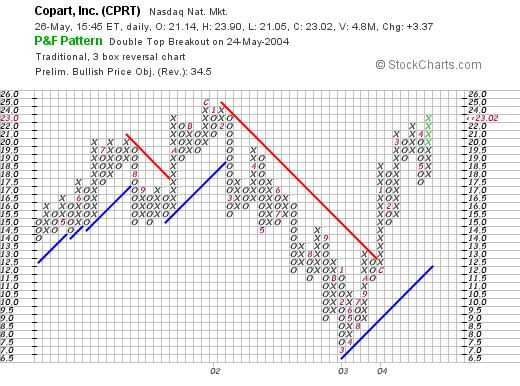
Looking at the Point & Figure chart, in my amateur view, it appears that the stock has been trading rather sideways with a recent price pullback during 2002, and a nice price improvement since March, 2003, when it bottomed at about $6.5/share. The stock broke through a resistance level at around $12 in October, 2003, and has been heading higher fairly steadily since then.
So what do I think? I do not know if the industry in auctioned vehicles is a growth business or not but CPRT has certainly been growing steadily the last five years! Valuation seems pretty reasonable with a PEG just over 1.2, and the balance sheet is beautiful with continued generation of free cash. With the beautiful latest quarterly report, this stock does appear very nice to me...now if ONLY I hd some MONEY to invest! But I shall be sitting on my hands until I can sell a portion of my holdings at a gain!
Thanks again for stopping by! If you have any questions or comments, please feel free to email me at bobsadviceforstocks@lycos.com
Bob
Tuesday, 25 May 2004
May 25, 2004 Coldwater Creek (CWTR)
Hello Friends! Thanks so much for stopping by! The market is having a nice day...at least up to now...and our stocks are moving ahead nicely as well! Please remember that I am an AMATEUR investor and that you should do your own investigation of all investments discussed on this website and PLEASE consult with your investment advisors to make sure any stock market ideas are appropriate, timely, and even likely to be profitable for you!

I came across Coldwater Creek (CWTR) while scanning the lists of greatest percentage gainers. CWTR, as I write, is trading at $25.40 up $2.11 on the day or 9.06%. According to Yahoo, CWTR "...is a retailer of women's apparel, jewelry, footwear, gift items and home merchandise." The company has a traditional catalog business as well as a more actively growing base of full-line retail stores throughout the United States.
On May 19, 2004, six days ago, CWTR
announced 1st quarter 2004 results. Net sales for the quarter ended May 1, 2004, increased 8.0% to $124.5 million from $115.2 million in the fiscal 2003 first quarter. Net income increased $3.5 million or 185.0% to $5.5 million, or $.22/diluted share, compared to $1.9 million, or $.08/diluted share for the same period last year.
Looking at
Morningstar.com "5-Yr Restated" financials, we can see the steady revenue growth from $356 million in 1999 to $473 million in 2003. Earnings have been a bit erratic, peaking at $.60/share in 2000, dropping to $.08/share in 2002 and back up strongly to $.39/share in 2003. The latest quarter report also adds to the current recovery in earnings.
Free cash flow has improved nicely from a negative $(7) million in 2001, to $20 million in 2003.
The balance sheet as reported on Morningstar.com looks solid with $15.4 million in cash and $90 million in other current assets, plenty to cover both the $66.7 million in current liabilities AND the $14.6 million in long-term liabilities.
What about valuation? If we look at
"Key Statistics" from Yahoo, we can see that this is a Small Cap stock (under $1 billion capitalization) at $615.7 million market cap. The trailing p/e is a bit rich at 39.29, but with the rapid anticipated growth, the forward p/e (fye 31-Jan-06) is 23.76. Looking out 5 yrs, we have a PEG at 0.69 suggesting a very reasonable valuation on the stock. In addition, the price/sales ratio, an important figure as I understand it especially for retail ventures is also reasonable, in my opinion, at 1.07. Both the PEG and the Price/sales are, in my opinion, good numbers when they are close to or under 1.0.
Yahoo reports 24.22 million shares outstanding with 12.30 million that float. Of these shares, 5.15% of the float is out short as of 4/7/04, representing a significant 5.916 trading days of volume to cover. Anything over 3.0 days is significant, in my opinion, and thus we may be witnessing a bit of a "squeeze" in this stock.
No dividend is reported and the stock DID split 3:2 last year in September, 2003.
Taking a look at a chart on this stock:
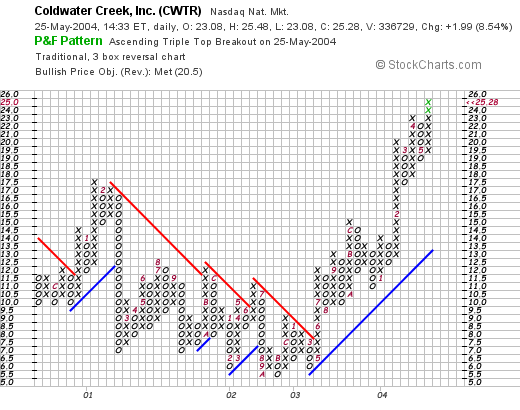
We can see that this stock was actually trading lower steadily between early 2001 through May, 2003. In June, 2003, the stock broke through a resistance level at around $7.00/share and has headed higher since. The stock may be a little overexted technically, but overall the chart looks strong to me!
What do I think? I think this is an interesting investment opportunity with the transition of this retail firm from a purely catalog business to a more traditional "bricks & mortar" retail venture. The latest earnings report is nice, the free cash flow is good, the balance sheet is solid, and the valuation is also reasonable with a PEG and a price/sales close to 1.00. Unfortunately, I don't have any money available to buy any shares...you know my story....I am waiting to sell some shares at a gain before adding another position. My trading account is at 19 positions...with a maximum of 25 positions planned. I am still heavily margined with about a 45% equity in that account...so I shall sit on my hands!
Thanks so much for stopping by! If you have any questions, comments, or words of encouragement, please feel free to email me at bobsadviceforstocks@lycos.com or leave your comments right here on the blog.
Bob
Monday, 24 May 2004
May 24, 2004 PetMed Express (PETS)
Hello Friends! Sometimes I feel like good stocks are raining cats and dogs...yuck yuck....oh well it is Monday and that is the BEST I can do! We already have WOOF so why not PETS? As always PLEASE remember that I am an AMATEUR investor, so do your homework on all stocks discussed on this website and consult with your PROFESSIONAL investment advisor to make sure any stocks you decide on are appropriate and even profitable ideas for you!

PetMed Express (PETS) came up on the lists of greatest % gainer today. It is trading currently at $7.36, up $.63 on the day or 9.36%. Generally, I do NOT like stocks under $10...I just hit my 8% stops over and over on these low-priced stocks...but it is nice sometimes to take a look at these...as some may be great investments!
According to Yahoo, PETS "...is a nationwide pet pharmacy that markets prescription and non-prescription pet medications, along with health and nutritional supplements, for dogs and cats direct to the consumer." I do NOT own any shares of this stock.
On May 17, 2004, PETS
announced 4th quarter 2004 results. For the quarter ended March 31, 2004, net sales increased 44% to $21.5 million from $14.9 million and net income for the quarter actually came in LOWER at $.06/share vs $.09/share the prior year. However, income before allowance for income taxes came in at $2.16 million vs. $1.18 million the prior year...so I am bending the rules a touch...but be aware of this as well!
Looking at the
Morningstar "5-Yr Restated" financials, we can see the rapid growth from $32 million in revenue in 2002 to $55 million in revenue in 2003. Earnings have also increased from $.04/share in 2002 to $.16/share in 2003. Net sales, per the recent financial report, came in at $94 million in 2004 with income at $.25/diluted share for the year.
Free cash flow has been at $0 for both 2002 and 2003. The balance sheet looks fine with $1 million in cash and $5.4 million in other current assets vs $3.4 million in current liabilities and only $100,000 in long-term debt reported.
This is a small cap stock with a market capitalization of only $145.21 million. The trailing p/e isn't too bad at 29.33 and the forward p/e (fye 31-Mar-05) is even better at 14.21 according to the
"Key Statistics" on Yahoo. No PEG is reported...but would expect it to be low with the low forward p/e. The Price/Sales figure isn't bad either at 1.51.
There are 19.65 million shares outstanding with 6.20 million of them that float. There is a SIGNIFICANT short interest in these shares of 657,000 as of 4/7/04 representing 10.60% of the float or 11.526 trading days of volume. This price move may as we have seen in other stocks represent a bit of a "squeeze". No cash dividend is paid and no stock dividend is reported on Yahoo.
What about the technicals?
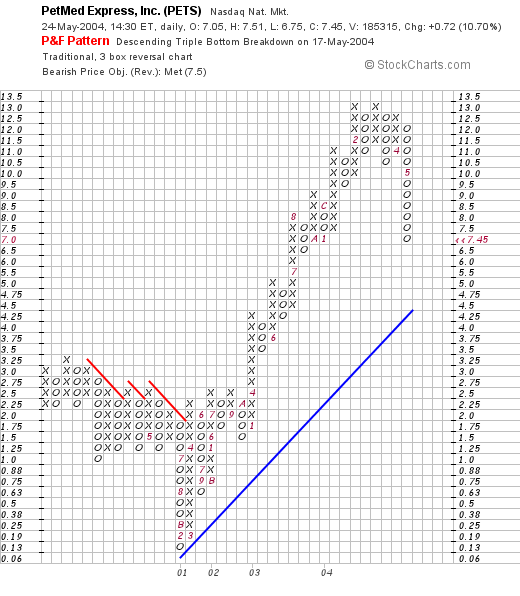
PETS has been trading higher since early 2002 when it broke through a resistance level at about $1.25! This stock has recently corrected back to $7.50 but is heading higher again today. The chart looks just fine in my humble, and AMATEUR opinion.
What do I think? The stock is a little small for me...at least low-priced...but the growth numbers are great, the balance sheet looks fine, and except for the fact that they are now starting to pay taxes, the earnings are just fine as well. It's interesting and if you like cats and dogs...well that might be just fine too!
Thanks so much for stopping by! If you have any questions, comments, or words of encouragement please feel free to leave them right here on the blog or email me at bobsadviceforstocks@lycos.com
Bob
Sunday, 23 May 2004
"Uncle Jimmy Asks" What about QMED
Hello Friends! O.K. you want to know "WHO is Uncle Jimmy?" Well first of all he is NOT my Uncle...but he is the Uncle of one of my kid's best friends....and he is the brother of another of MY friends...but THAT really doesn't matter. ALL of my friends KNOW I am just about obsessed about stocks, and they all want to tell me about their ideas, many of which are quite good, that they have heard from one source or another to see what I think. Quite frankly, some of them ARE great ideas...but my hands really are tied insofar as MY portfolio is concerned. I mean FIRST, I CANNOT buy any more stocks until I first SELL something at a gain...and second, I have my own methods of picking stocks which I shall not repeat here, but which I discuss ALL OVER this blog. But let's take a look at QMED. And as always, remember that I am an AMATEUR investor so PLEASE do your own investigation of all stocks on this website and CONSULT with your investment advisors before making any of your own decisions to make sure they are appropriate for you!

According to Yahoo, QMed, Inc., "...operates in two industry segments: disease management services and medical equipment sales. The majority of the Company's operations consist of the operations of Interactive Heart Management Corp. (IHMC), the Company's wholly owned subsidiary." Yahoo also points out that QMED "...produces, sells and supports a line of ischemic heart monitors and a system that analyzes heart rate variability under the name Monitor One nDx." I do not own any shares of this issue (but Uncle Jimmy IS now a big shareholder). QMED closed at $9.50 on 5/21/04, up $.11 or 1.17% Friday.
Well, Uncle Jimmy the FIRST place I look for information on a stock is the latest quarter. (Uncle Jimmy says he HASN'T been visiting here so I will review my methods with him...I gave him my URL earlier today...so hopefully he stops by!) On April 13, 2004, QMED
reported 1st quarter 2004 results. Revenue for the three months ended February 29, 2004, came in at $3.8 million compared to $3.7 million last year. Net loss was $(262,414) or $(.02)/share this quarter compared to a profit of $290,989 or $.02/share last year. Since I don't know personally what the future holds for any of my stocks, I would have a hard time recommending this stock at least on this result where a profit turned into a loss....that doesn't mean it might not be a GREAT investment, like you were telling me, it just means on this blog, I like to see GROWING profits...or at the least, declining losses...and not gains turning into losses....oh well that is one strike against this company....

The next place I like to check for information is Morningstar.com. The easiest for me, an amateur, to understand the financials on a particular company has been the "5-Yr Restated" financials which for QMED is located
right HERE. On this page we can see a very nice pattern of revenue growth from $2 million in 1998 to $13.7 million in the trailing twelve months. I DO like that growth!
Earnings, however, improved between 1998 and 2002 improving from a loss of $(.26)/share in 1998, finally turning a profit at $.04/share in 2002. However, the company is back losing money, as we discussed above, coming in at a loss of $(.05)/share in the trailing twelve months.
What about free cash flow? I like to look at this number Uncle Jimmy, so that I can better get a feel about how the balance sheet is likely to change in the future. Overall, QMED has had Negative cash flow of $(2) million in 2000, $(1) million in 2001, positive cash flow of $2 million in 2002, but turning negative again at $(1) million in the trailing twelve months.
Fortunately, their balance sheet looks just fine with $8.6 million in cash and $1.4 million in other current assets, plenty to cover the $2.6 million in current liabilities and $2.3 million in long-term liabilities combined. They ARE indeed quite solvent...but I would like to see that free cash flow improving not deteriorating as it has done in the past 12 months.
How about Valuation? For this, I have been using Yahoo finance "Key Statistics". For QMED, this is located
right HERE. Looking through the numbers I can see that this is a very SMALL company with a market cap of $140.22 million. The trailing p/e, is, well "n/a" which means the company IS losing money. However, the forward p/e, is a moderate 20.21 (fye 30-Nov-05). The PEG is also unavailable (perhaps there aren't any analysts giving five year forward estimates....not unusual for such a small company), and the price/sales is a very rich 10.64.
There are 14.76 million shares outstanding, with 11.10 million of them that float. There are only 226,000 shares out short, but due to the limited trading volume, this comes out to a very LARGE 13.294 trading days even though this represents only 2.04% of the float as of 4/7/04. No cash dividend and no stock splits are reported on Yahoo.
What about Technicals? How does the chart look like? I personally have come to appreciate Point & Figure charts which give me a nice feel for the trading "tides". I am an amateur at this however...so make your own assessment!
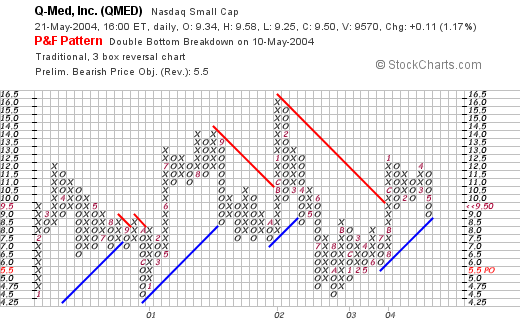
QMED stock certainly shows no signs of getting away from us! The stock has basically been trading sideways since 2000, and is currently selling just above a support level around $9.00. Technically, in my humble opinion, this is a "neutral".
So what do I think? I don't know anything about the future prospects of this company. According to Uncle Jimmy, these are "GREAT"....and indeed the company may turn out to be a terrific investment. However, it doesn't on the face of things fit into my selection criteria...that is, I like to see significant revenue growth, along WITH growth in earnings, (QMED doesn't pass), and growing FREE CASH FLOW (QMED doesn't pass). Otherwise I do like the revenue growth, and the company doesn't look over-valued....but I just don't have enough money to buy every stock. But we will revisit QMED...and see how Uncle Jimmy's stock pick works out!
Thanks so much for stopping by! And Uncle Jimmy, PLEASE excuse my analysis of this stock....I don't mean to be critical because I don't have that important information about future prospects....it is just that as an amateur investor, I am trying as hard as I can to make coherent investment decisions based on my own criteria....and QMED just doesn't fit in today. But you are a GREAT GUY and I really enjoyed visiting with you and REMEMBER to take the kids out for Kentucky Fried Chicken like you PROMISED THEM!
If Uncle Jimmy or any of my readers have any comments, suggestions, questions, or words of encouragement....please feel free to email me at bobsadviceforstocks@lycos.com
Have a great week investing everyone!
Bob
Posted by bobsadviceforstocks at 7:38 PM CDT
|
Post Comment |
Permalink
Updated: Sunday, 23 May 2004 8:51 PM CDT
Saturday, 22 May 2004
"The Annual Review" Looking back on the week of May 19, 2003
Hello Friends! We made it through another week and now we have the weekend before us. Thank goodness for that. Last week I started a new review process...if you have any comments or questions about this or anything else on this BLOG, please email me at bobsadviceforstocks@lycos.com and I will try to respond. As always, please remember that I am an AMATEUR investor and that you should do your own investigation on ALL stocks discussed on this blog and consult with your PROFESSIONAL investment advisor to make sure they are timely, appropriate, and even profitable investment ideas for you!

The first stock "picked" that week was
selected for Bob's Advice on May 19, 2003, at the price of $15.77. BDY closed on 5/21/04 at $22.52 for a gain of $6.75 or 42.8%.
On April 29, 2004, BDY
announced 1st quarter 2004 results. For the quarter ended March 31, 2004, net sales totaled $25.1 million, a 68% increase over the $14.9 million reported the prior year. Net income for the first quarter was $6.2 million, up $3.3 million or 117% compared to prior year figures. This company is STILL doing great!

Also on May 19, 2003, I
listed Genentech (DNA) on Stock Picks at a price of $53.04, however, DNA split 2:1 on 5/13/04, so our adjusted pick price was actually $26.52. Genentech closed on 5/21/04 at $59.61 for a gain of $33.09 or 124.8%.
On April 7, 2004, DNA
announced 1st quarter 2004 results. Product sales were $763.7 million in the first quarter, up 28% over the prior year. Operating revenues increased 30% to $975.1 million from $749.7 million in the prior year (clearly there is a difference between operating revenues and product sales!). GAAP earnings per share came in at $.33/share fully diluted vs. $.29/share GAAP earnings the prior year. It does make me a little nervous with all of the "pro forma" and GAAP and non-GAAP numbers on this balance sheet as I am NOT an accountant and do not like seeing all sorts of footnotes...but DNA has done great in the market...and the market liked these numbers!

Home Depot was
selected for Stock Picks on 5/20/03 at a price of $31.10. HD closed at $34.47 on 5/21/04 for a gain of $3.37 or 10.8%.
How is Home Depot doing now? On May 18, 2004, HD
announced 1st quarter 2004 results. Net sales were up 16% to $17.55 billion (topping estimates of $17.12 billion). First quarter net income came in at $1.1 billion or $.49/share compared with $907 million or $.39/share last year. Same store sales (those open at least a year) gained 7.7%, "...the highest first period growth in five years." These were great results!

On May 21, 2003, I
selected Synovis Life Technology (SYNO) for Stock Picks at a price of $14.39. SYNO closed on 5/21/04 at $9.54 for a loss of $(4.85) or (33.7)%. Not EVERY stock on this blog makes money!
On May 19, 2004, (just a few days ago), SYNO
reported 2nd quarter fiscal results. Revenue came in at $13.7 million, DOWN 10% from the prior year's $15.3 million. However, this WAS a 19% sequential improvement from the prior quarter's results. Operating income was $644,000, vs the
$1.9 million the prior year. Net income came in at $483,000, or $.04/diluted share, vs. $1.2 million or $.12/diluted share the prior year. In addition, SYNO also CUT GUIDANCE for the upcoming year. This is NOT very good results, and this would not be the kind of stock I would be looking for to post on this website!

Enzo Biochem (ENZ) was
posted on Bob's Advice on 5/22/03 at a price of $20.40. ENZ closed on 5/21/04 at $12.76 for a loss of $(7.64) or (37.5)%.
On March 16, 2004, ENZ
reported 2nd quarter 2004 results. Operating revenue for the second quarter of 2004 came in at $11.0 million, down from $13.1 million the prior year. Gross profit ammounted to $8.1 million, down from $10.4 million last year. Net loss for this quarter came in at $(1.5) million or $(.05)/diluted share compared to net profit the prior year of $1.4 million or $.05/share. These are not what I would call great results!
Over and over we can see for ourselves the relationship between good revenue and earnings news and good price movement. Bad news almost inevitably results in poor price performance!

I
posted Dicks Sporting Goods (DKS) on Stock Picks at $29.75/share on 5/22/03. DKS split 2:1 in 4/04 making our effective stock pick price $14.88. DKS closed on 5/21/04 at $25.35 for a gain of $10.47 or 70.4%.
On May 18, 2004, DKS
reported 1st quarter 2004 results. Total sales for the quarter increased 20% to $364.2 million, with comparable store sales up by 4.6%. Net income zoomed 64% to $10.9 million and earnings per share increased 50% to $.21/diluted share from net income of $6.7 million or $.14/diluted share for the quarter ended May 3, 2003. The street was not so excited about DKS' statement on the upcoming quarter when they forecast same store sales growth in the range of 2-3%. We can see the importance of same store sales growth numbers in both the stock price performance and the actual financial performance of any retail company!
On May 22, 2003, I
posted New Century Financial (NCEN) on Stock Picks at a price of $47.02. NCEN had a 3:2 split on 7/14/03 making our effective selection price $31.35. NCEN closed on 5/21/04 at $41.35 for a gain of $10.00 or 31.9%.
On 4/22/04, NCEN
announced 1st quarter 2004 results: total revenues came in at $361 million, up from $181 millionlast year. Diluted earnings per share came in at $2.03 up from $1.23/share last year. These are great results for the quarter ended 3/31/04.
I
selected NVR (NVR) for Stock Picks Bob's Advice on 5/23/03 at a price of $394.86. NVR closed on 5/21/04 at $434.50 for a gain of $39.64 or 10%.
On April 16, 2004, NVR
announced 1st quarter 2004 results. Total revenues increased 18% to $879 million compared to $744 million in 2003 same quarter. Net income came in at $100.6 million compared to $87.8 million the prior year, and diluted earnings per share increased 25% from $10.10 last year to $12.58 this latest quarter. These were great results.
o.k. HANG IN THERE I AM AT THE LAST ONE!
Red Robin Gourmet Burgers (RRGB) was
selected for Stock Picks Bob's Advice on 5/23/03 at a price of $17.00. RRGB closed on 5/21/04 at $27.29 for a gain of $10.29 or 60.5%.
So is RRGB still selling burgers? Well on 5/20/04
Red Robin announced 1st quarter results. For the quarter ended 4/18/04, total company revenues increased 25.7% to $116.7 million, company-owned comparable store sales increased 8.4%, income from operations jumped 40.8% to $8.6 million, and diluted earnings per share increased 36.8% to $.32. These are very nice results in my opinion.
In SUMMARY, of these nine stocks selected the week of May 19, 2003, a year later seven were sporting gains ranging from 10.0% (NVR) to 124.8% (DNA); two stocks were losing money: SYNO (33.7)%, and ENZ (37.5)%. The average performance for these nine issues was a gain of 31.1%. Now that isn't too bad a performance considering even the week three months of this year!
Thanks so much for stopping by! Remember that past performance is NO guarantee of future performance. Of these stocks I currently have no shares of any of these issues. My children do own some shares of Home Depot. If you have any questions, comments or words of encouragement, AS ALWAYS, please feel free to email me at bobsadviceforstocks@lycos.com
Have a GREAT weekend everyone!
Bob
Newer | Latest | Older


