Stock Picks Bob's Advice
Sunday, 29 August 2004
"Looking Back One Year" A review of stock picks from the week of August 11, 2003

Hello Friends! Thanks so much for stopping by! I have had a quiet week on the blog, with a combination of not seeing much new that I liked, and just being away from my computer as well. I think I will be starting to "revisit" stocks that I have not discussed in a year or so that make nice moves in the market. Just a thought. As always, please remember that I am an amateur investor, so please consult with your professional investment advisors and do your own investigations prior to making any investment decisions based on material on this website!

I
selected Possis Medical (POSS) for
Stock Picks Bob's Advice on August 11, 2003, at $17.33. POSS closed on 8/27/04 at $18.04 for a gain of $.71 or 4.1%.
On May 18, 2004, POSS announced
3rd quarter 2004 results.

Sales came in at $19.3 million for the fiscal quarter ended April 30, 2004, up 32% from the prior year. Net income was $.16, a 60% increase, from the $.10 in the prior year. These were nice results.
However, on August 24, shares of POSS dropped as much as 41% after the company
cut revenue outlook for fiscal 2005 to $85-$90 million from previous forecast of $92 million to $98 million on disappointing study results for its AngioJet blood clot treatment after heart attacks. This is not the kind of news that is helpful in moving a stock higher!

I
posted Techne (TECH) on this blog on August 12, 2003, at a price of $32.08. TECH closed on 8/27/04 at $40.75 for a gain of $8.67 or 27%.
On August 10, 2004, TECH
released unaudited 4th quarter 2004 results. Consolidated net sales for the quarter ended June 30, 2004, were $42.5 million, an 8% increase over the prior year. Consolidated net earnings were $13.4 million or $.32/diluted share compared with $12.7 million or $.31/diluted share the prior year. These results are o.k. if not stellar.

On August 14, 2003, I
posted Tyler Technologies (TYL) on this blog at $5.75/share. TYL closed at $9.04 on 8/27/04 for a gain of $3.29 or 57.2%.
On July 28, 2004, TYL
announced 2nd quarter 2004 results. Revenue for the quarter ended June 30, 2004, increased 22% to $44.3 million from $35.1 million last year. Net income for the three months was $3.0 million or $.07/diluted share up from $2.0 million, or $.04/diluted share the prior year. These were very nice results and you can see that the stock price has responded appropriately!
Well, how did we do with these three stocks now that it is a year later? Well all three had gains with 4.1% appreciation for POSS, 27% for TECH, and 57.2% for TYL. The average gain for the three was 29.4% for the one year period.
Thanks so much for stopping by! Remember, past results DO NOT guarantee future results, and that I am an amateur and you really need to do your own investigation on all of these stocks and consult with your professional investment advisors! As always, if you have any questions, comments, or words of encouragement, please feel free to email me at bobsadviceforstocks@lycos.com
Bob
Wednesday, 25 August 2004
August 25, 2004 Williams-Sonoma Inc. (WSM)
Hello Friends! I am delighted that you are taking the time to visit my blog,
Stock Picks Bob's Advice! Always remember, even if I present a polished product for you to read, that I am an AMATEUR investor, and please consult with your professional investment advisors all investment ideas on this website to make sure they are appropriate and timely for you! Also, if you have any comments or questions, I would be delighted to hear from you and will try to answer your questions right on this blog. You can contact me at bobsadviceforstocks@lycos.com .

Well I finally made it to the
NYSE Price % Gainers list. Williams-Sonoma (WSM) had a GREAT day today, closing at $34.64, up $3.14 or 9.97% on the day. I do not own any shares of this company nor do I own any options.
And you guessed it, what drove this stock higher? EARNINGS. Earnings are such an important ingredient in the successful investment strategy! This morning, before the open of trading, WSM
announced 2nd quarter 2004 results. Revenues for the second quarter ended August 1, 2004, increased 18.8% over the second quarter of 2003. Diluted earnings per share for the second quarter increased 53.3% over prior year results to $.23/share, $.03 above the high end of guidance provided by the company in May, 2004.
On a comparable store basis, sales increased 5.0%. The Pottery Barn stores were strongest with 10.2% same store sales increases, while the flagship Williams-Sonoma stores were actually the weakest with a (1.6%) decrease in same store sales. Interestingly, this parallels the Ann Taylor story, a stock I do own and have discussed elsewhere, where the Rack stores are growing much stronger than THEIR flagship stores. Go figure.
How about longer-term? Looking at the
"5-Yr Restated" financials on Morningstar.com, we can see the pretty picture of revenue growth with $1.5 billion in 2000, increasing each year to the $2.9 billion in the trailing twelve months (TTM). Earnings per share, while dropping slightly to $.50 from $.58 in 2001, have otherwise grown steadily to $1.39 in the TTM. Free cash flow, which dropped to $(3) million in 2004 has otherwise increased from $49 million in 2002 to $66 million in the TTM.
How about the balance sheet? Looking at Morningstar.com, we can see $74.6 million in cash and $556.5 million in other current assets as compared to $367.0 million in current liabilities and only $227.4 million in long-term debt. Williams-Sonoma seems to have ample cash and current assets to easily cover the current liabilities and could pay off most of its long-term liabilities as well without much of a stretch.
How about "valuation"? I like to use
"Key Statistics" on Yahoo to help me look at this question. If we use a range of $500 million to $3.0 billion in market cap for a mid cap stock, we find WSM a Large Cap stock with a market cap of 44.03 billion. The trailing p/e isn't too bad (imho) at 25.19, the forward p/e is even nicer at 18.72 (fye 1-Feb-06). Based on "5 yr expected" earnings, Yahoo shows the PEG at 0.97. I love it whenever it is below 1.0! Price/sales also moderate at 1.28.
Yahoo reports 116.25 million shares outstanding with 73.20 million of them that float. They also report that as of 7/8/04, there are 5.68 million shares out short (up from 4.10 million the prior month). Using a 3 day supply as a cut-off for significance (just one of those things I like to do), we find that WSM has 6.286 trading days of shorts. With that many short sellers, you can see why the stock really "popped" today on good news as some of the short sellers must have been scrambline to buy shares to cover their "shorts".
Yahoo reports no cash dividend, and the last stock split was a 2:1 split in May, 2002.
How about "technicals"? If we look at a Point and Figure chart from Stockcharts.com:
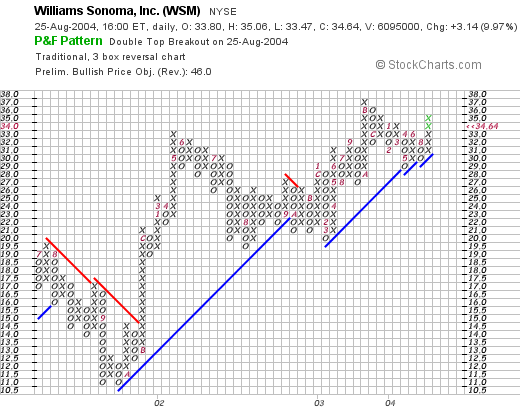
we can see that while WSM was trading lower in late 2001, bottoming at about $11/share, the stock turned higher in November, 2001, and has moved higher steadily since then with a small pause in October 2002. The graph looks strong to me!
So what do I think? Well, the earnings look very nice with strong and steady revenue growth. Quite frankly the only thing that disturbs me was the slowdown in sales at the flagship stores, however, with the Pottery Barn and Outlets included, same stores were up a solid 5%.
Valuation looks nice, the balance sheet is just fine, and the technicals look nice. Looks like a nice stock to have in the portfolio! As for me, well I am stil sitting on my hands, waiting to sell a portion of one of my positions at a gain!
Thanks so much for stopping by! Again, email me at bobsadviceforstocks@lycos.com if you have any questions or comments.
Bob
Saturday, 21 August 2004
"Looking Back One Year" A review of stock picks from the week of August 4, 2003
Hello Friends! It is Saturday, and one thing I like to do on the weekend is to answer my mail, and check and see how the selections I have posted here on
Stock Picks Bob's Advice are doing. Please remember that I am an amateur investor so please consult with your own professional investment advisors before making any decisions based on information on this blog. If you have any comments or questions on this website, please feel free to email me at bobsadviceforstocks@lycos.com .

On August 4, 2003, I
posted Mylan (MYL) on this blog at a price of $34.50. MYL split 3:2 on 10/9/03 nmaking my effective stock pick price actually $23. MYL closed on 8/20/04 at $16.89 for a loss of $(6.11) or (26.6)%. (Please note that for the purpose of review, I always consider that I would be using a "buy and hold" strategy for these picks, if I HAD bought them, but actually, I place an 8% stop loss, usually using a "mental" stop, and sell when it hits that level. Implementing THAT strategy would certainly affect my performance!)
There has been a LOT of news on MYL recently, mostly involving an acquisition of King Pharma and interest in MYL by Carl Icahn. For the sake of this review, I will restrict my review to the latest quarterely result, which for MYL, was
released on July 26, 2004. For the quarter ended June 30, 2004, net revenues were fairly flat at $339 million, a $7.6 million increase over net revenues the prior year. Earnings/diluted share came in at $.30 for the first quarter 2005, exactly the same as the first quarter 2004 results. This was not exactly a spectacular result and the street responded accordingly.

I
posted Intier Automotive (IAIA) on Stock Picks on August 4, 2003, at a price of $16.50. IAIA closed at $18.441 on 8/19/04 for a gain of $1.941 or 11.8%.
On August 3, 2004, IAIA
announced 2nd quarter 2004 results. For the quarter ended June 30, 2003, sales increased 26% to $1.4 billion compared to $1.1 billion for the same period in 2003. Operating income increased strongly to $67.9 million compared to $39.9 million last year. Diluted earnings per share for the quarter came in at $.61 compared to diluted earnings per share from continuing operations of $.36/share for the same period in 2003. These were very strong results imho.

On August 4, 2003, I
posted Atrion (ATRI) on Stock Picks at $34.70. ATRI closed at $45.40 on 8/20/04 for a gain during the year of $10.70/share or 30.8%.
On July 29, 2004, ATRI
announced 2nd quarter 2004 results. Revenues for the quarter were only up 1% to $16.4 million from $16.2 million for the same quarter last year. Diluted earnings per share, however, jumped 21% to $.87 compared to $.72 last year. Personally, I would like to see revenue growth along with earnings growth on all of these stock picks...so I am less than impressed with this report although the stock price is doing just fine!
 Sunrise Senior Living (SRZ)
 was posted on Stock Picks on August 6, 2003, at a price of $23.95/share. SRZ closed on 8/20/04 at a price of $35.06 for a gain of $11.11/share or 46.4%.
On August 3, 2004, SRZ
reported 2nd quarter 2004 results. Excluding property sales in 2003 and 2004, earnings increased $.14 or 70% to $.34/share this quarter. Otherwise, with sales included, earnings dropped by $.01 to $.66/diluted share. For the quarter, revenue "under management" increased 10% to $437 million. The numbers are a bit confusing to me with all of the exceptions and clarifications, but apparently the "street" was happy with the result, and the stock has remained strong.

I
posted DRS Technologies (DRS) on Stock Picks on August 6, 2003, at a price of $27.98/share. DRS closed at $37.52 on 8/20/04 for a gain of $9.54 or 34.1%.
On August 5, 2004, DRS
reported 1st quarter 2005 results. Revenues jumped 80% to $300.7 million. Net earnings came in at $11.8 million or $.43/share compared with $7.3 million or $.32/share the prior year. DRS went ahead and RAISED its outlook for fiscal 2005 due to an acquisition and new orders. This was a very strong earnings report imho.
 Pulte Homes (PHM) was posted
 on Stock Picks on August 6, 2003, at a price of $63.86. PHM split 2:1 on 1/5/04, and as a result, the effective pick price was actually $31.93. PHM closed at $58.76 on 8/20/04 for a gain of $26.83 or 84%.
On July 26, 2004, PHM
reported 2nd quarter 2004 resultsRevenues from domestic homebuilding settlements increased 30% to $2.4 billion. There was a 9% increase in the average selling price to $282,000, combined with a 19% increase in home closings to 8,480 homes. Net income came in at $187.7 million, a 54% increase over the $122.0 million the prior year. Earnings per diluted share were $1.45 for the quarter, a 48% increase over the prior year earnings of $.98/share. In addition, the company RAISED EARNINGS GUIDANCE (I always like to put THAT in caps!) for continuing operations in 2004 to the range of $7.80 to $8.00/diluted share. This appears to really be a terrific report from PHM. Again, even as I commented on my first post, I am concerned about climbing interest rates....but I would not let my phobias interfere with owning this or any other stock....just have to stick with the rules!

On August 6, 2003, I
posted Zimmer Holdings (ZMH) on Stock Picks at $49.79/share. ZMH closed on 8/20/04 at $73.23/share for a gain of $23.44 or 47.1%.
On July 28, 2004, ZMH
announced 2nd quarter 2004 results. Earnings came in at $116.3 million, or $.47/diluted share, compared with $89 million or $.45/diluted share the prior year. Excluding acquisition related items, they actually came in at $.58/share (analysts were looking for $.55). Nicely, the company RAISED GUIDANCE for the full year, projecting net earnings of $1.86 to $1.90/share and $2.26 to $2.30 on an "adjusted basis". Analysts WERE looking for $2.25/share on an adjusted basis. The stock has been a solid performer in the past, and it appears that the "street" still embraces its current outlook.

I
posted FTI Consulting (FCN) on Stock Picks at $21.90 on August 6, 2003. FCN closed at $17.30 on 8/20/04 for a loss of $(4.60) or (21)%.
On July 28, 2004, FCN
announced 2nd quarter 2004 results. For the quarter ended June 30, 2004, revenues were $107.4 million, compared with $94.5 million from continuing operations for the prior year same quarter, an increase of 13.7%. Income from continuing operations was $12.8 million compared with $18.5 million the prior year, a DECREASE of 30.8%. Earnings per diluted share came in at $.30 compared with $.44 from continuing operations the prior year, a decrease of 31.8%. These are less than exciting results, and as you can see, the stock price has performed accordingly!

On August 7, 2003, I
posted Jos. A. Banks (JOSB) on Stock Picks at $44.16. JOSB split 3:2 on 2/19/04 for a resultand stock pick price of $29.44 and then split 5:4 on 8/19/04 for a subsequent effective price of $23.55. JOSB closed at $27.27 on 8/20/04 for a gain of $3.72 or 15.8%.
On May 25, 2004, JOSB
announced 1st quarter 2004 results. For the quarter ending January 29, 2004, total sales increased 28.3% to $79.9 million from $62.3 million the prior year. Comparable store sales were up 13.6% (a very strong number), with combined catalog and internet sales up 18.7% for the quarter. Earnings per share were $.47 vs $.20/share the prior year, an increase of 135%. In addition, the company RAISED GUIDANCE, with earnings expected to come in at $23.3 million compared with $16.6 million in 2003. This is really a GREAT report, and it will be interesting to see what happens for the 2nd quarter report which should be out in the next few days!

On August 8, 2003, Emulex (ELX) was
posted on Stock Picks at $22.46. ELX closed at $10.30 on 8/20/04 for a loss of $(12.16)or (54.1)%.
On August 5, 2004, ELX
reported 4th quarter 2004 results. Revenue rose 6% to $86.4 million from $81.8 million the prior year, however, this was 13% lower than the previous quarter! Net income came in at $10.6 million or $.13/share down 42% (!) from $18.4 million or $.22/share the prior year. These were definitely NOT very good results, and you can see the effects of this on the stock price!

I
posted eSpeed (ESPD) on August 8, 2003, at $18.98/share. ESPD closed at $10.75/share on 8/20/04 for a loss of $(8.23) or (43.4)%.
On August 5, 2004, ESPD
announced 2nd quarter 2004 results. Total revenue for the second quarter came in at $42.8 million, compared with $39.1 million the prior year. Net income was $9.0 million or $.16/diluted share compared with $9.1 million or $.16/share last year. This just doesn't show the growth in revenue and earnings that I like to see in this blog! And you can see how poorly the stock price has performed!
Well, that was the week. PHEW. Finally got THAT out of the way! Well how did we do? Of the eleven stocks picked that week, I had seven gainers and four losers for an average gain of 11.35%. Not really too bad a performance overall! Thanks again for stopping by! If you have any questions or comments, please feel free to email me at bobsadviceforstocks@lycos.com .
Bob
A Reader Writes "Do you have an email newsletter?"
Hello Friends! I was delighted to go and check my blog mailbox and find a couple of new comments and letters! (I always like getting mail....don't you?)
Corry writes:
HI
I was browsing and stumbled on your blog. I was
wondering if you have an email list of what you post
on your blog, i.e. stock picks etc. Just curious
CorryWell Corry, I am not at a level where I am writing an email newsletter. Frankly, I get so many of those newsletters, and solicitations, that I would suspect many people might not be interested. But then again if there is more interest expressed on this subject, I would be happy to look into getting it going!
Meanwhile, come back and visit often. I feel like my blog is a great big library of information, so please feel free to browse in the stacks! Remember I am an amateur investor, so please take everything I write with a grain of salt! Check with your professional investment advisors and above all good-luck with your investments!
Bob
August 21, 2004 Pixelworks (PXLW)
Hello Friends! It is Saturday afternoon here in Wisconsin and a beautiful one at that. The sky is sunny and the temperature was in the 70's. Unfortunately, the leaves are just showing a hint of yellow as Winter is peaking around the corner. Back to School sales are on and the kids are getting ready to return to their studies. I really wanted to get this post in yesterday, but you know how those things go. But before I get to any review this weekend let's take a look at a stock. As always, please remember that I am an amateur investor, so please consult with your professional investment advisors to make sure that investments discussed are timely and appropriate for you! If you have any questions or comments, please feel free to email me at bobsadviceforstocks@lycos.com .

Scanning through the
list of top NASDAQ gainers, I came across Pixelworks (PXLW). I do not own any shares nor do I have any options on this stock. PXLW had a great day Friday closing at $10.96, up $1.62 or 17.34%. According to the
Yahoo "Profile", Pixelworks "...designs, develops and markets semiconductors and software products for the advanced display industry, including advanced televisions, multimedia projectors and flat-panel monitors."
On July 20, 2004, PXLW
announced 2nd quarter 2004 results. For the quarter ended June 30, 2004, revenue came in at $48.5 milllion, a 49% increase over the $32.6 million reported in the same quarter in 2003, and a 7% sequential increase over the $45.3 million reported in the first quarter of 2004. Net income was $5.8 million, or $.12/diluted share, up from $420,000 or $.01/diluted share in the second quarter of 2003. The company also projected third quarter results with revenue of $47 to $50 million, a year over year increas of 32% to 41%. They announced expected GAAP eps of $.08 to $.11 for the upcoming quarter.

How about longer term? Taking a look at
"5-Yr Restated" financials, we can see a steady and impressive growth in revenue from $13 million in 1999 to $140.9 million in 2003 and $154.2 million in the trailing twelve months (TTM). Earnings have improved from losses of $(1.05) in 2001 through 2003 at $(.01) and has turned profitable at $.12/share in the TTM. Free cash flow has also been improving, according to Morningstar, with $5 million in 2001 increasing to $13 million in the TTM.
The balance sheet is absolutely gorgeous with $101.2 million in cash and $30.4 million in other current assets as opposed to $20.9 million in current liabilities and NO long-term liabilities reported on Morningstar.
How about valuation? Looking at
"Key Statistics" on Yahoo, we can first see that this is a Small Cap stock with a market cap of only $503.73 million. The trailing p/e is steep at 48.50 but the growth is so FAST that the forward p/e (fye 31-Dec-05) is only 18.58. Thus, the PEG looks great at 0.91. Price/sales is moderate at 2.52.
Yahoo reports 45.96 million shares outstanding with 41.20 million that float. As of 7/8/04, Yahoo reports 6.48 million shares out short, a significant number with a short ratio of 4.801, with 15.73% of the float out short. This number is up from 5.12 million shares out short reported the prior month. The short interest could be adding to the upwards price pressure noted Friday as short sellers may (?) be scrambling to cover.
Yahoo reports no cash dividend and no stock dividends are reported.
What about "technicals"? I like to look at Point & Figure charts for this, and looking at Stockcharts.com:
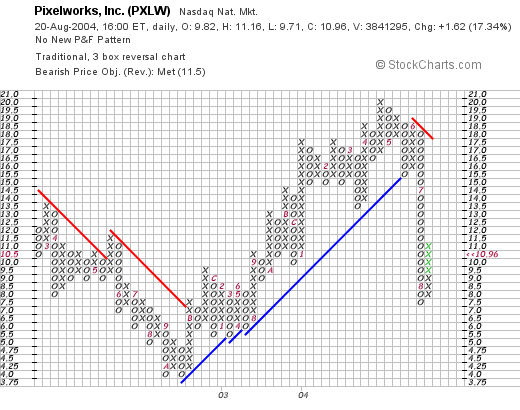
we can see that this stock was trading lower from March, 2002, when it was at the $14.5 level, down to a low of $4.00/share in October, 2002. The stock broke through a resistance level at $8.00 in November, 2002, and traded higher until recently when it broke through a support level at $15 in May, 2004. The stock appears to be finding a new support level at around $8.50, but needs to get through $18.00 to completely 'reverse' this trend. As you all know, I am NOT an expert technician, so review this chart as well and see what you think!
So what do I think about this stock? I actually like this stock a lot. Let me review: the stock had a great move yesterday, the latest quarterly report appeared outstanding, the five year revenue and earnings improvement is impressive, the growing free cash flow is attractive, and the balance sheet is beautiful! Valuation is a bit steep based on current p/e, but analysts are expecting such a rapid growth down the line that the PEG is actually under 1.0. Technically, the graph is less than ideal, with what appears to be a breakdown in price momentum.
Will I buy shares? Well, if you follow my trading strategy, you will know that I can't buy anything until I sell a portion of one of my current holdings at a gain....but if I was in the market, I probably would nibble on a few shares. The only other thing that bothers me about this stock is the price. I like to see stocks a little higher in price...makes the volatility a little more tolerable...less likely to quickly get stepped out on a small pullback causing me to hit my 8% loss limit.
Thanks so much for visiting my blog, Stock Picks Bob's Advice. As always, please make yourself at home and feel free to email me with any questions or comments at bobsadviceforstocks@lycos.com . I will probably respond right in the blog itself!
Have a great weekend everyone!
Bob
Thursday, 19 August 2004
August 19, 2004 Petco Animal Supplies Inc (PETC)
Hello Friends! Thanks so much for stopping by! If you are new here, please feel free to browse my
blog. As always, please remember that I am an amateur investor, so please consult with your professional investment advisors prior to making any decisions regarding any information on this website. If you have any questions or comments, please feel free to email me at bobsadviceforstocks@lycos.com .
Almost every day, when looking for stocks, I start with the
list of top% gainers on the NASDAQ. (I also usually take a look at the NYSE and AMEX lists as well!) Emphasizing stocks with prices over $10 (my preference to avoid excessive volatility and hopefully to improve the quality of the underlying companies), I then check many of these stocks on Morningstar.com to see if they have solid fundamentals as well.

Today I came across Petco Animal Supplies (PETC) which had a great day closing at $32.90, up $3.18, or 10.70% in an otherwise weak trading day. I do NOT own any shares nor do I own any options on this stock. As an added plus, the stock is trading up $.20 as I write in after hours trading another gain of 0.61%.

What drove the stock higher today, was that yesterday, after the close, PETC
reported 2nd quarter 2004 results. Net sales for the second quarter ended July 31, 2004, came in at $438.5 million, a 12.9% increase over the second quarter of fiscal 2003. Pertinently, the same-store net sales increased 6.7% during the quarter which was quite solid imho. Net earnings came in at $19.3 million, or $.33/diluted share, compared with $13.5 million, or $.23/diluted share in the same period a year earlier. The company forecast continued 5%-6% sames store sales growth for the third quarter, and RAISED GUIDANCE for fiscal 2004 to $1.48 to $1.49, over the previous guidance of $1.43 to $1.44/diluted share...representing a greater than 25% increase over last year's results. The "street" like what it heard and the stock price responded!

If we look at
Morningstar.com "5-Yr Restated" financials, we can see that revenue growth has been steady from $1.0 billion in 2000, increasing to $1.7 billion in 2004. Earnings per share are reported at $1.11 in 2004 and $1.19 in the trailing twelve months. Free cash flow has been also improving with $24 million reported in 2002, and $87 million in the trailing twelve months.
The balance sheet, as reported on Morningstar.com, appears adequate if not spectacular with $65.1 million of cash and $189.1 million of other current assets reported as compared with $189.3 million in current liabilities, and $312.2 million in long-term liabilities. Enough to cover the current liabilities easily, but not so lucky as to have enough current assets to cover the long-term liabilities as well. (Aren't these animal pictures from the Petco
website absolutely charming?)
For a "valuation" assessment, I like to check the easily understandable
"Key Statistics" on Yahoo.com. Here we can see that the market cap is a Mid-Cap $1.89 billion. The trailing p/e isn't bad at 25.56, and the forward p/e (fye 31-Jan-06) is even nicer at 18.59. With the solid earnings growth, the calculated PEG comes in at a pretty 0.83. The Price/Sales ratio is also cheap at 1.00.
According to Yahoo, there are 57.49 million shares outstanding with 51.60 million of them that float. Currently there are 1.42 million shares out short, which sounds like a lot, but with the solid daily volume, comes in at 2.75% of the float or 2.385 trading days. (Using my 3 day trading cut-off...totally arbritrary on my part...this isn't quite as bad a short interest as in some stocks.)
No dividend is paid, and Yahoo does not report any stock splits.
How about a graph? Looking at a Point & Figure chart from
Stockcharts.com:
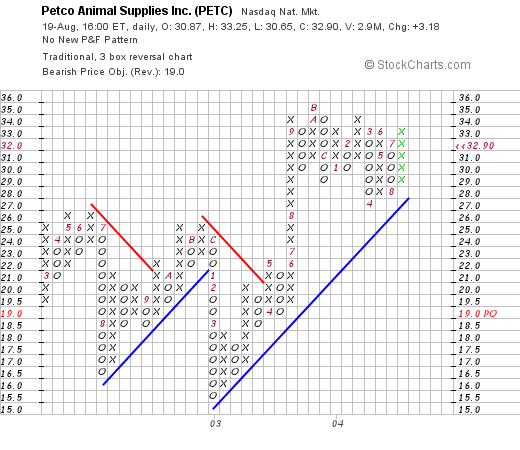
we can see that the stock was really trading sideways between 2002 and 2003 when in April, 2003, it broke through a resistance level at about $20/share and has traded higher since that time. Recently it has run into the same support level at around $28 and now is trading higher once again. The graph looks fine to me at this time.
So what do I think? Well, I like this stock. The earnings report is great with same store sales exceeding 5% in this week retail market, and with the company raising guidance...so important for subsequent stock price appreciation. The record this past five years is solid, the company is generating increasing free cash flow, while the balance sheet which is good, may very well be improving in the face of the free cash flow generation. Valuation-wise, the P/E isn't bad and the PEG is even nicer at 0.83. Finally, the graph looks fine to me!
Well, I am NOT in the market to buy any shares, but if I were....well you never know, I might just pick up a few!
Thanks so much for stopping by! Remember, I am an amateur investor, so take everything I write with a grain of salt and consult with your investment advisors! Regards to all of my friends!
Bob
Tuesday, 17 August 2004
A reader writes "What does the NASDAQ National Market mean?"
Hello Friends! Thanks for stopping by. Please remember that I am an amateur investor, so please consult with your professional investment advisors prior to making any investment decisions based on information on this website. As always, if you have any quesations, comments, or words of encouragement, please feel free to email me at bobsadviceforstocks@lycos.com and I will try to get back to you, most likely right here on the blog.
Vishwa, a previous letter-writer, was kind enough to drop me another line. Vish' writes:
Dear Bob,
Thanks for answering my question (about DHB Industries) patiently on
your
blog. Although I'd like to agree with you about the fact that the
generally
weak market might have resulted in pulling down DHB inspite of
fantastic 2nd
quarter earnings, the 18% drop (and more in the days since) is what
strikes
me as jaw-dropping. If the drop was around the 5-7% range, I'd have
dismissed it off as the weak market's influence.
In any case, I have another question for you, if you may be kind
enough to
answer it.
What does it mean when a company's listing is elevated from the
NASDAQ Small
cap market index to the NASDAQ National market index? Does it speak
well of
the company's future growth prospects or is there any other advantage
for
the company (like wider exposure, hence greater chance for stock
movement...). How about any disadvantages?
Best regards,
Vish'First of all, DHB closed today, in an otherwise strong market at $12.16, down another $(.30) or (2.41)%. I don't see any news to explain this move. In fact DHB was
mentioned favorably YESTERDAY on BusinessWeek online.
If we look at an updated point and figure chart:
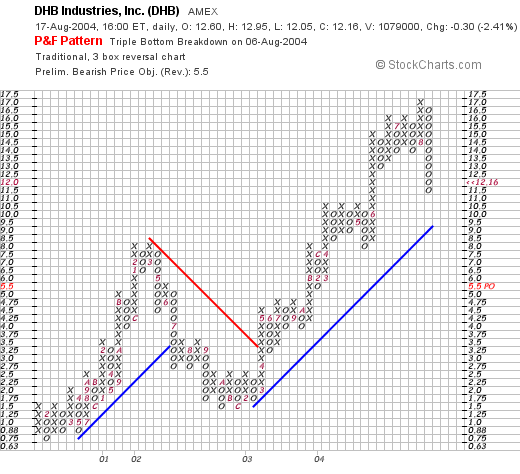
you can see that this stock was very extended from its support levels and is having a pullback without breaking down. If the stock were to traded under $10, then I would really be concerned. Unfortunately, the system I use does not allow for these large swings and with an 8% stop, I would stop right out of this stock long before it reached $10. However, don't you agree that the point and figure chart does NOT show that the stock has broken down? One lesson on stocks, is that they often trade HIGHER in ANTICIPATION of news, and then trade LOWER on the release of the news. Doesn't always make sense in the short run, but that is how it works.
On your other question, I really had to hit my Google to get an answer. The NASDAQ Small Cap Market consists of "...securities of smaller, less-capitalized companies (small caps) that do not qualify for inclusion in the NASDAQ National Market" according to the ADFN financial glossary.
Here is the scoop from the internet: Website for NASDAQ listing requirements. You can see that basically, there is a large number of requirements for market capitalization, number of shares, minimum bid price, and continued listing. You can review the details.
Basically, when stocks are not meeting requirements from the NASDAQ National Market, they can drop to the NASDAQ Small Cap Market, and if they fail THAT test, they start listing as a Bulletin Board or Pink Sheet stock...suggesting even lower quality of the underlying business. It really doesn't have much to do with the growth prospects but rather of the quality of the underlying financials. Since many people, or at least some investors may not wish to invest in the most speculative of issues, when a stock is listed on the National from the SmallCap Market, this will open up its market for its shares to more attention both from Institutions and from Individual Investors.
I hope that is helpful. The link above gives a lot of the exact details!
Good-luck investing and thanks for writing!
Bob
Monday, 16 August 2004
August 16, 2004 Lowe's Companies (LOW)
Hello Friends! It seems like we have been going through a bit of a "dry spell" around these parts. I have been successfully been "sitting on my hands" trying to avoid breaking my own trading rules in my
"Trading Portfolio" which I really need to update on the website. As you probably know, I am an amateur investor, so PLEASE consult with your professional investment advisors prior to making any investment decisions based on any information on this website. As always, if you have any comments or questions, please feel free to email me at bobsadviceforstocks@lycos.com and I will try to get back to you, usually by posting a response on this blog. If you use the links to the left side of the main website,
"Bob's Advice for Stocks", you may find it interesting to browse through the over 600 entries on this blog (can you believe it?). Hopefully, as that old Ronald Reagan joke goes, "There is a pony in there somewhere!"
Scanning through the
USA Today list of top % gainers on the NYSE, I came across Lowe's Companies (LOW), which as I write is trading at $49.11, up $2.46 or 5.27% on the day. I do NOT own any shares nor have any options on this stock. Lowe's is a competitor to Home Depot (HD), which I
posted on Stock Picks Bob's Advice on May 20, 2003. According to the
Yahoo "Profile" on Low, this company "...is a home improvement retailer, with a specific emphasis on retail do-it-yourself (DIY) and commercial business customers."

Just a few moments ago, LOW
reported 2nd quarter 2004 results. Total sales rose 17% to $10.2 billion, and sales in stores open at least a year, rose 5.1%, which although below Lowe's expected 6 to 7% estimate, firmed towards the end of the quarter, and Lowe's went ahead and indicated current sales were running ahead of guidance. Net income was $704 million, or $.89/share, compared with $597 million, or $.75/share the prior year. These results were good enough to push the stock higher in trading today!
If we take a look at
Morningstar.com "5-Yr Restated" financials, we can see the steady and impressive growth in revenue from $15.4 billion in 2000 to $32.4 billion in the trailing twelve months (TTM). Earnings have also steadily increased from $.88/share in 2000 to $2.38 in the TTM. Just as nice, LOW has paid a dividend and raised its dividend each and every year from $.06/share in 2000 to $.12/share in the TTM.
Free cash flow, which was a negative $(600) million in 2002, has improved and is currently at $575 million in the TTM.
The balance sheet shows $2.0 billion in cash and $6.1 billion in other current assets, plenty to cover the $5.9 billion in current liabilities and make a large dent in the $4.4 billion in long-term liabilities.
What about valuation? Looking at
"Key Statistics" from Yahoo.com, we can see that the market cap is a large $38.30 billion. The trailing p/e isn't bad at 20.75, the forward p/e (fye 30-Jan-06) is even nicer at 14.66. The PEG (5 yr expected) is gorgeous at 0.78. (I really like a PEG under 1.0), and Price/sales is reasonable at 1.12.
There are currently 779.63 million shares outstanding with 771.80 million that float according to Yahoo. As of 7/8/04, there were 14.99 million shares out short, representing 4.807 trading days, or 1.94% of the float. I like to use 3.0 trading days as a point of reference, and thus, at least in my opinion, this is a significant number of shares out short, and may contribute to upward buying pressure as we are seeing today on good news.
As noted earlier, the company pays a dividend of $.16/share yielding 0.34%. The last stock split was a 2:1 in July, 2001.
How about Technicals? If we look at a Point and Figure chart from Stockcharts.com:
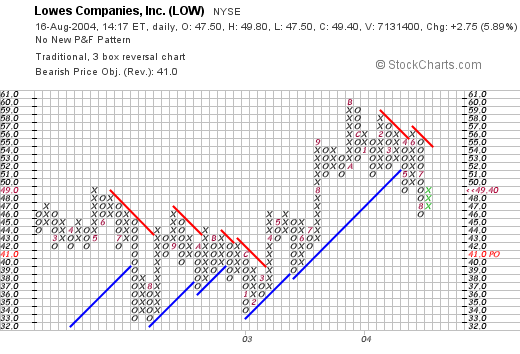
we can see that this chart has actually broken through its support level at around $52 in May, 2004, and has traded lower recently. It may be forming a new support level, but it would be nice to see this get through the $54 level, the current resistance line, to confirm the breakout to new heights. Again, I am not a technician, so please review and be aware of the current graph!
So what do I think? Well, I have never shopped at Lowe's so on a Peter Lynch level, I can't say much. However, the earnings report is good, I especially like today's announcement raising guidance, the Morningstar 5-yr record is beautiful. The free cash flow and balance sheet is very nice. The PEG is under 1.0 and the P/E itself is just over 20.0. Except for the graph, which is reflecting the current market's malaise, everything looks nice for LOW. As you know, I am not in the market to buy ANYTHING until I get a "signal" from my current portfolio telling me to buy. (My signal occurs when a portion of an existing position is sold at a gain!).
Thanks so much for stopping by and visiting. I really do appreciate all of you who visit and especially write, which lets me know about who you guys are and what you all are thinking! If you have any comments or questions, please feel free to email me at bobsadviceforstocks@lycos.com Have a great week everyone!
Bob
Saturday, 14 August 2004
"Looking Back One Year" A review of stock picks from the week of July 28, 2003 (Including July 26, 2003)
Hello Friends! Sorry about missing the "review" last weekend. I was away from my computer and thought it best to take a week off! It didn't really help the market lol but a guy just has to take a break once in awhile! Thanks again for stopping by! If you are new here, and even if you are a return visitor, please remember that I am an amateur investor, so please consult with your professional investment advisors prior to making any investment decisions based on information on this website,
Stock Picks Bob's Advice.

On July 26, 2003, I
posted Zoran (ZRAN) on Stock Picks at $27.28. ZRAN closed at $15.57 on 8/13/04, for a loss of $(11.71) or (42.9)%. (Not a very auspicious start for THAT week!)
On July 27, 2004, ZRAN
announced 2nd quarter 2004 results. Revenues for the quarter came in at $103.7 million, an increase of 132% over the same quarter in 2003. However, under GAAP, the Company reported a net loss of $(6.1) million or $(.14)/share compared with net income of $4.2 million or $.15/share the prior year. This actually is improved from the prior quarter, but as you know if you are a reader of this blog, I am looking for stocks that are PROFITABLE along with growing revenue!

I
posted Quality Systems (QSII) on Stock Picks on 7/28/03 at a price of $30.67. (I also purchased some shares in my
"Trading Account" as well as had my stock club pick up some shares!) QSII closed at $47.92 on 8/13/04 for a gain of $17.25 or 56.2%.
On August 3, 2004,
QSII reported 1st quarter 2005 results. Net revenues were $20.1 million, an increase of 23% over the $16.3 million in revenue last year. Net income was $3.4 million, a 49% over net income of $2.3 million last year in the same quarter. Fully diluted earnings per share came in at $.51/share for the quarter, an increase of 46% over the fully diluted $.35/share earnings recorded last year. These were great results and the stock price reflects this!

Community Health Systems (CYH) was
posted on Stock Picks on 7/29/03 at a price of $19.79. CYH closed at $23.70 on 8/13/04 for a gain of $3.91 or 20.0%.
On July 21, 2004, CYH
announced 2nd quarter 2004 results. Net operating revenues for the quarter ended June 30, 2004, were $813.7 million, a 23.8% increase over the $657.3 million reported in the same quarter last year. Net income jumped 25.6% to $38.4 million or $.37/diluted share, compared to $30.6 million or $.30/diluted share last year. These look like great results to me!
 Coventry Health (CVH) was posted
 on Stock Picks on 7/29/03 at a price of $55.77. CVH split 3:2 in February, 2004, so our effective stock pick price was actually $37.18. CVH closed at $48.87 on 8/13/04 for a gain of $11.69 or 31.4%.
On July 26, 2004, CVH
announced 2nd quarter 2004 results. Operating revenues totaled $1.31 billion for the quarter, up 19% over the 2nd quarter 2003. Earnings came in at $84 million or $.93/share (beating Thomson First Call estimates of $.87), compared to last year's $63.4 million or $.70/share on revenue of $1.1 billion.

On July 30, 2003, I
posted Guitar Center (GTRC) on Stock Picks at $33.26. GTRC closed at $40.75 on 8/13/04 for a gain of $7.49 or 22.5%.
On July 28, 2004, GTRC
announced 2nd quarter 2004 results. Consolidated net sales for the quarter ended June 30, 2004, increased 16.5% to $339.6 million from $291.6 million for the same period last year. Net income for the quarter increased 97.5% to $12.1 million or $.47/diluted share compared with $6.2 million or $.25/diluted share last year. These were indeed great results!

On July 30, 2003, I
posted Charles River Laboratories (CRL) on Stock Picks at $35.60. CRL closed at $41.76 on 8/13/04 for a gain of $6.16 or 17.3%.
On July 28, 2004, CRL
announced 2nd quarter 2004 results. Second quarter net sales were $180.2 million, a 16.7% increase over the $154.4 million reported in the same period last year. Net income for the quarter increased 27.9% to $26.3 million or $.52/diluted share up from $20.6 million or $.42/diluted share last year. Another great quarter for CRL!

On July 31, 2003, I
posted ManTech (MANT) at $24.86. MANT closed at $12.33 on 8/13/04, for a loss of $(12.53) or (50.4)%.
On July 19, 2004, MANT
announced it expected a loss for the 2nd quarter. Subsequently, it also delayed the earnings report. The street does NOT like losses and does NOT like uncertainty. The stock has traded lower!

On July 31, 2003, I
posted Chico's FAS (CHS) on Stock Picks at $27.22. CHS closed at $39.20 on 8/13/04 for a gain of $11.98 or 44%.
On May 27, 2004, CHS
announced 1st quarter 2004 results. Net sales for the quarter ended May 1, 2004, increased 52.0% to $257 million from $169 million for the same quarter last year. Net income was up 52.6% to $36 million, or $.40/share from $23 million or $.27/share last year. Comparable store sales were reported to increase 20.1% for the 13 week period ended May 1, 2004 (in the same earnings report). These were all great numbers, and the stock has appreciated since we listed it last year!

On August 1, 2003, I
posted Alliance Data Systems (ADS) on Stock Picks at $28.45. ADS closed at $36.12 for a gain of $7.67 or 27.0%.
On July 21, 2004, ADS
announced 2nd quarter 2004 results. For the quarter ended June 30, 2004, revenue increased 20% to $300.5 million from $251.0 million for the second quarter 2003. Net income was up 99% to $28 million or $.33/diluted share for the second quarter compared to $14.1 million or $.18/diluted share the prior year. In addition ADS RAISED GUIDANCE (notice the caps!) for 2004. This is a great earnings report and great guidance for this company! My kind of stock. (unfortunately I don't own any!)

Finally, on August 1, 2003, I
posted United Online (UNTD) on Stock Picks at $33.64. UNTD has been one of our WORST performers (!) and closed on 8/13/04 at $9.03/share for a loss of $(24.61) or (73.2)%.
On August 4, 2004, UNTD
reported 2nd quarter 2004 results. Total revenues were $110.6 million, up 39% vs. $79.6 million for the same quarter the prior year. Net income came in at $12.3 million or $.19/share compared to $14.6 million or $.21/share the prior year. However, the stock dropped after they also
trimmed guidance for subscriber-growth for 2004. I always prefer (!) to see POSITIVE guidance in association with great results!
So how did we do for these ten stock selections? We had gains in seven and losses in three for an average gain of 5.19%. O.K. not so spectacular but not bad for a mediocre market this past year! Remember, I suggest selling all losing stocks at 8% loss levels, so this would actually improve our performance, but for the sake of review, I evaluate as if we had a "buy and hold" strategy!
Thanks again for stopping by! If you have any questions, comments, or words of encouragement, please feel free to email me at bobsadviceforstocks@lycos.com . Wishing all of my friends a GREAT WEEKEND!
Bob
Thursday, 12 August 2004
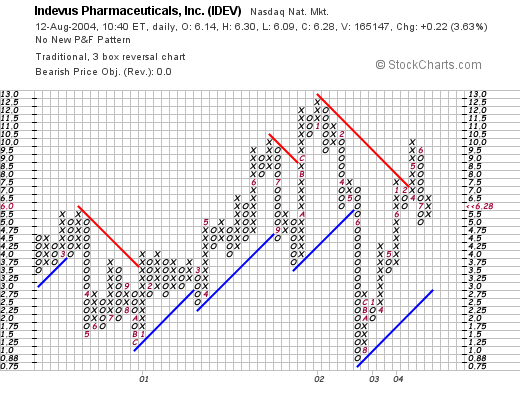
A Reader Writes "What about IDEV"
Hello Friends! Thanks again for stopping by. I received a note from a rather sophisticated reader asking me about my opinion on IDEV. First of all, I am an amateur investor, so please consult with your investment advisors before making any decisions based on information on this website. But let me get to the letter:
Bob D. writes:
Hi Bob:
I just recently came across your site and I like it. I most likely will subscribe.
I guess I'd like a little personal attention beforehand. I'd like to know if you would buy IDEV on 8/12 at the open (or soon after) with just taking into consideration the following factors (to be brief) from my perspective and then your own analysis:
1.) IDEV recvd. FDA approval for Sanctura (a best-in-class drug for a $1.3B market) about a month ago and the stock has pulled back sharply (profit-takers after the run-up before the anticipated approval?). Stock is currently ~$6. Stock traded as high as $10 on the day of approval.
2.) Sanctura officially launches next week. 500 new sales reps, etc.
3.) IDEV revcd. a total of $300M cash infusion from Pliza (a Eurpoean pharma.) in a joint-venture co-op fund for the launch of Sanctura.co-op.
4.) Downtrend seems to be reversing (last 2 days) and I believe the target price is $15. by factoring in a capture of 25% marketshare by the end of 2005. They say the drug is that good against its competition.
5.) Cash position is about $4.50 a share (w/cash infusion).
6.) Dry powder is there doing nothing and this stock seems compelling. The sizzle is there.
Would you please let my know what you think tomorrow morning?
Sincerely & TIA,
Bob DLet's take a look at IDEV.
 align="center">
Well technically, the graph looks nice having broken through its recent resistance level. What about the earnings?
(I do not own any shares of this stock by the way). IDEV currently trading up $.17 or 2.81% on the day at $6.23 in an otherwise weak market. Earnings are to be released on 8/16/04. On May 11, 2004, IDEV announced 2nd quarter 2004 results. They reported a net LOSS of $(11,370,000) or $(.24)/share for the quarter ended March 31, 2004, compared to a net loss of $2.9 million or $(.06)/share the prior year. Not only are they LOSING money, but they are LOSING MORE MONEY than last year. This isn't material for this website. I don't pick stocks that are losing money.
Furthermore, if we look at the "5-Yr Restated" financials on Morningstar.com, we can see that revenue peaked at $27.8 million in 2000, and has dropped to $5.4 million in the trailing twelve months. Again an "F" in my department. I am looking for growing revenues.
Free cash flow has grown increasingly negative from $(2) million in 2001 to $(32) million in the trailing twelve months.
Cash looks o.k. to cover their increasing liabilities for the time being.
What do I think? I think this website is increasing its readership. However, my investing techniques are based on investing discipline, staying with a strategy, using rational methods to assess a stock, and not going with hype or possible future markets. These may be profitable investment techniques for some, but I am looking for a specific type of company with progressive earnings and revenue growth, free cash flow, balance sheet, valuation, technicals and not just a bunch of potential products with a "great story".
Bob, I hope I have not disappointed you in your suggestion, and good-luck to you if you choose to pursue this one....it may turn out to be a "ten-bagger", it is just not my style! Thanks so much for stopping by. If you have any questions, comments, or words of encouragement, please feel free to email me at bobsadviceforstocks@lycos.com
Bob
Newer | Latest | Older


