Stock Picks Bob's Advice
Sunday, 12 November 2006
"Looking Back One Year" A review of stock picks from the week of July 4, 2005

Hello Friends! Thanks so much for stopping by and visiting my blog, Stock Picks Bob's Advice! As always, please remember that I am an amateur investor, so please remember to consult with your professional investment advisers prior to making any investment decisions based on information on this website.
As is my practice, I like to review past stock selections on weekends. I use one week at a time to examine selections and let you know what would have happened if you had invested equal $ amounts in the stocks discussed that week. First of all, to answer a recent question I received, I am reviewing stocks from July, 2005, here in November, 2006, because there have been weekends that I have skipped a review. In fact last weekend was one of those!
In addition, for the sake of analysis, I assume a buy and hold approach to these reviews. In practice, I believe in a very different strategy of selling losing stocks quickly and completely and selling gaining stocks slowly and partially at targeted appreciation points.
 On July 5, 2005, I posted Bausch & Lomb (BOL) on Stock Picks Bob's Advice when it was trading at $87.50. BOL closed at $49.50 on November 10, 2006. This represents a loss of $(38.00) or (43.4)% since posting! This has definitely been one of my poorer stock picks on this blog, emphasizing two things: one, I am truly an amateur and fully capable of making poor picks (!), and two, the importance of limiting losses to small amounts.
 On November 9, 2005, Bausch & Lomb announced 'preliminary' third-quarter 2006 results. The company also according to the report, filed a "Form 12b-25" which means it will be unable to file the 10-Q for the quarter ended September 30, 2006, due to an anticipated restatement and expanded procedures for the financial report.
They reported that the anticipated reporting third quarter net income of $16.1 million for the quarter, down sharply from the $51.5 million reported in the same quarter in 2005. Sales are expected to increase to $577.2 million, compared with sales of $567.3 million in the third quarter of 2005. Much of Bausch & Lomb's problems relate to problems with Renu contact lens solutions with MoistureLoc and possible related fungal infections. This cloud over this stock includes the risk of lawsuits.
Unfortunately fort this blog, the Bausch & Lomb post was the only post for the week of July 5, 2005. Thus, the average performance was a loss of (43.4)% for my selections!
Please drop me a line if you have any comments or questions at bobsadviceforstocks@lycos.com. If you get a chance, drop my Stock Picks Podcast site where I discuss many of the same stocks and topics that I write about on the blog.
Bob
Wednesday, 8 November 2006
Bitstream (BITS)
Hello Friends! Thanks so much for stopping by and visiting my blog, Stock Picks Bob's Advice! As always, please remember that I am an amateur investor, so please remember to consult with your professional investment advisors prior to making any investment decisions based on information on this website.
 I wanted to try to write a brief entry this evening. I have been away from blogging and shall be away for a bit again! However, if I can, I would like to get this stock posted as it deserves a place here on the blog.
Bitstream (BITS) had a great day today, closing at $9.61, up $1.52 or 18.79% on the day. This was enough for the stock to make the list of top % gainers on the NASDAQ. I do not own any shares nor do I have any options on this stock.
According to the Yahoo "Profile" on BITS, this stock
"...together with its subsidiaries, engages in the development and sale of software products in the areas of fonts and font technology, browsing technology, and publishing technology in the United States and internationally."
What drove the stock higher today, was the announcement of 3rd quarter 2006 results, yesterday, after the close of trading. Revenue for the quarter ended September 30, 2006, increased 35% to $5.15 million, from $3.83 million in the same quarter in 2005. Net income for the three months over 200% to $953,000 or $.09/diluted share, up from $312,000 or $.03/diluted share in the previous year same period.
Reviewing the Morningstar.com "5-Yr Restated" financials on BITS, we can see the steady increase in revenue from $8 million in 2001 to $15.7 million in 2005 and $18 million in the trailing twelve months (TTM). Earnings were negative at $(.43)/share in 2001, turned positive at $.11 in 2005 and grew to $.28/share in the TTM.
The number of shares has been fairly stable with 8 million in 2001 and 9 million in the TTM. Free cash flow has been improving with $(2) million in 2003, $0 million in 2004, $1 million in 2005 and $3 million in the TTM.
The balance sheet looks solid with $7.9 million in current assets, enough to pay off the $3.3 million in current liabilities and the $.2 million in long-term liabilities combined. In addition, the company has $2.6 million in other current assets, which yields a current ratio of a bit over 3.
Looking at Yahoo "Key Statistics" on BITS shows us how tiny this company is with a market cap of only $87.70 million. The trailing p/e is shown at 36.54, no PEG is reported, and the Price/Sales is 4.10. There are 9.13 million shares outstanding with 7.4 million that float. As of 10/10/06, there were only 153,300 shares out short representing 2% of the float or 0.6 trading days of volume. No dividends are paid and no stock splits are reported on Yahoo.
Looking at a StockCharts.com "Point & Figure" chart on BITS, we can see that this stock has really gone nowhere between late 2001 until late 2005, when it appeared to start a new move higher in January, 2006, when it moved from $2.50 to $8.00 in March, 2006. The chart appears encouraging to me without appearing ahead of itself.
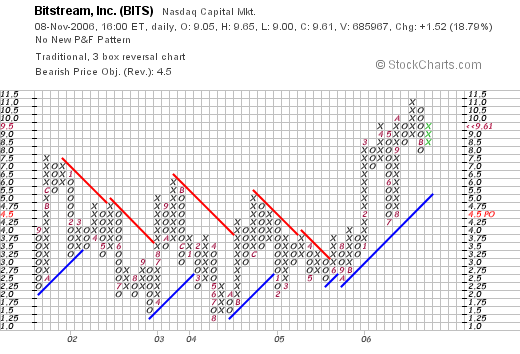
To summarize, Bitstream moved sharply higher today on great news. This is a tiny company, a true 'micro-cap' which shows excellent fundamentals and a great earnings report and an attractive technical picture. Thanks for visiting! If you have any comments or questions, please feel free to drop me a line at bobsadviceforstocks@lycos.com and be sure to visit my Stock Picks Podcast Site (which I also need to update!) where you can listen to me discuss many of the same stocks and ideas on the blog.
Bob
Sunday, 29 October 2006
"Looking Back One Year" A review of stock picks from the week of June 27, 2005
Hello Friends! Thanks so much for stopping by and visiting my blog, Stock Picks Bob's Advice! As always, please remember that I am an amateur investor, so please remember to consult with your professional investment advisors prior to making any investment decisions based on information on this website.
One of my weekend tasks on this blog is to look back a year and review past stock picks and see how they turned out. This analysis assumes an equal dollar purchase of all of the stocks discussed that particular week and a 'buy and hold' approach to investing. In practice, I employ an active management approach, selling losing stocks quickly and completely and slowly selling appreciating stocks partially at targeted gains.
 On June 27, 2005, I posted Quanex (NX) on Stock Picks Bob's Advice when it was trading at $50.75. Quanex split 3:2 on April 3, 2006, making my effective stock pick price actually $33.83. NX closed at $34.12 on October 27, 2006, for a net gain of $.29 or .86% since posting.
 On August 24, 2006, Quanex reported third quarter 2006 results. Net sales in the quarter ended July 31, 2006, came in at $553 million, up 12% from the $492.6 million reported in the year-ago same period. Diluted earnings came in at $1.14, up 1% from $1.13/share the prior year. The company met expectations for earnings, which were expected at $1.13/share and beat expectations for revenue which per Thomson First Call were anticipated to come in at $543.9 million.
 On June 29, 2005, I "revisited" Millipore (MIL) which was trading at $50.87 at that time. MIL closed at $63.77 on October 27, 2006, for a gain of $12.90 or 25.4% since posting.
On July 26, 2006, Millipore (MIL) reported 2nd quarter 2006 results for the quarter ended July 1, 2006. Revenues for the quarter increased 12% to $273.8 million from $245 million in the year-earlier same period. Net income worked out to $29.1 million or $.54/share, up from $24.0 million or $.47/share in the second quarter of 2005.
So how did I do on these two stocks picked on the week of June 27, 2005? One stock was flat and the other performed strongly for an average gain of 13.13% since posting!
Thanks so much for visiting! If you have any comments or questions, please feel free to leave them on the blog or email me at bobsadviceforstocks@lycos.com. Also, if you get a chance, please drop by and visit my Stock Picks Podcast Site where I you can get a chance to listen to me discuss many of the same stocks and strategies discussed on this blog.
Have a great week Investing!
Bob
A Reader Writes "Hittite Microwave...I just can't figure out why!"
Hello Friends! Thanks so much for stopping by and visiting my blog, Stock Picks Bob's Advice! As always please remember that I am an amateur investor, so please remember to consult with your professional investment advisors prior to making any investment decisions based on information on this website.
 I haven't been very busy writing about individual stocks this week. Some weeks I seem to be able to find time to write easier than others. But I did want to get to this letter that I received Friday from Diego who writes:
"Hi Bob,
I was browsing stocks a couple of days ago and I stumbled accross
Hittite Microwave (HITT). The company has a strong financial base,
earnings have been increasing, it hit 52-week high just a few days ago.
Then yesterday the company released Q3 report with 132.2% EPS increase
and 63.5% increase in sales compared to 2005, beating analysts'
expectations. Yet in the last 2 days, the stock plummeted around 20% and
I just can't figure out why! I'm a newbie investor and I was hoping you
could shed some light on the issue. Thankfully I didn't actually buy the
stock, but it still boggles my mind that it went down like that.
Thanks and good luck :-) Diego"
First of all, thank you so much for writing Diego! Your question is good and I do not know if I have any answers to it. Personally, I do not have any shares of Hittite (HITT). But let me take a look at Hittite (HITT) and the earnings report, and see if I can unearth any news that might help explain this appearingly-paradoxical behavior of the stock after the announcement of what seems like outstanding earnings.
First of all, as you correctly noted, Hittite (HITT) announced 3rd quarter earnings on Thursday, October 26, 2006 at 4 pm. (The time is important because it was after the close of trading on Wednesday, giving investors Friday, as the earliest time to respond to this in regular trading hours.)
Certainly results appear to be nothing less than outstanding on first glance. Revenue came in at $34.6 million for the quarter ended September 30, 2006, representing a 63.5% increase over the $21.2 million for the third quarter of 2005. This also was a 7% increase over the prior quarter's $32.4 million in revenue. It is nice to see sequential as well as 'year-over-year' strong results. Net income worked out to $11.6 million or $.37/diluted share, up 132.2% from the $5.0 million or $.17/diluted share the prior year. This was also a sequential 13.6% increase over the $10.2 million or $.33/share for the immediately preceding quarter. Again, showing strong results both year-over-year and sequentially!
Ironically, the strength of this report is increased, in my perspective, by the way the company beat expectations. As noted by Marketwatch.com, Thomson First Call analysts had been expecting earnings of $.34/share, (the company came in at $.37), and analysts were expecting revenue of $31.8 million (the company came in at $34.6 million). So even with the fact that beating current expectations usually finds a company's stock rising, this stock declined!
Perhaps what led to the market response was the section in the earnings report called "Business Outlook". As was reported in the same earnings report:
"The company currently expects revenue for the fourth quarter ending December 31, 2006 to be in the range of $34.0 million to $35.0 million and net income to be in the range of $10.4 million to $10.8 million, or $0.33 to $0.34 per diluted share, including equity-based compensation expense."
Thus, you will see that in spite of the outstanding quarterly report from Hittite, they were indicating that they expected the next quarter to show revenue of $34.0 to $35.0 million, essentially flat with the current quarter which came in at $34.6 million, and net income of $10.4 million to $10.8 million, which is below the current quarter's $11.6 million! On a per share basis, this worked out to $33 to $.34/diluted share, again below the current quarter of $.37/share. I suspect that after many quarters of increasing revenue and earnings, that the prospect of a slow-down, no matter how mild, must have spooked some investors to sell their shares in the face of what appeared to be incredibly strong results. Remember that stock price performance is about expectations as much as reality!
Other news that might be impacting this stock was a downgrade by Needham & Co. the week earlier from "Buy" to "Hold". In many circles, a "Hold" rating is synonymous with a 'sell' call, as many brokerage houses hesitate to actually indicate a 'sell' recommendation. Needham reported:
"We believe the market has already priced in large upsides for the second half of the year, at the same time end customers tend to slow orders exiting the year," Glavin wrote in a note to clients.
I suspect that the confirmation of a slow-down by the company itself was more or less the proverbial 'second shoe to fall' confirming what the analyst had been predicting.
I found an interesting article from the NASD website about these "hold" ratings. They point out:
Clear "Sell" ratings have grown rare. Some firms no longer even use "Sell" or any word obviously like it. Frequently, a "Hold" rating in effect means "Sell."
Thus, this was another negative warning about the stock.
A report on the Street.com confirms my assessment, as they noted:
"Looking ahead, Hittite Microwave said it expects fourth-quarter income in the range of $10.4 million to $10.8 million, or 33 cents to 34 cents a share, including equity-based compensation expense. Revenue is expected to range from $34 million to $35 million. Wall Street is looking for earnings of 34 cents a share on revenue of $35.8 million. Shares were falling $4.37, or 10.2%, to $38.30."
I cannot over-emphasize the effect of 'expectations' on stock price performance. Sometimes I write about all of these calculators readjusting future results based on a single announcement. These are imaginary calculations going on but I suspect they are very real! Morningstar.com has a nice comment about the role of expectations and how stock price performance can rapidly be affected by news that changes what people expect:
"Earnings estimates made by Wall Street analysts are important to the prices of your stocks. Each quarter, companies try to exceed the estimates that analysts have made. If companies exceed expectations, they're usually rewarded with a pop up in their stock price. If companies fall short of expectations--or sometimes if they only meet expectations--their stock prices can take a beating."
I hope that answers your question! You will note that my 'selection system' in looking at stocks starts out with a stock moving strongly higher. My next stop in looking at a stock is the latest quarterly report and then a longer-term view at the Morningstar figures. Thus, I don't start with the earnings numbers, but after identifying a stock with positive price momentum, I examine the earnings. Not the other way around.
The other point is to diversify one's portfolio with more than one or two stocks. To recognize that even with the best of analysis and homework, one is bound to make mistakes and that I urge, and employ, a disciplined system that requires sales of stocks when my own calculations and investigations are proved to be wrong.
Thanks again for writing! If you or anyone else have comments or questions, please feel free to drop me a line at bobsadviceforstocks@lycos.com or just leave your comments on the blog itself. If you get a chance, drop by and visit my Stock Picks Podcast Website where you can listen to me discuss many of the same stocks and issues I write about here on the blog.
Bob
Tuesday, 24 October 2006
"Trading Transparency" Precision Castparts (PCP)
Hello Friends! Thanks so much for stopping by and visiting my blog, Stock Picks Bob's Advice! As always, please remember that I am an amateur investor, so please remember to consult with your professional investment advisors prior to making any investment decisions based on information on this website.
Earlier today I sold a portion of my Coach (COH) stock at a gain of just over 360% since purchasing. This sale at a gain amounts to a "buy signal" for me in my portfolio management system. This is significant as my last "buy signal" purchase was a buy of 120 shares of Toro (TTC) on 5/25/06. Anyhow, with the signal in hand, and my nickel burning a hole in my pocket, I scanned the list of top % gainers on the NYSE, and noted that Precision Castparts (PCP), a stock that I have looked at just last month on this blog, was moving strongly higher. In fact, as I write, the stock is trading at $68.97, up $3.79 or 5.81% on the day. A few moments ago, I purchased 120 shares of PCP at $68.96.
Thanks so much for stopping by and visiting my blog! If you have any comments or questions, please feel free to drop me a line at bobsadviceforstocks@lycos.com or leave your comments right on the blog! Also, be sure to stop by and visit my Stock Picks Podcast Site!
Bob
"Trading Transparency" Coach (COH)
Hello Friends! Thanks so much for stopping by and visiting my blog, Stock Picks Bob's Advice! As always, please remember that I am an amateur investor, so please remember to consult with your professional investment advisors prior to making any investment decisions based on information on this website.
Earlier today, my 102 shares of Coach (COH) hit a targeted appreciation point and I sold 1/6th of my holdings. This worked out to 17 shares which were sold at a price of $38.73. This leaves 85 shares of Coach in my trading portfolio. These shares were acquired 2/25/03 with a cost basis of $8.33/share. Thus, I had a gain of $30.40 or 364.9% since my purchase of these shares. This was my eighth (!) partial sale of this position, having sold shares at 30, 60, 90, 120, 180, 240, and 300% gain targets. My next sale on the upside would be at a 450% appreciation level or 5.5 x $8.33 = $45.82, or on the downside if the stock retreats to 1/2 of my highest appreciation sale or at a 225% gain: 3.25 x $8.33 = $27.07.
In any case, a sale at a gain is a signal for me to purchase a new position. That is, since I am below my maximum number of positions, currently I am at 10 positions, I have a "permission slip" to identify a new investment and add it to my portfolio.
That nickel is burning a hole in my pocket already! Thanks again for stopping by and visiting! If you have any comments or questions, please feel free to email me at bobsadviceforstocks@lycos.com or just go ahead and leave a comment on the blog. And if you get a chance, please drop by and visit my Stock Picks Podcast Site where you can listen to me discuss many of the stocks and strategies I write about here on the blog.
Bob
Sunday, 22 October 2006
A Reader Writes "Why would you calculate FCF to exclude....?"
Hello Friends! Thanks so much for stopping by and visiting my blog, Stock Picks Bob's Advice! As always, please remember that I am an amateur investor, so please remember to consult with your professional investment advisors prior to making any investment decisions based on information on this website.
This evening I received an interesting email from Matt R. who wrote me regarding my comments on CVS. I would like to answer his question as well as I am able, but would invite other readers, especially accounting people, who might be able to address his question in a bit more knowledgeable fashion.
Matt wrote:
"Hey Bob, stumbled across your blog today. Great information! Thanks for doing what you do.
Have a question for you...in your posting on 10/11/06 re CVS, you made the following statement....
"Free cash flow, which was negative at $(153) million in 2003, and $(434) million in 2004, turned positive at $117 million in 2005 and higher yet at $308 million in the TTM."
Why would you calculate FCF to exclude CVS's proceeds from their Sale-Leaseback transaction and also exclude dividends paid?
My calc for 2003 yields....
968.9 - 1,121.7 + 487.8 - 105.2 = +229.8
Are proceeds from the Sale-Leaseback not traditionally included in Net Capital Investments?
Thanks,
-Matt"
First of all Matt, thanks so much for writing! My numbers are not calculations that I have derived.
My number for Free Cash Flow (FCF) is from the
Morningstar.com "5-Yr Restated" financials page. On that page, which I have just linked to, you will see that Morningstar reports that CVS had $969 million in operating cash flow. From this, they report $1,122 million in Capital Spending which they subtracted from the operating cash flow resulting in a negative $(153) million. Up to this point, you and Morningstar.com are in agreement. After that you added in (apparently) the proceeds from the Sale-Leaseback and subtracted the dividend payments with the resultant free cash flow as you calculated it coming in at a positive $229.8 million. Quite frankly, I am not sophisticated enough in these matters to give you an opinion. But let's see what we can find.
Apparently there are no good defined rules for treatment of sales-leaseback arrangements in terms of free cash flow analysis.
Companies have the choice of treating these proceeds as either "cash from investing" or as "cash from financing".
"The research, conducted by the Financial Analysis Lab at the Georgia Institute of Technology, looked at 37 nonfinancial public companies that entered into operating leases through large sale-leaseback transactions over the last six years. booked Thirty of the companies booked the sale proceeds as cash from investing, while just seven reported the sale proceeds as cash from financing activities.That's understandable, since companies that book the deals as cash from investing can include the proceeds in their free-cash-flow calculations. Companies that account for the deals as cash from financing can't do that.
The problem is that the choice of investing-cash treatment for sale-leasebacks can distort the reporting of free cash flow. For companies that used the cash-from-investing treatment, study co-author and lab director Charles Mulford subtracted the sale proceeds from free cash flow. The adjustment caused significant decreases; for example, companies such as AMC Entertainment, Carmax Inc., and CVS Corp. dropped from a positive to a negative free cash flow."
The article continues:
"Companies that view a sale-leaseback as an investing event — interpreting the transaction as generating funds from the sale of property or equipment — take that double benefit. They book the asset disposition as a straight asset sale, and therefore add the sale proceeds into their free-cash-flow calculation.
Companies that view a leaseback deal as a financing event, however, interpret the transaction solely as generating funds, not disposing of an asset, and don't include the proceeds in their free-cash-flow calculation.
The blame for the reporting disparity doesn't fall on companies, according to Mulford and his co-author, Amit Patel, a graduate research assistant at Georgia Tech's College of Management. Rather, it's unclear under GAAP how to account for sales proceeds arising from sales-leaseback transactions that involve operating leases, according to their report."
Thus, I believe that Morningstar.com apparently must attribute this cash as being from a financing activity and not as from an investment. Please correct me if I am wrong, but I believe you are getting into a current accounting controversy that is over my head.
You also asked about the role of dividends in the calculation of free cash flow. Since I am not an accountant, I needed to do a little bit of work. You suggested that they should be subtracted from the FCF figure, but I found another article that suggests that this is not standard treatment. The article explains:
"Some analysts refer to free cash flow (FCF) as a basis for measuring a company's ability to meet continuing capital requirements. Others argue that FCF should represent the cash available after meeting all current commitments, that is, required payments made to continue operations (including dividends, current debt repayment, and regular capital reinvestment to maintain current operating activities). Still others argue that FCF should represent the cash available after meeting operating expenses, including working capital additions and the cost of maintaining operating assets. This approach defines FCF as "CFO minus capital maintenance expenditures." International Accounting Standard (IAS) 7 recommends that FCF should be recognized as "cash from operations less the amount of capital expenditures required to maintain the firm's present productive capacity." Using this description, dividends and mandatory debt payments would not be subtracted to arrive at FCF. Thus, using this description, discretionary cash expenditures would include growth-oriented capital expenditures and acquisitions, debt reduction, dividends, and stock repurchases."
Thank you so much for writing! Your question has given me the opportunity to try to understand the numbers that I share with readers so easily yet without as much of an understanding of the methodology involved. Please let me know if this addresses your concerns about the free cash flow calculations!
If you have any other questions or comments, please feel free to leave them on the blog or email me at bobsadviceforstocks@lycos.com. Also, be sure and visit my Stock Picks Podcast Site where I talk about many of the same stocks I write about here on the blog! Have a great week in the market!
Bob
"Looking Back One Year" A review of stock picks from the week of June 20, 2005
Hello Friends! Thanks so much for stopping by and visiting my blog, Stock Picks Bob's Advice! As always, please remember that I am an amateur investor, so please remember to consult with your professional investment advisors prior to making any investment decisions based on information on this website.
It is the weekend (at least for a few more hours!) and it is time for my weekend review! If you are a regular reader of this blog, you may know that I try to re-examine past stock picks on a regular basis to find out how they turned out and if they are still worthy of inclusion on this blog.
This review assumes a "buy and hold" strategy, while in fact, I employ a disciplined portfolio management approach, selling my losers quickly and completely and selling my gaining stocks slowly and partially at targeted appreciation points. This difference in strategy would certainly affect performance. However, for the ease of evaluation, I assume that I purchased equal dollar amounts of each stock discussed during the week I wrote them up. Most of the stocks I discuss I have never owned. Some, however, have been and continue to be part of my investment portfolio. I try very hard to make sure that I have let you know whether I own each of the stocks discussed.

On June 20, 2005, I posted Molecular Devices (MDCC) on Stock Picks Bob's Advice when it was trading at $21.20. MDCC closed at $19.03 on October 20, 2006, for a loss of $(2.17) or (10.2)% since posting.
Molecular Devices reported 2nd quarter earnings on July 20, 2006. The company reported a net loss of $(458,000) or $(.03)/share on revenue of $47.3 million. In the prior year the company had net earnings of $3.7 million or $.21/share. More recently, the company announced lower guidance for the third-quarter, with earnings of $.12 to $.17/share on revenue of $44 to $46 million. Analysts had been expecting earnings of $.29/share according to Thomson First Call. On July 20, 2006, the company had announced guidance of $.22 to $.26/share on revenue of $48 to $52 million. If raised guidance is bullish for a stock, it is a bearish event when the company reduces guidance!
 On June 21, 2005, I posted Somanetics (SMTS) on Stock Picks Bob's Advice when it was trading at $22.25. SMTS closed at $21.97 on October 20, 2006, for a loss of $(.28) or (1.3)% since posting.
On September 18, 2006, Somanetics announced 3rd quarter 2006 results. Revenue for the quarter increased 50% to $7.9 million from the $5.2 million reported in the same quarter in 2005. Net income increased to $1.9 million or $.13/diluted share, up from $994,147 or $.08/share in the same period a year earlier. In the same earnings report the company raised guidance to $.47 to $.49/share from previous guidance of $.40 to $.42/diluted share for fiscal 2006.
So how did I do with these two stock picks from last year? In a word, mediocre. For these two stocks, I had an average loss of (5.75)%.
Thanks again for stopping by! If you have any comments or questions, please feel free to email me at bobsadviceforstocks@lycos.com or leave your words right on the blog. Also, be sure to stop by and visit my Stock Picks Podcast Site where you can hear me talk about many of the same stocks I write about! Wishing you all a profitable week in the market!
Bob
Thursday, 19 October 2006
Alliance Data Systems (ADS) "Revisiting a Stock Pick"
Hello Friends! Thanks so much for stopping by and visiting my blog, Stock Picks Bob's Advice! As always, please remember that I am an amateur investor, so please remember to consult with your professional investment advisors prior to making any investment decisions based on information on this website.
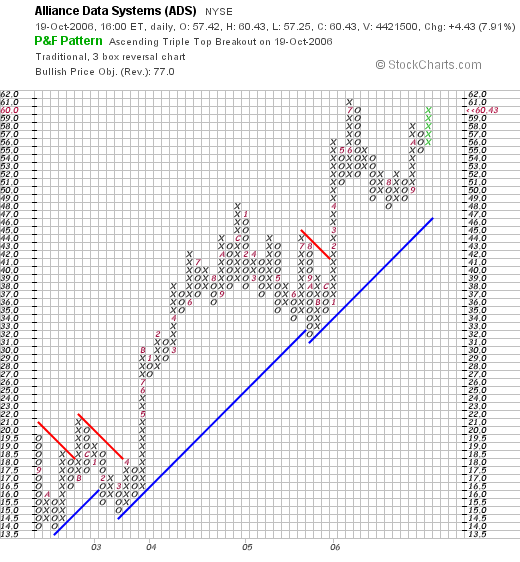
 I was looking through the list of top % gainers on the NYSE and came across an old favorite of mine, Alliance Data Systems (ADS) which had a nice move higher today, closing at $60.43, up $4.43 or 7.91% on the day. I first reviewed ADS on Stock Picks Bob's Advice on August 1, 2003, when the stock was trading at $28.45. Today's close works out to a gain of $31.98 or 112.4% since my first posting.
I "revisited" Alliance on January 29, 2004, when the stock was trading at $29.50. I also took another look at ADS and also took a position in the stock on June 16, 2005, when ADS was trading at $39.00. I sold these shares on October 25, 2005, after taking a small loss on this investment. This is one stock that unfortunately I didn't manage to hang onto, as the stock has moved significantly higher since my sale. However, I do believe the stock deserves to be in this blog, and I would like to take another look at this company with today's large move to the upside.
1. What exactly does this company do?
According to the Yahoo "Profile" on ADS, this company
"...and its subsidiaries provide transaction services, credit services, and marketing services in North America. The company facilitates and manages interactions between its clients and customers through multiple distribution channels, including instore, catalog, and online. Its transaction services comprise issuer services, such as card processing, billing and payment processing, and customer care; utility services consisting of customer information system hosting, customer care, and billing and payment processing; and merchant services, such as point-of-sale services and merchant bankcard services."
2. Was there any news to explain today's move higher?
Shares rose today after the company reported strong earnings yesterday after the close of trading.
3. How did they do in the latest reported quarter?
As I noted above, yesterday, October 18, 2006, the company reported 3rd quarter 2006 results. For the third quarter ended September 30, 2006, total revenue increased 32% to $506.6 million, up from $384.8 million in the same quarter the prior year. Net income increased 36% to $48.8 million in the quarter compared with $35.9 million in the same quarter last year. On a diluted per share basis this worked out to $.60/share, up 43% from $.48/share the prior year. In the same announcement, the company raised guidance for 2006 cash earnings/share to $3.00 to $3.05. The company also guided for 2007 with revenue expected to be at $2.1 billion, and earnings per share of "at least $3.50" peer diluted share.
As was reported on TheStreet.com, this 'cash-basis results' of $.81/share beat the expected $.67/share. The 2007 guidance was also ahead of Wall Street's forecast of $3.32/share in earnings on revenue of $2.14 billion.
Thus, the company managed to come in with what I call a "trifecta-plus" in a quarterly report: increased revenue, increased earnings, exceeding expectations, and raising guidance! The stock price responded accordingly!
4. What about longer-term financial results?
Reviewing the Morningstar.com "5-Yr Restated" financials on ADS, we find that revenue has been steadily increasing with $770 million in 2001 increasing to $1.5 billion in 2005 and $1.77 billion in the trailing twelve months (TTM).
Earnings have also steadily increased with $.31/share reported in 2002, increasing to $1.64/share in 2005 and $2.04 in the TTM.
The company has modestly increased its shares outstanding from 74 million in 2002 to 82 million in 2005, but has retired shares since with only 80 million shares reported outstanding in the TTM. No dividend is reported.
Free cash flow has been erratic with $70 million reported in 2003, $300 million in 2004, $43 million in 2005 and $133 million in the TTM.
The balance sheet is adequate if not overwhelming. The company is reported to have $151 million in cash, and $764.7 million in other current assets for a total of $915.7 million in total current assets. When compared to the $594.5 million in current liabilities this yields a current ratio of 1.54. In addition, the company has a significant $1.29 billion in long-term liabilities.
5. How about some valuation numbers on this stock?
Reviewing the Yahoo "Key Statistics" on ADS, we find that this is a large mid-cap stock with a market capitalization of $4.84 billion. The trailing p/e is a moderate 29.67 with a forward p/e (fye 31-Dec-07) of 18.20. With rapid growth expected over the next 5 years, the PEG works out to a very reasonable 1.07.
Checking the Fidelity.com eresearch website, we can see that this company is in the "Credit Services" industrial group. Within this group, ADS is reasonably priced with a Price/Sales ratio of 2.6. Leading this group is CapitalSource (CSE) with a ratio of 5. This is followed by American Express (AXP) at 2.8 and Alliance Data (ADS) at 2.6. Capital One Financial (COF) is at 1.8 and Fannie Mae comes in at 1.1.
Insofar as Return on Equity (ROE) is concerned, ADS is in the middle of the group with a ROE of 17.4%. Topping this group is Fannie Mae at 43.7%, American Express at 33.4%, then Alliance Data at 17.4%, Capital One Financial at 15.7% and CapitalSource (CSE) coming in at 14.2%.
Extracting some additional information from Yahoo, we can see that there are 80.11 million shares outstanding with 64.89 million that float. As of 9/12/06, there were 4.22 million shares out short representing 5.4% of the float or 5.8 trading days of volume. Using my "3 day rule" for the short ratio, this 5.8 days of short interest appears significant. Indeed, today's share move higher might well represent, at least in part, some of the short-sellers scrambline to limit their losses by purchasing shares of their pre-sold stocks. No cash dividend is paid and no stock splits are reported on Yahoo.
6. What does the chart look like?
If we review a "Point & Figure" chart on ADS from StockCharts.com, we can see a really gorgeous chart with the stock, which was trading between $14 and $21 in late 2002, moving to the $48 level in December, 2004, before pulling back to a $32 level. The stock moved higher since then and appears to be on the upswing as I write.
7. Summary: What do I think about this stock?
Let's take a look at a few of the points I reviewed in this post. First of all the stock moved strongly higher today on the back of an outstanding earnings report with both revenue and earnings increasing in the mid-30% range! The earnings exceeded expectations, and the company raised guidance for the 2006 full year and established strong 2007 earnings guidance.
The Morningstar.com report is also strong with a very steady record of growing revenue and earnings with a slowly increasing number of shares. Free cash flow, while a bit erratic, is strongly positive. Finally, the balance sheet is adequate with sufficient current assets to cover current liabilities. However, the company does have a sizeable long-term debt level.
Valuation-wise, the p/e isn't too rich and the PEG is great---just over 1.0. Both Price/Sales and ROE ratios are average and shouldn't keep the stock price back nor shall they cause great demand lifting shares. Helping keep the stock moving higher is a significant level of short interest. Finally, the stock chart looks strong with a steady increase in price the past three years.
In conclusion, I like this stock enough to have written it up virtually every year this blog has been in existence! In many ways, this stock exemplifies many of the factors that I find attractive in picking stocks. This stock deserves to be in the investing vocabulary of this blog!
Thanks so much for stopping by and visiting. If you have any comments or questions please feel free to leave them on the blog or email me at bobsadviceforstocks@lycos.com. Also, be sure and visit my Stock Picks Podcast Site!
Bob
Monday, 16 October 2006
Angeion Corp. (ANGN)
CLICK HERE FOR MY PODCAST ON ANGEION! Hello Friends! Thanks so much for stopping by and visiting my blog, Stock Picks Bob's Advice! As always, please remember that I am an amateur investor, so please remember to consult with your professional investment advisors prior to making any investment decisions based on information on this website.
 This afternoon, while looking through the list of top % gainers on the NASDAQ I came across Angeion (ANGN) which appears to fit most of the criteria that I use to pick a stock for this blog. I do not own any shares of Angeion nor do I have any options on this stock. ANGN closed at $10.75, up $1.18 or 12.33% on the day. Let's take a closer look at this stock and I shall show you why I think it deserves a spot here!
1. What exactly does this company do?
 According to the Yahoo "Profile" on Angeion, this company
"...through its subsidiary, Medical Graphics Corporation, engages in the development, manufacture, and marketing of noninvasive cardio-respiratory diagnostic systems used in the management and improvement of cardio-respiratory health."
and
"It also sells health and fitness products through health and fitness clubs, personal training studios, weight loss centers, and other retail outlets."
2. Was there any news to explain today's move higher?
I did not see any news from Yahoo or on the Company's website to explain any interest in the stock today.
3. How did the company do in the latest reported quarter?
On September 11, 2006, Angeion reported third quarter 2006 results. For the quarter ended July 31, 2006, revenue came in at $8.8 million, up 45.2% over the same quarter in 2005. Net income came in at $655,000 or $.17/diluted share compared with a net loss of $(268,000) or $(.07)/diluted share last year.
4. What about longer-term financial results?
Reviewing the Morningstar.com "5-Yr Restated" financials on ANGN, except for a dip between 2000 and 2001 when revenue dropped from $17.1 million to $16.7 million, the company has been steadily growing its revenue with $24 million reported in 2005 and $30 million in the trailing twelve months (TTM).
Earnings have improved from a loss of $(1.86)/share in 2001 down to a loss of $(.25)/share in 2005. The company turned profitable in the TTM with $.41/share reported. The company has kept its 4 million shares outstanding stable from 2001 to the latest report.
Free cash flow, which has been negative at $(1) million in 2003-2005, turned positive with $2 million reported in the TTM.
Insofar as the balance sheet is concerned, this appears solid to me with $2.5 million in cash and $11.9 million in other current assets. When compared to the $6.1 million in current liabilities, this yields a current ratio of 2.36. In addition, the company has $1.1 million in long-term liabilities which could easily be covered by the $14.4 million in total current assets.
5. How about some valuation numbers on this stock?
Examining the Yahoo "Key Statistics" on ANGN, we find that this is a tiny stock with a market capitalization of only $39.02 million. Generally, stocks with market caps under $50 million are considered Nano-Cap stocks. The trailing p/e appears to be a reasonable 26.41. No forward p/e and no PEG ratio is found on the Yahoo site. Probably because the company is too small to have many analysts following the stock.
Reviewing the Fidelity.com eresearch website, we can see that Angeion is in the "Medical Instruments/Supplies" industrial group. Within this group, Angeion appears very reasonably valued with the lowest Price/Sales ratio in the group at 0.1. Leading this group is Boston Scientific (BSX) at 2.9, followed by Baxter International (BAX) at 1.4, Becton Dickinson (BDX) and Cytyc (CYTC) at 1.0, and Stryker (SYK) at 0.6. Angeion is at the bottom of the list at 0.1.
Insofar as profitability is concerned, as measured by return on equity (ROE), Angeion looks less impressive with a ROE of 10.2%. Leading this group is Becton Dickinson at 20.4%, Cytyc at 20.1%, Stryker at 19.9%, Baxter at 19.7% and Angeion at 10.2%. At the bottom of the group is Boston Scientific with a ROE of (55.7)%.
Finishing up with Yahoo, we find that the company has only 3.63 million shares outstanding with 3.61 million that float. As of 9/12/06, there were only 168,170 shares out short, representing 4.70% of the float or 0.7 trading days of volume (the short ratio). No dividend is paid and no stock splits are reported.
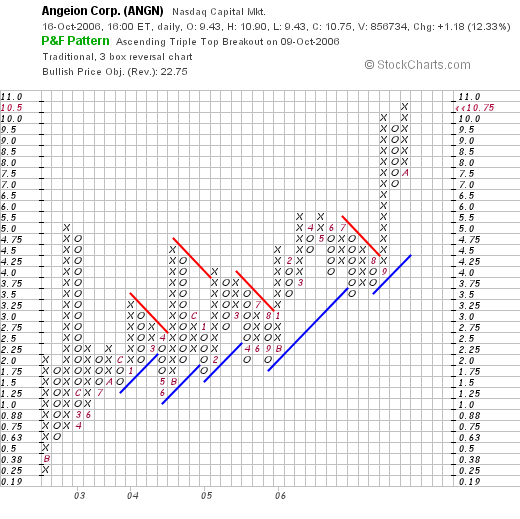
6. What does the chart look like?
Reviewing the Angeion "Point & Figure" chart from StockCharts.com, we can see what appears to be a very strong chart with the company climbing $.25/share in July, 2002, to the recent level of $4.00 in September, 2006. The company's stock broke out to the upside, more than doubling to its current level of $10.75. The chart looks surprisingly strong to me!
7. Summary: What do I think about this stock?
Let's review some of the things I discussed in this entry. First of all, the company had a very nice move higher today. It is just barely over $10 so price-wise it is near my limit of purchaseable stocks. The last quarter was strong with steady revenue and earnings growth. Perhaps more significantly, the company completed its steady stream of improving results, finally moving from a loss to a profitable position. Looking back over the past several years, the company has steadily been growing its revenue and improving its earnings results. The company also has reduced its negative free cash flow and turned positive. The balance sheet is solid.
Valuation-wise, the p/e is just in the mid-20's. The Price/Sales ratio is the lowest in its group at 0.1. And the ROE is fair...which isn't bad considering the company is just turning profitable. Finally the chart looks very strong with steady price improvement over the past four years.
Frankly, except for the fact that this is a company with a market cap under $50 million, I like this stock just fine. If I were in the market to be buying a stock, this is the kind of company I would be buying. I suspect that the company may well show price volatility, and after its huge recent upswing may be at risk for a correction. Just a thought I guess :).
Thanks again for stopping by and visiting! If you have any comments or questions, please feel free to email me at bobsadviceforstocks@lycos.com. Please also feel free to visit my Stock Picks Podcast Site where I discuss many of the same stocks I write about here on the blog.
Bob
Posted by bobsadviceforstocks at 9:43 PM CDT
|
Post Comment |
Permalink
Updated: Monday, 16 October 2006 10:38 PM CDT
Newer | Latest | Older


