Stock Picks Bob's Advice
Thursday, 1 September 2005
"Trading Transparency" Giant Industries (GI)
Hello friends! Thanks so much for stopping by and visiting my blog,
Stock Picks Bob's Advice. As always, please remember that I am an amateur investor, so please consult with your professional investment advisors prior to making any investment decisions based on information on this website.
As you may note from the previous post, I sold a portion of my Meridian Bioscience (VIVO) at a 60% gain level. This "entitled" me to add a position, considering I am at 24, under my 25 goal, and I set to work scanning the lists of top % gainers.
Noticing that Giant Industries (GI) was doing quite well today, in fact trading at $53.02, up $3.77 or 7.65% on the day, and that I had just discussed the stock on stock picks, knowing it met my criteria, I jumped in and purchased 160 shares at $53.15 a few moments ago.
So much for that nickel in my pocket :). I always seem to find something to do with it!
Thanks again for stopping by. If you have any comments or questions please feel free to leave them on the blog or email me at bobsadviceforstocks@lycos.com.
Bob
"Trading Transparency" VIVO
Hello Friends! Thanks so much for stopping by and visiting my blog,
Stock Picks Bob's Advice. As always, please remember that I am an amateur investor, so please consult with your professional investment advisors prior to making any investment decisions based on information on this website.
A few moments ago, my shares of Meridian Bioscience (VIVO) hit a sale point on the upside and I sold 75 shares, 1/4 of my position of 300 shares I currently held, at the 60% gain point. The exact sale was 75 shares at $27.70. These shares were purchased 4/21/05 with a cost basis of $16.67, so this was a gain of $11.03 or 66.2% on the upside.
As you probably know, I like to sell my losers quickly if they hit an 8% loss. I sell my gainers slowly, and partially, trying to sell 1/4 of my holdings at 30%, 60%, 90%, 120%, 180%, 240%...etc. gain points.
Also, if I am under 25 positions (my goal), this "entitles" me to add a position. Thus, the nickel is burning a hole in my pocket already. I shall be scanning the top % gainers to see if there are any candidates there today that I find interesting.
I shall keep you posted! Please leave a message on the blog or email me at bobsadviceforstocks@lycos.com if you have any comments, or questions.
Bob
Wednesday, 31 August 2005
August 31, 2005 Building Materials Holding (BMHC)
Hello Friends! Thanks so much for stopping by and visiting my blog,
Stock Picks Bob's Advice. As always, please remember that I am an amateur investor, so please remember to consult with your professional investment advisors prior to making any investment decisions based on information on this website.
Before writing anything about stocks today, let me take the time to express my personal sympathy to all of you who might have lost friends, family, property, or your way of life in the disaster called the Katrina hurricane. My wife's family is from New Orleans. Her parents got out but likely lost their home. We are still waiting to hear whether her brother, who stayed due to medical problems, is alive and well. Please keep him in your prayers.New Orleans shall return, the water shall be drained, and there will be more Mardi Gras parades, beignets, and Crawfish etouffee. But it shall be a difficult time for many people.
Let us remember the positive things about New Orleans and work to generate a new enthusiasm that will bring businesses, tourists, and conventioneers once again to the tourist destination of America.
Here is a picture from
Cafe Du Monde, one of my favorite places to get beignets and cafe du lait. We shall all be visiting once again, hopefully in the not too distant future, dusting off our over-powdered-sugared doughnuts from our clothes!

 Back to stocks! It seems that many of the stocks moving higher today included building materials and roofers including lumber and cement. On today's list of top % gainers of the NASDAQ was Building Materials Holding Corporation (BMHC) which closed at $93.48, up $11.68 or 14.28% on the day. I do not own any shares or options in this stock.
On July 26, 2005, BMHC announced 2nd quarter 2005 results
 For the quarter ended June 30, 2005, sales increased 33% to $1.27 billion, compared to $.96 billion in the prior year same quarter. Net income was $33.3 million or $2.28/share up from $12.6 million or $.92/share last year.
Looking a bit longer-term at the Morningstar.com "5-Yr Restated" financials, we can see a nice picture of revenue growth from $1.0 billion in 2000 to $2.4 billion in the trailing twelve months (TTM).
Earnings during this period have been a bit erratic, dropping to $.53/share in 2002, but have increased steadily since that time to $6.39/share in the TTM.
BMHC started paying dividends in 2002 when $.05/share was paid. This has increased to $.34/share in the TTM.
Free cash flow, except for a $(3) million in 2003, has been positive and growing from $16 million in 2002 to $105 million in the TTM.
The balance sheet looks solid with $37.8 million in cash and $528.7 million in other current assets according to Morningstar, balanced against $263.1 million in current liabilities and $225.3 million in long-term liabilities.
What about valuation? Taking a look at Yahoo "Key Statistics" on BMHC, we can see that this is a mid-cap stock with a market capitalization of $1.33 billion. The trailing p/e is very reasonable (imho) at 14.65, with a forward p/e even nicer at 14.38 (fye 31-Dec-06). Thus the PEG ratio is under 1.0 at 0.88.
 Using my Fidelity account for research, I found that BMHC is sitting in the "Home Improvement Stores" Industry Group and the price/sales is reasonable relative to the other stocks in the group.
Fastenal (FAST) tops the list at 3.3, Lowe's (LOW) is next at 1.3 and Home Depot (HD) at 1.1. BMHC is next to last in the group with a price/sales ratio of 0.5, with Builders Firstsource (BLDR) the most reasonable with a price/sales of 0.3.
Looking at other Yahoo "key statistics" we can see that there are only 14.24 million shares outstanding. As of 8/10/05, there were 634,910 shares out short, representing 4.50% of the float or 1.7 trading days. This does not look significant to me.
The company does pay a small dividend of $.40/share yielding 0.50%. The last stock split was a 3:2 split in March, 1994.
What about a chart? Looking at a "Point & Figure" chart on BMHC from Stockcharts.com:
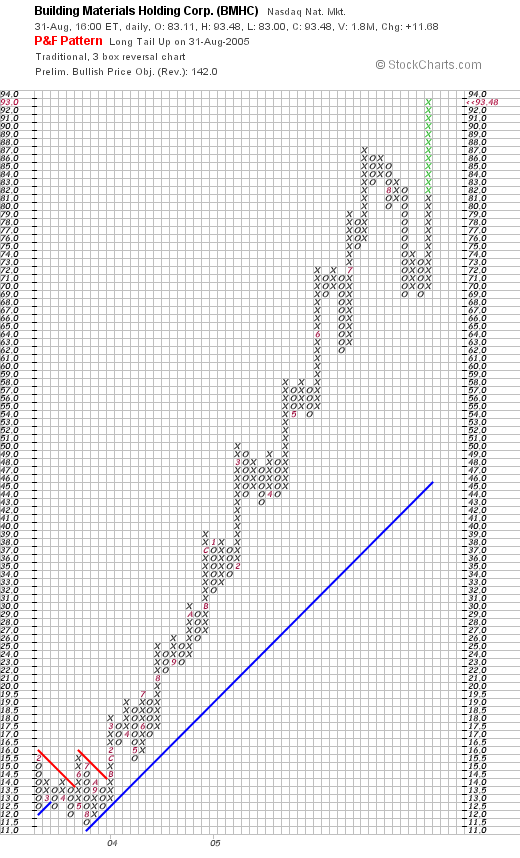
We can see what looks like an extremely strong stock graph that appears to be showing increased volatility. Since late July, 2004, when the stock broke through resistance at $14.00, the stock has moved almost perfectly higher to its current level of $93.
So what do I think? Well, even though this sounds something like profiteering on disaster, a building stock adds an air of optimism about the New Orleans catastrophe. The latest quarter was very strong, the past five years have been growing steadily, value is great with a PEG under 1.0, a price/sales low in its industrial group, and even the P/E being under 20 is pretty reasonable. The balance sheet looks nice, and the company even pays a growing dividend.
On the downside, there is some small softness in the housing market, and notwithstanding the Hurricane, this building cycle may be late. However, consider the size of the building effort in New Orleans! Boggles the mind.
On top of all of this, the chart looks great!
Now, if I only could sell a bit of Cal Dive (CDIS) or my Mentor (MNT) which is flirting with a sale at a gain....hmmm....anyhow, please feel free to comment on what I write here on the blog, or email me at bobsadviceforstocks@lycos.com.
We opened with beignets and let us close with Jazz! This is a photo I found on a Neurosciences Meetin Website of the Preservation Hall Jazz Band! Enjoy!

Bob
P.S.: My niece just called and my brother-in-law just showed up in Baton Rouge. Hospitalized for dehydration, he should be fine. Let us pray for so many other victims of this disaster!
Posted by bobsadviceforstocks at 6:52 PM CDT
|
Post Comment |
Permalink
Updated: Wednesday, 31 August 2005 8:01 PM CDT
Monday, 29 August 2005
"Revisiting a Stock Pick" Biosite (BSTE)
Hello Friends! Thanks so much for stopping by and visiting my blog,
Stock Picks Bob's Advice. As always, please remember that I am an amateur investor, so please consult with your professional investment advisors prior to making any investment decisions based on information on this website.
This post would be incomplete without a word of concern for the health and welfare of everyone affected by hurricane Katrina. Like many, I have relatives in the region and will be waiting to hear from all of them that they withstood the storm and are in good health. Times like these remind us that gains in our portfolio, clever approaches to investing, etc., are for naught if you and your family aren't safe and in good health!

I was looking through the
list of top % gainers on the NASDAQ and I came across Biosite (BSTE) which closed at $59.90, up $6.28 or 11.71% on the day. Although I have owned shares in the past, I do
not currently own any shares or options in this company.
I first
posted Biosite on Stock Picks on June 25, 2003 when it was trading at $48.15. The stock has appreciated $11.75 since posting or 24.4%.
According to the
Yahoo "Profile" on BSTE, the company "...engages in the discovery and development of protein-based diagnostics and antibody development technologies in the United States."
Looking for the latest quarterly report, I noticed that
Biosite reported 2nd quarter 2005 results on July 26, 2005. For the quarter June 30, 2005, revenues grew 23% to $73.8 million from $59.9 million last year. In addition, net income came in at $14.0 million, a 40% increase over the 2nd quarter 2004 results. On a diluted earnings per share basis, this worked out to a 29% increase to $.76/share, up from $.59/share last year.
Looking at the
Morningstar.com "5-Yr Restated" financials on BSTE, we can see a beautiful picture of revenue growth with revenue climbing from $55.0 million in 2000 to $273.0 million in the trailing twelve months (TTM).
Earnings during this time have also grown steadily from $.41/share in 2000 to $2.80/share in the TTM.
Free cash flow has been erratic, a function of fluctuating capital spending, with $12 million in 2002, dropping to $(41) million in 2003 but improving to $8 million in the TTM.
The balance sheet is gorgeous with $119.5 million in cash and $71.9 million in other current assets. This is enough to pay off both the current liabilities of $44.1 million AND the $16.1 million of long-term liabilities combined more than three times over.
Looking at
Yahoo "Key Statistics" on BSTE, we can see that this stock is a mid-cap stock with a market capitalization of $1.03 billion. The trailing p/e isn't too high at 21.35, with a forward p/e (fye 31-Dec-06) of 19.39. The PEG is reasonable at 1.23 (5 yr expected).
According to my Fidelity.com research, Biosite is in the "Diagnostic Substances" industrial group. Within this group, the price/sales figure for BSTE is quite reasonable. Topping this group is NUVELO (NUVO) at a price/sales of 431.6, followed by Human Genome Sciences (HGSI) at 298.3, Myriad Genetics (MYGN) at 7.8, QLT (QLTI) at 3.7, and Biosite (BSTE) at 3.4. At the bottom of the list, the most reasonably priced (by price/sales ratio) is Dade
Behring (DADE) at 2.0. Overall, Biosite is nicely priced within its particular industrial group.
Going back to Yahoo for some more statistics, we find that there are only 17.25 million shares outstanding. Interestingly, there are 3.52 million shares out short as of 8/10/05, representing 21.90% of the float (!), or 11.9 trading days of volume. This is actually up from $3.42 million shares out short last month. With the move higher today on some good news, we may be witnessing a bit of a "short squeeze" in this stock!
Yahoo reports no cash dividend and no stock dividends are reported as well.
What about the chart?
If we look at a
"Point & Figure" chart on BSTE from Stockcharts.com:
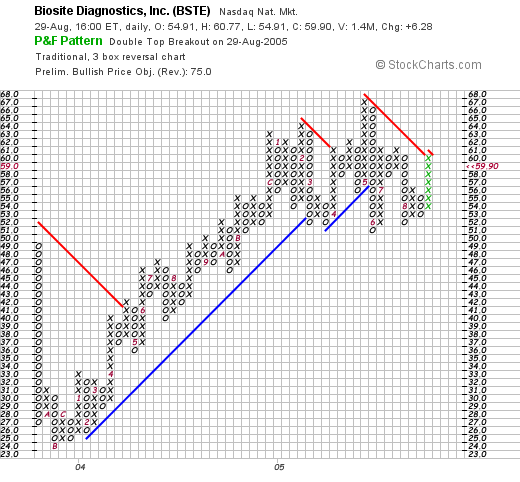
We can see what looks less than convincing insofar as stock strength. From November, 2003, when the stock was trading at $24, until February, 2005, when the stock peaked at $65, the stock has been moving higher. Recently, the price broke down as it crossed support levels at $57, to drop to $51, where it appears to be finding new price support. The stock has moved higher today, breaking through the latest resistance level, but a price move up to $62 or higher would be more convincing.
So what do I think? Well, it sure was a nice move higher today! And the latest quarter was beautiful. The morningstar.com looks nice with steady revenue and earnings growth. Free cash flow has been a bit erratic but is positive at this time and the balance sheet looks just fine. Finally, valuation appears reasonable and the stock chart looks a tad weak with the stock mostly just going sideways. However, the stock is certainly not over-extended. To top it off, there are loads of short-sellers out on this stock, so there is a bit of pent up demand as the stock price moves higher.
If I were in the market for a new stock, I certainly would be looking at this stock. In any case, thanks again for dropping by. I hope you find my discussions entertaining and educational. If you have questions or comments, please leave them right here on the blog or email me at bobsadviceforstocks@lycos.com.
Bob
Posted by bobsadviceforstocks at 1:54 PM CDT
|
Post Comment |
Permalink
Updated: Monday, 29 August 2005 10:53 PM CDT
Sunday, 28 August 2005
Introducing a New Discussion: "Weekend Trading Portfolio Analysis"

Hello Friends! Thanks so much for stopping by and visiting my blog,
Stock Picks Bob's Advice. As always, please remember to consult with your professional investment advisors prior to making any decisions based on this website as I am just an amateur investor who likes to write and share ideas about stocks!
Much of my time spent on this blog is devoted to presenting ideas on stocks, most of which I never have purchased. Alongside this, I like to tell you about the stocks that I actually buy, sell, hold, make money and lose money on! Since I spend some time each weekend looking at past ideas, I thought it might be helpful to review what has
actually happened in my own trading account, which consists of stocks I have selected from the vast numbers discussed here.
What I would like to try to do is to go alphabetically through my trading account, discussing one stock each week, reviewing my trading history, looking at current charts, and noting what action I may soon be taking. This will help you understand what I actually own and what I am just discussing.

The first stock to be discussed is Alliance Data Systems (ADS) which I acquired 200 shares of in my trading account on 6/16/05 at a cost basis of $39.10. ADS closed on 8/25/05 at a price of $41.79, for an unrealized gain of $2.69/share or 6.9%. I have not sold any portion of this stock, and am waiting either for a 30% gain on the upside, or an (8)% loss on the downside to be selling. I shall sell the entire position on the downside, but only 1/4 of my shares (50 shares) at that first sale point.
I first
posted Alliance Data Systems (ADS) on Stock Picks on 8/1/03 when it was trading at $28.45. Thus, the stock has appreciated $13.34/share or 46.9% since I first mentioned it on the blog, but actually only 6.9% since I purchased it only a little over two months ago.
According to the
Yahoo "Profile" on ADS, the company "...and its subsidiaries provide transaction services, credit services, and marketing services in North America."
On July 20, 2005, ADS
announced 2nd quarter 2005 results. For the quarter ended June 30, 2005, revenue increased 24% to $370.6 million compared with $299.7 million last year. Net income climbed 23% to $34.4 million or $.40/diluted share up from $28.0 million, or $.33/diluted share the prior year. In addition, the company guidance for 2005 for earnings from $1.87-$1.90 to $1.92-$1.95/share.
Checking the
Morningstar "5-Yr Restated" financials, we can see a picture of steady revenue growth from $0.7 billion in 2000 to $1.4 billion in the trailing twelve monts (TTM). Earnings have increased from $.31/share in 2002 to $1.34 in the TTM.
Free cash flow has been solid if not consistently increasing, but has increased from $80 million in 2002 to $242 million in the TTM.
The balance sheet looks good with $100.4 million in cash and $508.5 million in other current assets, easily covering the $475.7 million in current liabilities and making a small 'dent' in the $753.0 million in long-term liabilities.
Looking at
Yahoo "Key Statistics" on ADS, we find that this is a large cap stock with a market capitalization of $3.49 billion. The trailing p/e is a little rich at 31.30, but the forward p/e (fye 31-Dec-06) as estimated is nicer at 18.66. The PEG (5 yr expected) is a bit over 1.0 at 1.37.
Looking at Fidelity.com for research, I found that ADS is in the "Information/Delivery Svcs" Industry, and the Price/Sales ratio at 2.5 is priced midway in the group with FactSet Research (FDS) top at 5.5, Jupitermedia (JPM) also at 5.5, followed by ADS at 2.5, PROQUEST (PQE) at 2.0, and DST Systems (DST) at 1.7. Thus, valuation related to this parameter is also reasonable.
Looking at other statistics from Yahoo, we find that there are 83.6 million shares outstanding. As of 5/10/05 there were 2.35 million shares out short, representing 2.90% of the float or 2.5 trading days.
No cash dividend and no stock dividends are reported on Yahoo.
What about a chart? Taking a look at an updated
"Point & Figure" chart on ADS from Stockcharts.com:
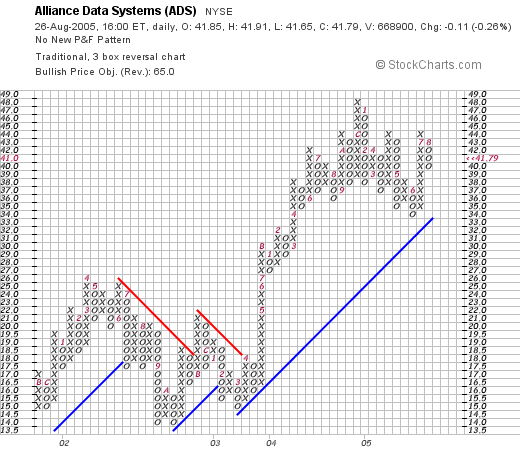
The chart looks strong, having broken through resistance in April, 2003, and has headed higher since passing through this $17 level. The chart appears to be moving higher without being 'over-extended'. (imho).
So what do I think? Well, this is a stock in my trading portfolio that I actually own. Latest quarter was strong with raised guidance. The Morningstar.com also looks strong, and valuation is reasonable if not cheap. The chart also looks steady.
Thus, I shall be holding on to this stock until it hits that 30% target on the upside (around $50.83), or I shall be unloading all of my shares at the (8)% loss level (around $35.97). Hopefully it is the former!
I hope this new review is helpful to you in knowing both what the stocks I actually own are, and hearing about so many other possibilities equally worthwhile!
Drop me a line at bobsadviceforstocks@lycos.com or leave your comments or questions right here on the blog!
Bob
Posted by bobsadviceforstocks at 9:52 AM CDT
|
Post Comment |
Permalink
Updated: Sunday, 28 August 2005 10:43 AM CDT
Saturday, 27 August 2005
"Looking Back One Year" A review of stock picks from the week of June 28, 2004

Hello Friends! Thanks so much for stopping by and visiting my blog,
Stock Picks Bob's Advice. As always, please remember that I am an amateur investor, so please consult with your professional investment advisors prior to making any investment decisions based on information on this website.
As I like to do, I use the weekend to review past stock selections on this blog in order to see how those stocks actually turned out a year later. I have missed a few reviews, so it works out that I am now about 60 weeks out from this trailing one year review. Each week, I move ahead another week and see "what happened". This week I am up to the week of June 28, 2004.
In my "real" trading account, I do not use a "buy and hold" approach. In fact, I sell my stocks quickly if they hit an 8% loss, and sell my gaining stocks slowly piecemeal, as they advance. But for the sake of this review, we shall be assuming a buy and hold approach and examine the weeks picks as if we had bought an equal dollar amount in each of the selections and see how we
would have done if we had purchased all of them.
On these reviews, I also give each stock a 'thumbs-up' or a 'thumbs-down' when reviewing their latest earnings report. In order to get a 'thumbs-up', I insist that both earnings and revenue show positive growth over the prior year.
That is what it means, in case you were wondering :).

On June 28, 2004, I
posted Aeroflex (ARXX) on Stock Picks at a price of $13.66. ARXX closed at $8.93 on 8/26/05, for a loss of $(4.73) or (34.6)%.

On August 16, 2005, ARXX reported
4th quarter 2005 results. Net sales for the fourth quarter ended June 30, 2005, came in at $128.0 million up from $125.3 million for the same period in the prior year. GAAP income from continuing operations for the quarter came in at $.03/diluted share down from the prior year's $9.0 million or $.12/diluted share.

On June 29, 2004, I
posted Getty Images (GYI) on Stock Picks at a price of $58.90. GYI closed on 8/26/05 at $84.08 for a gain of $25.18 or 42.8% since posting.

On July 26, 2005, Getty Images reported
2nd quarter 2005 results. Revenue grew 23% this year to $185.3 million, up from $150.3 million for the quarter ended June 30th last year. Net income came in at $34.0 million or $.53/diluted share up from $25.2 million or $.41/diluted share last year. In addition, the company increased guidance for the rest of 2005 to revenue in the range of $728-$735 million and earnings/diluted share of $2.20 to $2.26. This combined solid earnings report with raised guidance is the "one-two punch" that results in a higher stock price!

On June 30, 2004, I
posted Navarre (NAVR) on Stock Picks at a price of $14.39. NAVR closed at $7.08 on 8/26/05, for a loss of $(7.31) or (50.8)%.
On August 2, 2005, Navarre reported
1st quarter 2005 results. Net sales increased 10.6% to $140.8 million for the quarter ended June 30, 2005, compared with net sales of $127.3 million for the same quarter last year. Net income, however, was flat at $2.4 million or $.08/diluted share, compared with $2.2 million or $.08/diluted share last year.

On June 30, 2004, I
posted Scotts (SMG) on Stock Picks at a price of $63.88. SMG closed at $80.95 on 8/26/05 for a gain of $17.07 or 26.7%.
On July 28, 2005 Scotts Miracle-Gro
announced 3rd quarter 2005 results. Revenue for the quarter ended July 2, 2005, increased 18% to $910.8 million compared with $769.1 million in the same quarter the prior year. Net income, however, dropped 11.7% to $88.5 million, from $100.3 million last year, due to non-recurring charges. On a per share basis, this was a 14.3% decline to $2.58/share down from $3.01/share last year. The street is still optimistic about the company and the stock moved higher.

On June 30, 2004, I
posted Boston Scientific (BSX) on Stock Picks at $42.80. BSX closed 8/26/05 at $26.23, for a loss of $(16.57) or (38.7)% since posting.
On July 19, 2005, BSX
announced 2nd quarter 2005 results. Net sales grew 11% for the quarter ended June 30, 2005, to $1.617 billion, up from $1.460 billion last year. Net income, including "special charges" dropped significantly to $205 million or $.24/share this year, down from $377 million, or $.44/share in the same quarter last year.

Finally, on July 1, 2004, I
posted Tempur-pedic (TPX) on Stock Picks at a price of $14.45. TPX closed at $15.22 on 8/26/05 for a gain of $.77 or 5.3% since posting.
On July 21, 2005, Tempur-Pedic
announced 2nd quarter 2005 results. For the quarter ended June 30, 2005, net sales grew 27% to $192.6 million, up from $151.6 million in the second quarter of 2004. Net income came in at $24.8 million or $.24/diluted share, up from $16.9 million or $.16/diluted share, working out to an increase in net income of 47%.
So how did I do for this week a little over a year ago? Actually it was a tough week for me picking stocks. I had three stocks gaining and three stocks losing. The average performance was a
loss of (8.22)% on these six stocks.
Thanks so much for stopping by and visiting. Remember that past performance is not a guarantee of future results and that you should consult with a professional investment advisor prior to making any investment decisions based on information on this website!
If you have any questions or comments, please feel free to email me at bobsadviceforstocks@lycos.com or just go ahead and post them right here on the blog. I hope everyone has a great Sunday and a great week trading next week!
Bob
A Reader Writes "More questions though:"
Hello Friends! Thanks so much for stopping by and visiting my blog,
Stock Picks Bob's Advice. As always, please remember that I am an amateur investor, so please consult with your professional investment advisors prior to making any investment decisions based on information on this website.

After writing my note on options, I thought I might be done with this subject :), but Josie wrote right back and has another question:
Hi Bob - Thanks so much for the detailed explanation! More questions
though:
Should I wait until December '05 to "Buy to Close" my position or should I
do this now? When "buying to close", I'm not buying the actual GTI stocks @
$5 per share, right? I am just essentially closing my position to get out
of this mess, correct?
My account is showing "-$95" right now for this transaction. I presume that
is what will be taken out of my account if I close out of this position, is
that right?
Live and learn...my life's motto...which sometimes costs me a lot... :(
Thanks again Bob.
Josie
Josie, I must first re-emphasize that if I am an amateur with stocks, I am a
real beginner as far as options is concerned! But let me give this a shot. (Again, if there are some real options traders and professional investors out there reading this, please feel to chime in with your thoughts...either right here on the blog or email me at bobsadviceforstocks@lycos.com with your information.)
Apparently, you wrote a contract on Graftech with a strike price of $5 and an expiration of December, 2005. In general, your best bet after writing a contract, is for that contract to expire worthless, you still own the stock and you can then pocket the difference. (Your proceeds for the sale of the contract)
I really cannot tell you what to do with this contract. I have about
zero experience in this type of trading, and could not, in any case, predict what will happen to this trade.
But I think we can in general speculate about what might happen under different scenarios to get a feel for your situation. For instance, we know that GTI closed at $5.41 on Friday, August 26th, 2005. Thus this contract is "in the money" and is likely to be exercised come the expiration date. (If the stock stays above $5.00, the contract holder, the individual who bought the contract from you, could exercise the call option and purchase GTI for $5.00 and would then receive the difference between the $5.00 and the market price of GTI if he sold the underlying shares, which would be $.41 (if it were today) times 100....the number of shares per each contract, which would work out to a $41 profit/contract for him (minus of course the actual price he paid for the option).
However, if the stock closes out this period under $5.00, then the option is said to be out of the money and will expire worthless, highly unlikely to be exercised.
You are correct that "buying to close" is not about buying any stock. You are in essence buying the option contract from someone else, so that it is a wash in your account, and the risk and benefit is transferred from your account to the new account which sold you the option.
Not trading options myself, I am not sure about the "-$95" figure, except to assume that the stock price has actually appreciated about $.95/share from your time of selling the contract (there are actually two components to a gain on an option like this, the portion that is "in the money" and the speculative portion which is 'time-related'...as you get closer to the expiration date, in general, the speculative portion of the option diminishes to zero and the value instead becomes the actual difference in price between the market price and the 'strike-price'), and to replace the contract, that is to "buy to close" will cost you $95 more than you made on your sale.
This last is just my guess, and not knowing your particular situation, and not knowing the time you purchased it, etc., and quite frankly, not being a real expert at this stuff....well just take that bit with a 'grain of salt'.
In conclusion, these type of transactions are complex and highly risky. I avoid options as much as possible even though the leverage associated with these contracts can produce fabulous results. The downside is also quite impressive.
I hope that added some insight into your particular situation. Again, thanks for writing!
Bob
A Reader Writes "Would you be so kind to explain?" continued....
I went to sleep last night realizing I hadn't probably fully explained the Options question raised by Josie. But then again, I truly am an amateur and am not well versed on options strategies...I like to trade stocks but not the options contracts associated with them.
One of the things I enjoy doing on this website is to use questions like the one posed by Josie to better understand investing myself! Honestly!
So let's see if we can examine options a bit more and understand the particular situation that Josie is describing. (Again if you are a professional options trader/advisor and would like to help out here, that certainly would be appreciated....just leave a comment here on the blog or email me at bobsadviceforstocks@lycos.com and I will add your comments to the discussion.)
First of all, Graftech International (GTI) closed yesterday at $5.41, down $(.23) or (4.08)% on the day.
You wrote that you wanted to "buy the call .gtila", but Scottrade wouldn't allow you to do this in your IRA....and would only allow you to "sell to open". Apparently you already own the underlying Graftech stock in your IRA.
Let's take a look at what a ".gtila" option means.
As explained in
Yahoo "Finance":
Options quotes follow a pattern that enables you to easily construct and interpret symbols once that formula is understood.
The basic parts of an option symbol are:
Root symbol + Month code + Strike price code
So in your case, the "root symbol" is "gti" indicating the company, the "Month code" is "l" which works out to be a "call" for the month of December, and the "Strike price code" is "a" representing $5 or $105, $205, $305, $405, or $505. Since GTI is trading at $5.41, I assume the strike price for this stock is $5.00.
You write that Scottrade wouldn't allow this. I do not believe, if you read the previous post, that buying a call option is necessarily illegal in an IRA, because the 'exposure' one has to loss is limited only the cost of that option. This is very different from writing an option contract which you did execute in your IRA.
O.K....let's see what happened next. You write:
It said that I can only “Sell to Open” my position – the complete opposite of what I wanted to do. Out of curiosity, I went ahead and did it. I bought 1 .gtila “Sell to open” call option at ask price of $1.15, $5 strike price, Dec 2005.
Apparently, the brokerage house communicated to you that you could only "sell to open" this .gtila call contract. And you report that you "bought" a .gtila option. I don't think you "bought" anything at all. Please check your statement. It is my (amateur) impression that what you did was SELL a contract on your underlying stock. That is why it is called "sell to open". Scottrade allowed you to do this because the underlying stock is sitting in your IRA account, and what you did was write a "covered call". That is you sold somebody the right to purchase a 100 share position of GTI at $5, by December, 2005. Since you own the stock, it is not a "naked call", that is you aren't writing a contract guaranteeing that you will deliver up 100 shares of GTI that you
don't own but that you would be liable to purchase so that you
could deliver those shares to the contract purchaser. If the shares rise above the $5 strike price, and the possibility of purchasing the GTI shares at $5 is profitable for the purchaser of the contract, your liability is the potential delivery of those shares at the $5 price. Nothing more. If it were a "naked call" then, for instance, if the stock rose to $10, and this anonymous contract holder might "call" the stock at $5, and you would have to scramble to buy some shares at a higher price so that you could deliver these shares to him or her at the $5 price that you specified. Thus, you would be exposed to an unlimited financial risk...in a limited IRA setting....thus, disallowing this type of transaction in that setting. I hope you are following.
Finally, you conclude with this:
Now what happens? Do I now “Buy to Close” my position? This whole thing confuses me. Would you be so kind as to explain this please?
This time you are correct. You need to "buy to close" to get out of a contract that you have written. This one is a bit trickier, but from my (amateur) view, if somebody now holds a contract to buy shares from you at a specified price, you don't actually buy the contract back from that individual who might or might not want to sell at the same time you want to buy it back :), but by purchasing the same contract 'on the market' you will have neutralized your risk and have exited the option. I assume that your brokerage account would delete the contract from your account at that time.
Anyhow, I think that is a bit of a better explanation, after doing my own homework on this...than the prior entry. Again, if there are some professional options traders, please feel free to critique and correct what I have written.
I don't need to remind you that I am an amateur investor, so please consult with your professional investment advisors!
Thanks again for visiting. I hope the above discussion was helpful even though I am learning about this as I write as well. I have traded a few options (unprofitably) in the past and since then have avoided that end of the business and stick to my current strategy.
Bob
A Reader Writes "Would you be so kind to explain this please?"
Hello Friends! Thanks so much for stopping by my blog,
Stock Picks Bob's Advice. As always, please remember that I am an amateur investor so please consult with your professional investment advisor prior to making any decisions based on information on this website.
This evening, checking my email, I noted that I had a question regarding a rather complicated options strategy that our reader states he entered into after taking a "3-day class". Not being very knowledgeable on the fine points of options, I would like to encourage our readers to comment here on Josie's question, who wrote:
Hello Bob,
I own a NYSE stock, Graftech Internation LTD (GTI). Additionally, I really wanted to buy the call (.gtila) but my Scottrade IRA account would not allow me. It said that I can only “Sell to Open” my position – the complete opposite of what I wanted to do. Out of curiosity, I went ahead and did it. I bought 1 .gtila “Sell to open” call option at ask price of $1.15, $5 strike price, Dec 2005. Now what happens? Do I now “Buy to Close” my position? This whole thing confuses me. Would you be so kind as to explain this please? I took a 3-day investing class and made a lot of notes from the 3-day class, but this transaction has got me so confused.
Thanks so much,
Josie
I found some information on
Investopedia.com regarding some of these issues that hopefully will help you sort it out:
Before trying to understand the different positions one can hold with options, think of the positions one can hold with stocks. With a stock you can either buy it or sell it. You have only two alternatives.
However, because of the nature of options, specifically their contractual basis, they offer four different alternatives for entering and exiting positions. There is an option writer and an option purchaser. The writer can enter or exit a transaction, and so can an option purchaser. Entering an options transaction as a writer is known as opening a short position - or selling to open. Conversely, when a writer closes a short position, he or she is buying to close. The person buying an options contract is said to be opening a long position - or buying to open. Finally, an options purchaser exiting or closing a long position is said to be selling to close.
In summary, a person holding a short position (contract writer) can sell to open (enter a contract) or buy to close (close a position). A person holding a long position (contract purchaser) can buy to open (enter a position) or sell to close (close a position).
O.K., I am
not an option trader, but from what I can tell, you already own Graftech (GTI). The key to being unable to do certain transactions in your IRA account is they these may be
prohibited in IRA's. However, the sale of call options on your existing positions is allowed. This transaction is called opening a short position or "selling to open". Now, when you want to close a short position, exiting from the contract that you wrote, you are "buying to close" which is what your Scottrade IRA account permitted.
The following is a discussion of some of the limits of option trading allowed in IRA's that I found on the
SmartMoney website:
As far as we're concerned, your retirement account is no place to pursue such a risky investment strategy. But since it is your money, we have to tell you: You are allowed to buy options, both puts and calls, in an IRA.
Some IRA plans specifically disallow the trading of options. But even for those that do permit it, what you want to do is against the law. That's because you want to trade uncovered, or naked, options which entails investing money borrowed from a margin account. That is prohibited by the IRS, says John Power, a vice president at the Options Institute, the educational arm of the Chicago Board Options Exchange.
Let us explain for the uninitiated: When you buy put or call options from your broker, you are essentially buying the right to buy or sell a stock at a specific price on a specific date. Your liability is limited to the amount of money you've invested. Likewise, you can sell a call option when you own the underlying shares -- what's known as writing a covered call. In this case, the shares you already own are collateral for the option. But when you write an uncovered call, and hence do not own any of the underlying shares, your liability is potentially unlimited. That's because you may have to go buy the shares at the market price, but deliver them at the option's strike price.
Anyway, we recommend that almost all individual investors steer clear of trading options, except for highly specific hedging situations. Otherwise, it isn't worth the risk.
Again, I must emphasize that I am an amateur investor, so I am
not an expert at the trading of equity options, let alone the specifics of trading within an IRA account. Clearly, since the trading of "naked" options contracts may entail unlimited risk, these are not allowed inside of accounts that are limited by law to contributions that are clearly delineated. I believe that this is why your account locked you out on that particular trade!
I hope this is helpful! And I hope that some of the professional investors who stop by this website on occasion will join in on this discussion. In any case, I would encourage you to consult with your professional investment advisors to get more information on this particular question!
If you have any other questions or comments, please feel free to email me at bobsadviceforstocks@lycos.com or leave them right here on the blog.
Bob
Friday, 26 August 2005
"Revisiting a Stock Pick" Lifeway Foods (LWAY)
Hello Friends! Thanks so much for stopping by and visiting my blog,
Stock Picks Bobs's Advice. As always, please remember that I am an amateur investor so please remember to consult with your professional investment advisors prior to making any investment decisions based on information on this website.

Alan Greenspan is throwing a little
cold water on the market today, warning about the increasing value of stocks and real estate. In the face of this, I still managed to find a stock from the
list of top % gainers on the NASDAQ today.

I first
posted Lifeway (LWAY) on Stock Picks on August 21, 2003, when it was trading at $14.51/share. LWAY had a 2:1 stock split, making our effective "pick price" only $7.26. I actually owned a few shares for awhile, although I do not currently own any shares or options in this company.
Today, LWAY, as I write, is trading at $16.18, up $2.09 or 14.83% on the day. This is an increase of $8.92 or 122.9% from my pick price almost exactly two years ago!
What is driving the stock higher today, in the face of a fairly sloppy market, was the
news that Wal-Mart will be carrying some of its kefir milk-based products in up to 17 of their stores in the Chicago area.
According to the
Yahoo "Profile" on LWAY, Lifeway "...manufactures probiotic, cultured, and functional dairy and nondairy health products. It offers Kefir, a drinkable product, which is similar to but distinct from yogurt, in various flavors sold under the name 'Lifeway's Kefir'; a plain farmer's cheese sold under the name 'Lifeway's Farmer's Cheese'; a fruit sugar-flavored product similar to cream cheese sold under the name of 'Sweet Kiss'; and a dairy bevarage, similar to Kefir, with protein and calcium, sold under the name 'Basics Plus'."

On August 15, 2005, LWAY reported
2nd quarter 2005 earnings. Revenues for the quarter ended June 30, 2005, came in at $5.07 million, up 27% from last year's second quarter revenue of $4.00 million. Net income for the quarter came in at $556,845 or $.07/share in 2005, up from $432,109 or $.05/split-adjusted share in 2004.
Looking longer-term at a
"5-Yr Restated" financials from Morningstar, we can see a nice, steady picture of revenue growth from $9.2 million in 2000 to $17.0 million in the trailing twelve months (TTM).
Earnings have also steadily grown from $.11/share in 2000 to $.24/share in the TTM, except for a slight dip from $.26/share in 2003 to $.24 in 2004.
Free cash flow, while small, has stayed positive with $3 million reported in 2002 and $2 million in the TTM.
The balance sheet also is beautiful with $12.3 million in cash alone reported, more than enough to pay off both the current liabilities of $.9 million and the long-term liabilities of $.9 million combined more than six times over. In addition, LWAY is reported by Morningstar to have an additional $3.8 million in other current assets.

Looking at
Yahoo "Key Statistics" on LWAY, we can see that this is a TINY company with a market cap of only $135.61 million. The trailing p/e is a bit rich at 63.62, and the forward p/e is still high at 40.40 (fye 31-Dec-06). No PEG is listed.
The stock also looks rich on a price/sales basis. According to my Fidelity brokerage account research, Lifeway (LWAY) tops the list of price/sales ratios in the "Dairy Products" industrial group at 7.0. This is followed by Dreyer's (DRYR) at 4.8, Galaxy Nutritional (GXY) at 0.8, and Dean Foods (DF) at 0.5.
Looking back at Yahoo for some other valuation measures, we find that LWAY now has 8.39 million shares outstanding. As of 7/12/05, there were 255,780 shares out short representing 6.50% of the float or 4 days of trading. So this isn't that significant imho. No cash dividend is paid, and the last stock split was the 2:1 mentioned earlier on 3/9/04.
What about the chart? Looking at a
"Point & Figure" chart on LWAY from Stockcharts.com:
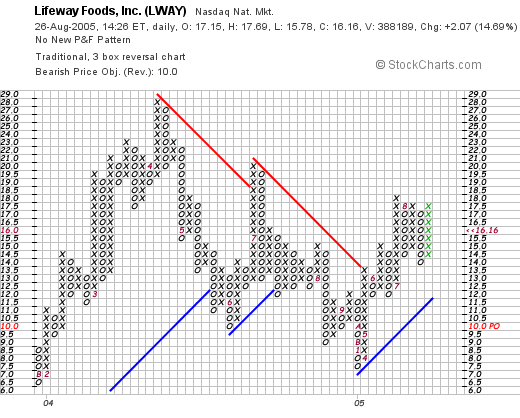
We can see a chart that initially was quite strong early in 2004 when it climbed from $7 to $28 in April, 2004, but then sold off for the nex year until bottoming recently at $8.00 in January, 2005. The stock subsequently broke through resistance at $14, and is now trading higher. The stock looks positive, but certainly not the strongest chart in the world. On the other hand, it doesn't look overextended as many of the graphs I post on stocks look. Anyhow, you make the call :).
So what do I think? Well, the latest quarter was solid. It is a very tiny stock and a tiny company which makes a big move on news of having its yogurt drink carried by 17 Wal-Mart stores. But then again, there are a LOT of Wal-Mart stores out there....so that could be big news (?). Anyway, the Morningstar looks nice, with the exception of a big of a dip in earnings this past year (the latest quarter shows that this is likely already history). Free cash flow is positive and the balance sheet is gorgeous.
The valuation is a bit rich with both p/e and p/sales significantly higher than its peers.
The chart looks positive and not over-valued.
In summary, this is a very small company with what appears to be a very positive outlook. I do believe that these companies may be the ones that produce the largest gains in stock price, but may also be the most volatile as large investors have no choice but make waves as they enter and depart shares.
Thanks so much for stopping by! If you have any questions or comments, please feel free to email me at bobsadviceforstocks@lycos.com, or just leave them right here on the blog. Have a great weekend everyone!
Bob
Newer | Latest | Older


