Stock Picks Bob's Advice
Sunday, 11 December 2005
New ***PODCAST for the Weekend Review: PARL, WIT, and WWW
Hello Friends! I have posted another podcast for the latest blog post. Click
CLICK HERE FOR MY PODCAST.
Bob
Posted by bobsadviceforstocks at 10:19 AM CST
|
Post Comment |
Permalink
Updated: Sunday, 11 December 2005 3:43 PM CST
"Looking Back A Year" A review of stock picks from the week of October 4, 2004

Hello Friends! Thanks so much for stopping by and visiting my blog,
Stock Picks Bob's Advice. As always, please remember that I am an amateur investor, so please remember to consult with your professional investment advisors prior to making any investment decisions based on information on this website.
One of the things I like to do is to think about investments and in particular to pick stocks that seem to have the qualities that might lead to future price appreciation. In order to find out whether the selections are successful, I have taken to reviewing past stock selections on a rolling 52 (now about 60) week trailing basis. That is, I look at stocks from a bit more than a year ago, moving ahead another week each review, and see how they have turned out. Of course, this review depends on what is called a "buy and hold" strategy. In actuality, I sell losing stocks completely and quickly on price break-downs, and I sell my gaining stocks slowly and partially at targeted appreciation levels. However, for the sake of this review, this analysis suffices.

On October 4, 2004, I
Posted WIPRO (WIT) on Stock Picks Bob's Advice when it was trading at $20.86. WIT split 2:1 on 9/2/05, making my effective pick price actually $10.43. WIT closed at $11.18 on 12/9/05, giving me a $.75/share gain or 7.2% appreciation since posting.

On October 18, 2005, Wipro
reported 2nd quarter 2006 results. For the quarter ended September 30, 2005, revenue climbed 26% over the prior year and net income was up 23%.

On October 6, 2004, I
posted Wolverine World Wide (WWW) on Stock Picks Bob's Advice when it was trading at $28.90. WWW split 3:2 on 2/2/05, so my effective pick price was actually $28.90 x 2/3 = $19.27. WWW closed at $22.52 on 12/9/05, for a gain of $3.25 or 16.9%.
On October 5, 2005, WWW
reported 3rd quarter 2005 results. For the quarter ended September 10, 2005, revenue came in at $279.1 million, up 7% from the prior year's $260.9 million. Earnings per share came in at $.42, up from $.37/share the prior year, a 13.5% increase. The company also raised guidance. As reported in the same news story, from Timothy J. O'Donovan, the company's Chairman and CEO:
"With strong third quarter results and an order backlog increase of approximately 19 percent, we are increasing the Company's 2005 earnings per share estimate. We now expect earnings per share to range from $1.26 to $1.28. We have also focused our 2005 revenue range from $1.050 to $1.060 billion. The earnings per share estimate does not include any impact from the potential repatriation of foreign earnings under the American Jobs Creation Act of 2004 which the Company is currently evaluating."
A strong earnings report with an increase in guidance from the CEO is usually very bullish for a stock price!

Finally, on October 7, 2004, I
posted Parlux Fragrances (PARL) on Stock Picks Bob's Advice when it was trading at $14.95. PARL has had a very nice "aroma" for this website, closing at $30.84 on 12/9/05, for a gain of $15.89 or 106.3% since posting.
This stock gets a
BIG "thumbs-up" on the latest earnings report! On November 14, 2005, PARL
announced 2nd quarter 2006 results. For the quarter ended September 30, 2005, net sales came in at $39.3 million, up 73% from $22.7 million last year. Net income was $4.4 million, up from $2.4 million, an 87% increase (!). Earnings per share grew 83% on a diluted basis from $.23/share last year to $.42/share in this year's quarter. These were very strong results!
So how did we do a year later in this week's group of stock picks? Fabulous! I picked three stocks that week and they have since moved higher in price ranging from 7.2% to 106.3% for an average price appreciation of 43.47%. Most of that is of course from the PARLUX stock. Unfortunately, I don't own any shares of any of these stocks but my stock club does, at my last meeting at least, own a few shares of WIPRO.
Please remember that past performance is
never a guarantee of future performance, that I am an amateur investor, and that you should check with your professional investment advisors prior to making any investment decisions based on information on this website!
Thanks again for visiting! If you have any questions or comments, please feel free to write me a note at bobsadviceforstocks@lycos.com or leave your comments on the blog.
Bob
Saturday, 10 December 2005
New ***PODCAST*** for Weekend Trading Portfolio Review: ResMed (RMD)
Hello Friend! I just wanted to update my newest
***PODCAST on Weekend Trading Portfolio Review: ResMed (RMD)***.
If you have any comments or questions, please feel free to email me at bobsadviceforstocks@lycos.com.
Bob
Friday, 9 December 2005
"Weekend Trading Portfolio Analysis" ResMed (RMD)
Hello Friends! Thanks so much for stopping by and visiting my blog,
Stock Picks Bob's Advice. As always, please remember that I am an amateur investor, so please remember to consult with your professional investment advisors prior to making any investment decisions based on information on this website.

One of my goals on this blog is to allow you to understand investing from my perspective. That includes updates regarding my positions, my trading and my current thoughts on the investments that make up my portfolio. Several months ago, I started adding a weekly look at a single holding in my portfolio, working through the holdings alphabetically. Last week I
discussed Quality Systems (QSII) on Stock Picks Bob's Advice; next alphabetically is ResMed (RMD).

On February 9, 2005, I purchased 120 shares of ResMed (RMD) in my trading account at $59.67/share. On September 27, 2005, I sold 30 shares of ResMed netting $77.64/share for a gain of $17.97 or 30.1%. This was 1/4 of my shares (as I like to point out, I have reduced my sales of shares to 1/6th positions) at my first "targeted sale price". RMD subsequently, on October 3, 2005, had a 2:1 split, making my effective purchase price actually $59.67/2 = $29.84. RMD closed 12/9/05 at $40.21, giving me an unrealized gain of $10.37 or 34.8% over my purchase price.
When will I be selling next? On the downside, since I sold a portion at the 30% gain level, I have moved my "mental stop" up to break even or $29.84/share. On the upside, the next point to sell 1/6th of my shares is at a 60% gain or 1.6 x $29.84 = $47.74.
Let's take an updated look at this company and see if it still looks like an attractive investment!
First of all, let's review the company's business. According to the
Yahoo "Profile" on ResMed:
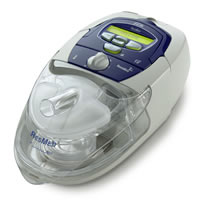
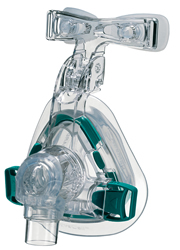
ResMed, Inc., through its subsidiaries, engages in the design, manufacture, and marketing of equipment for the diagnosis and treatment of sleep-disordered breathing and other respiratory disorders, including obstructive sleep apnea. Its products include airflow generators; diagnostic products; mask systems; headgear; and other accessories, including humidifiers, cold passover humidifiers, carry bags, breathing circuits, Twister remote, the Aero-Click connection system, and the AeroFix headgear.
And what of the latest quarter? On November 2, 2005, ResMed
announced earnings results for the quarter ended September 30, 2005. Revenue came in at $127.1 million, a 45% increase over the same quarter last year. Even without acquisition related revenue, growth in revenue still amounted to a strong 30% growth. Net income came in at $16.4 million, up from $13.9 million last year. Diluted earnings per share amounted to $.23/share, up from $.20/share last year. The reported earnings included restructuring and amortization of "acquired intangibles" without which, earnings worked out to $.28/share. Still, even with this, earnings were up 15% for the quarter.
And what about Morningstar? Looking at the
Morningstar.com "5-Yr Restated" financials on RMD, we can see the steady revenue growth from $155.2 million in 2001 to $464.9 million in the trailing twelve months (TTM). Earnings also show an uninterrupted pattern of steady growth from $.18/share in 2001 to $.94/share in the TTM.
A negative is the $(1) million in free cash flow due to a large increase in caital spending in the last twelve months. I shall need to continue monitoring this, although I do not think this is significant in the long run.
The balance sheet is solid with $134.2 million in cash and $236.4 million in other current assets, balanced against $230.3 million in current liabilities and $80.8 million in long-term liabilities.
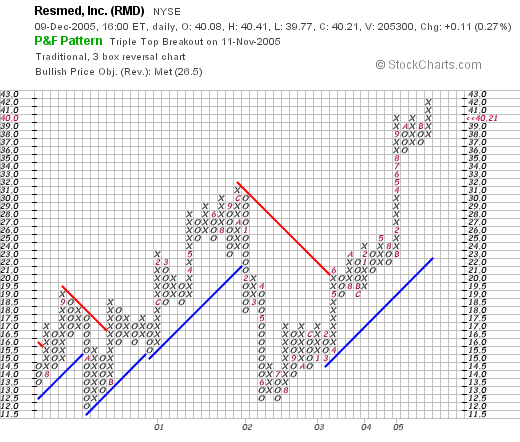
And the chart? Looking at a
"Point & Figure" chart on RMD from Stockcharts.com, we can see that since breaking through resistance in June, 2003, at the $21 level, the stock has been moving strongly higher. I don't think the chart looks at all negative, in fact, the stock is moving into new high territory.
Thus, the stock still looks like a great investment to me! The recent quarter was solid, the Morningstar.com report is essentially intact (except for the negative free cash flow which deserves attention), the balance sheet looks nice, and the chart looks strong.
Thanks so much for stopping by and visiting! If you have any questions or comments, please feel free to leave them on the blog or email me at bobsadviceforstocks@lycos.com.
Bob
Posted by bobsadviceforstocks at 10:54 PM CST
|
Post Comment |
Permalink
Updated: Saturday, 10 December 2005 6:21 PM CST
Thursday, 8 December 2005
December 8, 2005 ***PODCAST*** for Veritas DGC (VTS)
Hello Friends! Thanks so much for stopping by and visiting my blog,
Stock Picks Bob's Advice.
Please click
***HERE FOR MY PODCAST ON VERITAS DGC (VTS)***.
Have a great weekend!
Bob
December 8, 2005 Veritas DGC Inc. (VTS)
Hello Friends! Thanks so much for stopping by and visiting my blog,
Stock Picks Bob's Advice. As always, please remember that I am an amateur investor, so please remember to consult with your professional investment advisors prior to making any investment decisions based on information on this website.

As I like to do when looking for a potential stock pick, I started out tonight looking through the
list of top % gainers on the NYSE today. Near the top of the list was Veritas DGC Inc. (VTS), which I of course initially confused with Veritas Software (VRTS), which of course you wouldn't do would you? Anyhow, VTS closed at $37.28, up $3.00 or 8.75% on the day. I do not own any shares of this stock nor do I have any options on this equity.
"Image courtesy of Veritas DGC Inc. All rights reserved."
So
what does Veritas DGC do anyway? Well, according to the
Yahoo "Profile" on VTS:
Veritas DGC, Inc. provides geophysical information and services for the national and independent oil and gas companies worldwide. It acquires, processes, interprets, and markets geophysical information that provides 2D and 3D images of the subsurface. The company also produces 4D surveys, which record fluid movement in the reservoir, by repeating specific 3D surveys over time. In addition, it uses geophysical data for reservoir characterization to enable its customers to recover oil and natural gas.
Veritas DGC is in the Seismic Information business for the Oil Industry!
As is often the case, what drove the stock higher today was an earnings report. In fact, yesterday, after the close of trading VTS announced
1st quarter 2006 earnings. The results, on first glance, were nothing short of fabulous. Revenue for the quarter climbed 30% to $168.7 million from $129.6 million. For the quarter earnings were $11.8 million or $.32/share, up about 1,000% (honestly) from $978,000 or $.03/share the year earlier. The latest quarter
does include a $2 million one time insurance payment, but even without that payment, the earnings growth was phenomenal! Expectations by Thomson Financial were reported to be $.20/share on $155.4 million of revenue. Clearly, the company blew away analysts expectations. That, of course, is always bullish for a stock price.

And what does Morningstar report on this company? Taking a look at the
"5-Yr Restated" financials from Morningstar.com on VTS, we can see that except for a small dip in revenue from $476.6 million in 2001 to $452.2 million in 2002, revenue has grown steadily to $634 million in the trailing twelve months (TTM). Earnings have been erratic; dropping from $.68 to a loss of $(1.77) between 2001 and 2003, then turning positive in 2004 and increasing to $2.37/share in the TTM.
And free cash flow? This is solidly positive, increasing from $170 million in 2003 to $269 million in the TTM.
The balance sheet as reported by Morningstar shows $249.4 million in cash and $203 million in other current assets. This is quite adequate to cover both the $192.4 million in current liabilities and the $191.6 million in long-term liabilities combined.

And how about some valuation 'numbers' on this stock? Looking at
Yahoo "Key Statistics" on Veritas DGC, we find that the stock is a mid-cap stock with a market capitalization of $1.29 billion. The trailing p/e is nice at 15.74, and the forward p/e is actually higher (?) (fye 31-Jul-07) at 18.36. No PEG is reported.
Using the
Fidelity.com eResearch site on VTS, we can see that Veritas DGC is in the "Oil & Gas Equipment/Svcs" Industrial Group. Within this group, VTS sports a very reasonable Price/Sales ratio of 1.9. Topping this group is Schlumberger (SLB) at 4.5, BJ Services (BJS) at 4.1, Baker Hughes (BHI) at 3, Cooper Cameron (CAM) at 2, then Veritas DGC (VTS) at 1.9 and Halliburton (HAL) at 1.7.
Looking for some additional numbers on VTS, Yahoo shows 34.59 million shares outstanding. As of 11/10/05, there were 2.42 million shares out short, representing 7% of the float or 4 trading days (the short ratio) of volume. This is a bit heavy imho, and may be some of the buying pressure in this stock.
No cash dividend is paid and the last stock split reported by Yahoo was a reverse 1:3 split in January, 1995.
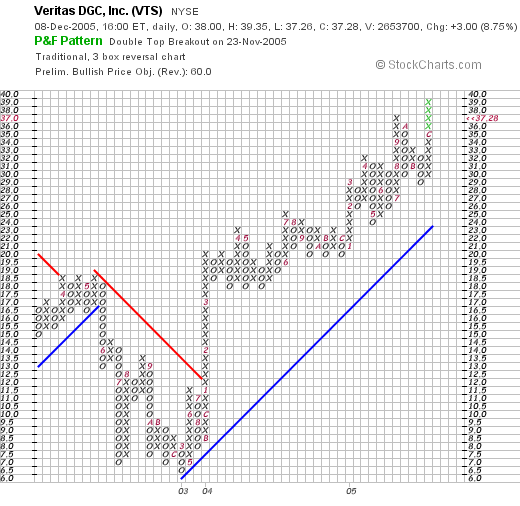
What about a chart? Looking at a
"Point & Figure" Chart on VTS from Stockcharts.com, we can see that the stock traded lower from $18.50 in April, 2002, to $6.50 in March, 2003, and then started trading higher. The stock is trading nicely higher since that period, above its support line on the graph. It is interesting that this period of weakness in the chart corresponds nicely with the underlying performance of the company during this time.
So what do I think? Well, the company is certainly in a very hot energy-related field. The latest quarterly report was superb, the Morningstar report for the last few years has been strong and valuation is downright cheap in both the p/e and the price/sales reviews. The chart looks nice and I don't think it is done with its climb imho. Unfortunately, I don't have a buy signal to allow me to buy this stock. But the overall picture is certainly interesting.
Thanks so much for stopping by! If you have any comments or questions, please feel free to email me at bobsadviceforstocks@lycos.com. Or you can just leave your comments right on the blog.
Bob
Posted by bobsadviceforstocks at 10:18 PM CST
|
Post Comment |
Permalink
Updated: Thursday, 8 December 2005 11:19 PM CST
Wednesday, 7 December 2005
PODCAST for HURCO (HURC)
Click
***HERE for my PODCAST on HURCO***.
If you have questions or comments, please feel free to email me at bobsadviceforstocks@lycos.com.
Bob
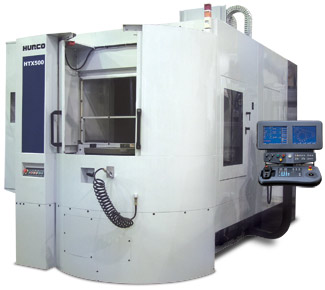
December 7, 2005 Hurco Companies (HURC)
Hello Friends! Thanks so much for stopping by and visiting my blog,
Stock Picks Bob's Advice. As always, please remember that I am an amateur investor, so please consult with your professional investment advisors prior to making any investment decisions based on information on this website or on my podcast.

Looking through the
list of top % gainers on the NASDAQ todlay, I came across Hurco Companies, Inc. (HURC), which closed at $27.33, up $4.50 or 19.71% on the day. I do not own any shares, nor do I have any options on this company.
According to the
Yahoo "Profile" on HURC:
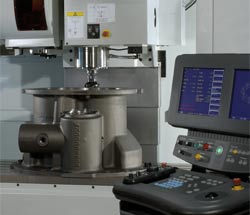
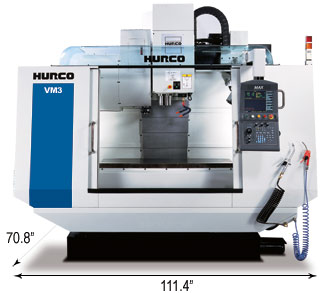
Hurco Companies, Inc., an industrial technology company, engages in the design and production of interactive, personal computer-based, computer control systems and software, and computerized machine tools for sale to the metal working industry. The company’s primary products consist of general purpose computerized machine tools for the metal cutting industry, principally vertical machining centers. It also produces computer control systems and related software for press brake applications that are sold as retrofit control systems.
As is often the case, what drove the stock higher was a very strong earnings report. Yesterday, after the close of trading, HURC
announced 4th quarter 2005 results. For the quarter ended October 31, 2005, sales and service fees totalled $34.7 million, up sharply from the $28.9 million reported in the year earlier same period. Net income was up over 200% at $7.2 million or $1.13/diluted share, from $2.3 million or $.36/diluted share the prior year. This strong report was enough to drive the stock strongly higher. In addition, this report came out after a relative panic on this stock precipitated by the
November 30, 2005, delay in the earnings announcement which drove the stock lower a week ago:
INDIANAPOLIS (AP) -- Hurco Cos. shares tumbled Wednesday after the manufacturer delayed the release of its fourth-quarter and full-year earnings report, saying it needs more time to review its tax liabilities.
Shares of the Indianapolis company, which makes computer controls, software and systems for the metal cutting and forming industries, fell $1.81, or 7.7 percent, to $21.60 in midday trading on Nasdaq, and dropped as low at $20.35 earlier in the day. But Hurco shares have risen about 39 percent since the year began.
I guess this was a case of fearing the worst and getting the best!
How about longer-term? Taking a look at the
Morningstar.com "5-Yr Restated" financials from Morningstar.com on HURC, we can see that revenue has actually been a bit erratic, declining from $96.2 million in 2000 to $70.5 million in 2002. Since 2002, revenue has been growing strongly to the current $119.6 million in the trailing twelve months (TTM).
Earnings also declined during the same period revenue was dropping slipping from $.84/share in 2000 to a loss of $(1.48)/share in 2002. Since that time earnings have grown strongly and consistently to the $1.83 reported in the TTM.
Free cash flow has remained positive, with $5 million reported in 2002, increasing to $7 million in the TTM.
The balance sheet looks solid with $12.9 million in cash and $55.8 million in other current assets easily covering both the $30.4 million in current liabilities and the $4.4 million in long-term liabilities.
How about some valuation numbers? Reviewing
Yahoo "Key Statistics" on HURC, we can see that this is a small cap stock with a market capitalization of only $169.86 million. The trailing p/e is downright cheap at 14.98, with a forward p/e (fye 31-Oct-6) of only 12.09. There isn't any PEG reported, but with the latest 200% growth in earnings, this has to be under 1.0!
Reviewing information from the
Fidelity.com eResearch website, we see that HURC has a Price/Sales ratio of only 1.2. This is the lowest in the "Scientific/Tech Instruments" Industrial Group. Leading off this group is Garmin (GRMN) with a Price/Sales ratio of 6.8, followed by Flir (FLIR) at 3.8, Agilent (A) at 2.5, Beckman Coulter (BEC) at 1.5, Fisher Scientific (FSH) at 1.5, and at the bottom, with the cheapest valuation was Hurco (HURC) at 1.2.
Looking back at Yahoo for some additional valuation numbers, we find that there are only 6.22 million shares outstanding. To top off this low float, there are 633,930 shares out short as of 11/10/05, representing 12.40% of the float or 5.8 trading days of volume. I would suspect that the strong price action today included some short-sellers scrambling to cover their negative "bets" as the stock climbed strongly!
The company does not pay a dividend and no stock split has been reported on Yahoo.
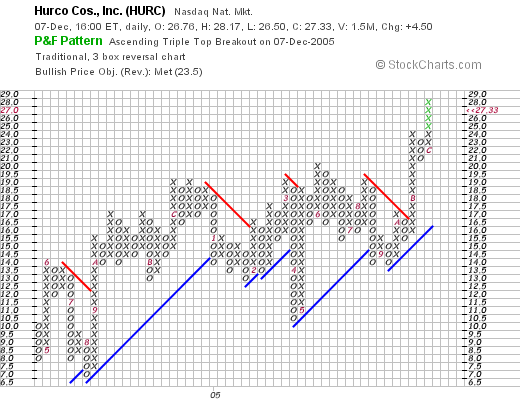
What about a chart? Looking at a
"Point & Figure Chart" on HURC from Stockcharts.com, we can see that the stock seemed to be moving higher between May, 2004, and January, 2005, when the price climbed from a low of $7.00 to a high of $19. However, after that the stock sold off back to the $10.50 level where it found new resistance, and appears overall to be trading higher now. The chart looks strong and not very over-extended imho.
So let's summarize, the company a week ago delayed earnings results causing a bit of a panic with investors. Then instead of reporting problems, they announced fabulous earnings for the quarter! The company, at least for the last 3-4 years has been steadily growing revenue and earnings, they are free cash positive, have a solid balance sheet, great valuation numbers with a low p/e and a low Price/Sales ratio. Even the chart looks strong!
Unfortunately, I don't have a buy signal from my own portfolio, otherwise, this might have been where I would be shopping!
Thanks again for stopping by and visiting! If you have any questions or comments, please feel free to leave them on the blog or email me at bobsadviceforstocks@lycos.com.
Bob
Monday, 5 December 2005
Another ***PODCAST*** on the SBUX and BOOM Trades
Hello Friends! Thanks so much for stopping by and visiting my blog,
Stock Picks Bob's Advice. As always, please remember that I am an amateur investor, so please remember to consult with your professional investment advisors prior to making any investment decisions based on information on this website.
A few moments ago I published a
***PODCAST*** on SBUX and BOOM "Trading Transparency". Please click on the above and you can listen to me talking to you about the topics and recent letters.
Regards!
Bob
"Trading Transparency" SBUX and BOOM
Hello Friends! Thanks so much for stopping by and visiting my blog,
Stock Picks Bob's Advice. As always please remember that I am an amateur investor, so please remember to consult with your professional investment advisors prior to making any investment decisions based on information on this website.
One of the things I like to do on this blog is to share with you my actual trades in my trading account. I do this to help you understand that what I talk about are things that I actually implement, to provide you with an insight on my strategy and the successes or failure associated with them. I do not post them so that you can copy my trades; in fact, I would discourage that, but instead hopefully you will learn to pick stocks and invest in ways that are most suitable for you!
My own strategy of selling stocks includes selling portions of the stocks I own as they appreciate in price. I like to say that I like to sell losing stocks quickly and completely, and sell gaining stocks slowly and piecemeal.
I have adjusted my selling program to sell only 1/6th of my holding (instead of the previous 1/4 postion) at each of my targeted appreciation points. When I worked on the mathematics behind this, by simply setting up a theoretical position, I found that as I suspected, if I continued selling 1/4 of my position, then the position would gradually dwindle in size. Selling 1/6th left the position intact for multiple sell points.
Currently my targeted appreciation points, which are clustered in groups of four, are at 30, 60, 90 and 120%; and then by 60% intervals: 180, 240, 300, and 360%; and then by 90% intervals: 450, 540, 630, 720, and then by 120% intervals, etc. At each of these points, I plan on selling 1/6 of my remaining shares of the stock in question. I haven't hit all of those higher points, but I have sold shares of QSII at a 450% appreciation level. These sale points are not entirely theoretical.
I recently had an email by a reader who asked about how I monitored my stocks and implemented sales. I am sure there are much better ways than what I do, but I just simply look at my holdings, and my Fidelity account allows me to see the percentage gainers as well as the previous sales on each holding. I do the 'mental math' figuring out the # of sales and the % targeted gain, and usually can easily figure out when it is time to sell.

In fact earlier this morning, in spite of the weak market, my Starbucks (SBUX) stock hit a sale point. I had 70 shares remaining in my portfolio, so rounding down 1/6 of 70, worked out to 11 shares. And I sold 11 shares this morning at $31.95. These shares had been purchased 1/24/03, slightly before I started by blog, at a cost basis of only $11.40/share. Thus, I had a gain of $20.55 or 180.3% on the investment. This was my fifth sale of Starbucks, having sold shares 9/8/03, 1/23/04, 6/18/04, and 12/03/04. Thus, having sold at the 30, 60, 90, and 120% level of appreciation, my target was a 180% level, and the stock just hit that target! You will note that instead of selling 1/4 of my position, I only sold 1/6th!
What will be my next sale point on SBUX? Assuming the stock does not announce some fundamentally bad news, that would push me to arbitrarily sell the shares, I will be selling 1/6th of my position on the upside if the stock hits a 240% gain....which would amount to 3.4 x $11.40 = $38.76. If the stock should decline, I plan on selling ALL of the remaining shares at 50% of the highest gain, that is at a 90% appreciation point = 1.9 x $11.40 = $21.66.
Going a bit further, since I am under my 25 position maximum, even though the market is in a bit of a funk as I write, (the Dow is down 57.14 at 10,820.37, and the NASDAQ is down 18.41 at 2,254.96), this sale gives me permission to add a position. And there are almost always candidates to purchase that fit my strategy :).
With that nickel burning a hole in my pocket I went right away over to the percentage gainers lists. Looking through the
list of top % gainers on the NASDAQ, I recognized a stock that I had reviewed previously. Dynamic Materials (BOOM) was
reviewed on Stock Picks Bob's Advice on May 23, 2005. I went ahead and purchased 240 shares of BOOM for my trading account at $28.27 a short while ago. As I write this, BOOM is trading at $28.84, up $4.69 or 19.42% on the day.

Let's briefly review some of the recent information on BOOM and I will show you why I think it fits my strategy!
First the Yahoo "Profile" on Dynamic Materials:
Dynamic Materials Corporation engages in metalworking business in North America, western Europe, Australia, and the Far East. The company operates in two segments, Explosive Metalworking and Aerospace. The Explosive Metalworking segment utilizes explosives to perform metal cladding and shock synthesis. Its principal product is a explosion welded clad metal plate, which is used in the construction of heavy, corrosion resistant pressure vessels, and heat exchangers for petrochemical, refining, and hydrometallurgy industries. The Aerospace segment provides welding services principally to the commercial and military aircraft engine markets, and to the power generation industry.
And the news on Boom: As
reported today:
CHICAGO, Dec 5 (Reuters) - Metalworking company Dynamic Materials Corp. (BOOM.O: Quote, Profile, Research) on Monday said its AMK Welding division has entered a five-year supply agreement with General Electric Co. (GE.N: Quote, Profile, Research) , sending shares to an all-time high.
Clearly the street liked this piece of good news and the stock charged higher in the face of an overall weak equity market!
And the last quarter result? (even without this news): On November 8, 2005, BOOM
reported 3rd quarter 2005 results. Revenue came in at $20.2 million, up 68% from last year's $12.1 million. Profit came in at $3.15 million or $.52/share, compared with $834,000 or $.16/share the prior year. This is a growth of over 200% in net income!
And the Morningstar results? Looking at the
"5-Yr Restated" financials on BOOM from Morningstar.com, we can see an almost perfect (except for a dip from 2002 to 2003), growth in revenue from $24.3 million in 2000 to $76.1 million in the trailing twelve months (TTM).
Earnings have been erratic, dropping from $.27 in 2001 down to a loss of $(.06) in 2003, then increasing to the current $.79/share in the TTM.
Free cash flow has remained positive with $4 million reported in 2002, $2 million in 2003, $3 million in 2004 and $4 million reported in the TTM.
The balance sheet, as reported by Morningstar.com, looks solid with $1.4 million in cash and $29.2 million in other current assets, easily covering both the $12.0 million in current liabilities and the $6.8 million in long-term liabilities.
And a chart? Looking at a
"Point & Figure" chart on BOOM from Stockcharts.com:
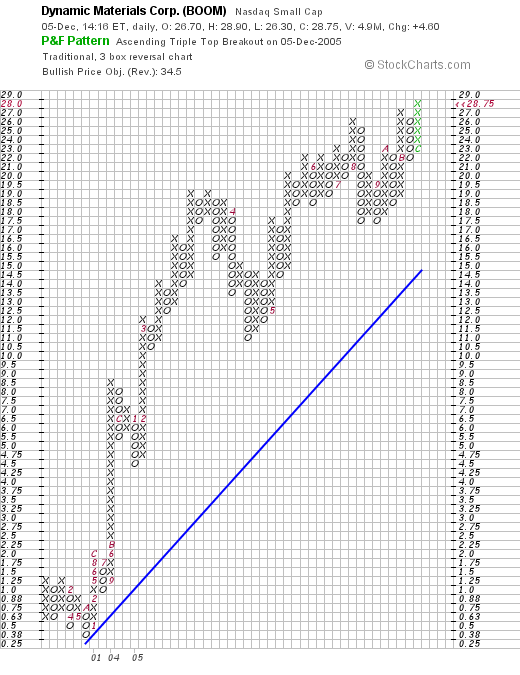
We can see a very strong stock chart with the stock price dipping to $.38/share in November, 2000, then climbing steadily and dynamically to the current $28.75 level.
Anyhow, I sold some SBUX and picked up some shares of BOOM. The rest is all of the details :).
Thanks again for stopping by! Please write me at bobsadviceforstocks@lycos.com or just write a note on the blog! Hope that you have a great week!
Bob
Newer | Latest | Older


